Indonesia: Pricing Reforms, Social Assistance, and the Importance of Perceptio ............133
Introduction ........................................................................................................................133
Country Economic and Political Context ...........................................................................134
Reform of Gasoline and Diesel Subsidies ..........................................................................142
Understanding the Circumstances That Enabled Reform .................................................174
Conclusions .......................................................................................................................189
Annex 4A Political Chronology of Indonesia ......................................................................190
Annex 4B Chronology of Energy Subsidies .......................................................................194
Notes ..................................................................................................................................196
References .........................................................................................................................198
Beaton, Lontoh, Wai-Poi
VIP Independent Call Girls in Andheri 🌹 9920725232 ( Call Me ) Mumbai Escorts...
Chapter 4 The Political Economy of Energy Subsidy Reform Indonesia - Lontoh Beaton
1. 133
C H A P T E R 4
Indonesia: Pricing Reforms, Social
Assistance, and the Importance of
Perceptions
Introduction
For many years, Indonesia has subsidized a range of energy products and services:
gasoline, diesel, kerosene, liquefied petroleum gas (LPG), and electricity. These
have been costly policies, with Indonesia having spent 1–4 percent of gross
domestic product (GDP) on gasoline and diesel subsidies alone every year since
the start of the 21st century. This chapter focuses on gasoline and diesel:
Indonesia’s oldest subsidy policies as well as its most expensive and regressive.
The chapter begins by reviewing the economic, fiscal, and political context
surrounding these subsidies. It then places them in their historical context, outlin-
ing the history surrounding their creation as well as the six major reform attempts
since the 1997–98 Asian Financial Crisis. These attempts include six ad hoc price
increases, three ad hoc price decreases, and two periods when prices have been
subject to frequent formula-determined adjustments. The chapter focuses in par-
ticular on the most recent reforms: a November 2014 price hike and a January
2015 introduction of a new pricing system. It describes the impacts of this period
of policy change before identifying some of the major forces that have determined
the political viability of gasoline and diesel subsidy reform at different times.
Several themes arise in the course of the discussion. One is the importance of
distinguishing between analyzing the political economy of a subsidy policy (how
its benefits are distributed) and analyzing the political economy of the types of
attempted reforms (which typically result in both costs and benefits that may
change over time and vary according to their specific design). This latter task—
analyzing specific types of reforms—requires some precision in defining “reform.”
The chapter proposes at least three types of change that could be defined as a
2. 134
reform, that may or may not be implemented in unison, with each having faced
its own political economy challenges in Indonesia: (a) ad hoc price increases,
(b) institutional changes to the underlying pricing system, and (c) complemen-
tary changes to the government’s capacity to target assistance with nonsubsidy
policies.A fourth can also be considered for inclusion: informational changes that
alter the state of public knowledge about subsidies and reform plans.
Another theme is the importance of social assistance in mitigating the impact
of reforms over time and the virtuous circle that can take place between subsidy
reforms and investments in social assistance capacity.As countries develop more-
sophisticated tools to assist businesses and households, it becomes easier for them
to manage some of the negative impacts of higher energy prices through more-
effective, more-efficient policy tools.At the same time, subsidy reforms can liber-
ate funding that allows for investments in social assistance capacity. Most of
Indonesia’s fuel price increases have been coupled with some form of support
targeted at the needy, and as this support has improved over time, so too has the
likelihood of successful price increases.
Yet a third significant theme is the importance of perceptions when it comes
to subsidies that are available to an entire population: Understanding who ben-
efits from such subsidies does matter, because it is natural to assume that benefits
will be distributed disproportionately across different segments of the popula-
tion. But it may be equally important to understand who thinks they will benefit,
because these perceptions underlie public opinion that enables or obstructs
reforms at a popular level. As such, “informational” reforms—interventions
intended to improve the state of information about subsidies, designed with
knowledge about popular perception in mind—can serve to increase a govern-
ment’s political operating space over time.
Country Economic and Political Context
Economic Growth
Indonesia has a long history of state intervention to circumscribe competition
and create large, strong state-owned enterprises. This pattern was cemented into
place after independence in the 1940s and a succession of two autocratic govern-
ments, and despite the transition to democracy, it is still evident in the economy
today. Throughout the country’s history, resource wealth has had a significant
impact on economic development, with oil price booms in the 1970s and 1980s
helping to drive high growth rates, and extractive industries more generally pro-
viding a high share of government revenue (see annex 4A for a full list of major
political events in Indonesia from 1871 to 2015).
Today, Indonesia is regarded as one of the world’s most successful emerging
economies. It is part of the MINT group (Mexico, Indonesia, Nigeria, and
Turkey)—countries“hot on the heels of the BRICS”(Brazil,the Russian Federation,
India, China, and South Africa) (Coface 2014; O’Neill 2013). The country has
achieved an average growth rate since 1980 of 5.5 percent (figure 4.1), and with
a 2014 GDP of US$889 billion, it is the 16th-largest economy in the world.1
3. 135
The extraordinary pace of Indonesia’s development has not been without com-
plications. The 1997–98 Asian Financial Crisis still looms large in recent memory.
It caused Indonesia’s GDP to contract 13.5 percent in 1998 alone, revealing
significant structural and governance problems and triggering the transition to the
current democratic regime.
A key concern of current economic policy is to avoid falling into a “middle-
income growth trap”: an extended period of stagnation that many fast-growing
developing countries experience after reaching middle-income status (World
Bank 2014b). Typically, this stagnation results from a slowdown in productivity
growth as countries exhaust their potential to reallocate workers from low-
productivity agricultural sectors to more-productive manufacturing sectors using
catch-up technologies imported from abroad. The trap is made worse by failures
to invest in the education and infrastructure required to increase competitiveness
in high-skilled “innovation” or “design” labor (Agénor, Canuto, and Jelenic 2012).
Mindful of such risks, government priorities today are to maintain high
growth rates, ensure that growth is inclusive, and promote further economic
diversification and the expansion of domestic capacity in value-added economic
activity.Economic policy also emphasizes the importance of exploiting Indonesia’s
“demographic dividend”—the period in which over half the country’s population
is under 30, which is due to end in Indonesia around 2025–30 (Bappenas 2015).2
Poverty Reduction
Since recovery from the Asian Financial Crisis, poverty has continued to fall
in Indonesia, albeit at a slowing rate. On the basis of the national poverty line
(Rp 330,776 or US$24.50 per month in March 2015), poverty rates decreased
from around 18 percent of the population in 2002 to around 11 percent in
Figure 4.1 GDP Growth in Indonesia, 1980–2014
–15
–12
–9
–6
–3
0
3
6
9
12
15
1980
1983
1986
1989
1992
1995
1998
2001
2004
2007
2010
2013
GDPGrowth,percent
GDP growth Linear GDP growth trend
Source: World Development Indicators Database.
4. 136
2014 (figure 4.2, panel a). However, the annual reduction in recent years has
approached zero (World Bank 2015) alongside a growing gap in the relative
wealth of rich and poor (figure 4.2, panel b).
Poverty rates remain higher in rural areas, although the reduction rate has
been similar in both rural and urban areas over the past decade. Furthermore,
many households remain close to the poverty line. Using a poverty line that
Figure 4.2 Poverty and EquityTrends in Indonesia
0
10
20
30
40
50
60
a. Poverty rates, 2002–14a
2002
2003
2004
2005
2006
2007
2008
2009
2010
2011
2012
2013
2014
National poverty line1.5x poverty rate
Povertyheadcount,percent
b. Gini index, 2005–13b
0.30
0.32
0.34
0.36
0.38
0.40
0.42
Giniindex
2005
2006
2007
2008
2009
2010
2011
2012
2013
Source: Poverty rate and Gini index based on World Bank calculations using data from the National
Socioeconomic Survey (SUSENAS) of the Central Statistics Agency (Badan Pusat Statistik, BPS), http://
microdata.bps.go.id/mikrodata/index.php/catalog/SUSENAS.
a.The national poverty line is based on the cost of 2,100 calories per person per day along with a small nonfood
allowance for basic necessities. It rose from Rp 108,889 (US$10.89) per month in 2002 to Rp 312,328 (US$26.03)
per month in 2014.The poverty“vulnerability”line in Indonesia is defined as 1.5 times the national poverty line.
b. The Gini index measures the inequality of income distribution. A value of 0 indicates full equality, and 1
indicates maximum inequality.
6. 138
(15.4 percent) and middle-income countries (18.1 percent) and significantly
below the average for high-income Organisation for Economic Co-operation
and Development (OECD) countries (23.5 percent).3
Expenditure has consis-
tently exceeded revenue collection (figure 4.4, panel a), but the deficit in
all years has remained below 3 percent of GDP, in compliance with a legally
binding budgetary rule.
Extractive industries contribute a significant share of revenues. In 2014,
the energy and mineral sector accounted for 25 percent of state revenue,
with 18 percent contributed by oil and gas and 7 percent by mining (led
by coal, tin, and copper) (DEN 2015). This revenue share is 14 percent
lower than in 2013 because of declining oil and gas production as well as
a ban on mineral exports (DEN 2015), which the government introduced
to stimulate businesses to invest in domestic added-value industries in
the mineral sector. Falling revenue from energy and minerals has driven
efforts to increase revenue collection from other sources and to broaden the
tax base.
Subsidy Expenditure
Various categories of subsidies make up a significant share of government expen-
diture in Indonesia. Before reforms in 2015, the largest among them was “fuel
subsidies,” a term encompassing subsidies for gasoline and diesel automotive fuels
as well as for LPG (a cooking fuel) and, in some parts of the country, kerosene
(both a cooking and lighting fuel). This group of “fuel subsidies” sits within
the broader category of “energy subsidies,” comprising both fuel subsidies and
electricity subsidies. In addition, “nonenergy subsidies” include subsidies for rice,
fertilizers, some rail and sea transport, and assistance to small and medium enter-
prises (SMEs).
In 2013, gasoline subsidies made up 6.0 percent of all government expendi-
ture, diesel subsidies 4.4 percent, LPG 1.9 percent, kerosene 0.4 percent, and
electricity 6.1 percent, as shown in figure 4.3 (BPK 2014). Nonenergy subsidies
made up around 3 percent of government expenditure.
The high cost of energy subsidies has constrained the fiscal resources available
for other purposes such as spending on education and health (Bi et al. 2014), as
shown in figure 4.4, panel b. Energy subsidy expenditure over the past decade—
including subsidies for gasoline, diesel, LPG, kerosene, and electricity—has taken
up a large share of public expenditure, in most years around 10–20 percent of all
central state expenditure, equivalent to around 3 percent of GDP, as shown in
figure 4.4, panel a.
Energy subsidies have also been a source of significant fiscal uncertainty
because budgeted subsidy expenditure has been contingent on typically optimis-
tic assumptions about world oil prices, exchange rates, and domestic crude
production—assumptions that have required, in most years, significant and
politically complex negotiations over midyear budget revisions (Lontoh, Beaton,
and Clarke 2015; Lontoh, Clarke, and Beaton 2014).
7. 139
Other Development Expenditure
Partly because fuel subsidies lock up such a large share of expenditure, the
Indonesian government’s expenditure on other key areas of development has
been low relative to other countries. Various sources calculated the country’s
2011 government expenditure on health as being between 1.8 percent of all
“central government” expenditure (Bi et al. 2014) and 6.2 percent of “total gov-
ernment” expenditure (WHO 2014). In contrast, the Southeast Asian regional
average was 8.7 percent, and lower-middle-income countries’ average was
8.1 percent in the same year (WHO 2014).
Indonesia also has ranked among the worst-performing lower-middle-income
countries in Southeast Asia on the Asian Development Bank’s (ADB) social pro-
tection index, based on the country’s allocation of only 1.2 percent of GDP for
social protection in 2009 (ADB 2013). The average for Asian Pacific economies
in the same year was estimated to be about 5 percent of GDP (OECD 2014).
In addition, it is estimated that Indonesia’s total infrastructure investment
over the past decade—around 3–4 percent of GDP—has been around half
of what has been needed, costing the country around 1 percent of economic
Figure 4.3 Subsidies as a Share of the Indonesian Budget, byType, 2013
0
2
4
6
8
10
12
14
16
18
20
Gasoline Automotive
diesel
Kerosene LPG Electricity
Nonenergy
subsidies
Energy
subsidies
Subcomponents of "energy subsidies"
Shareofstateexpenditure,percent
Source: BPK 2014.
Note: LPG = liquefied petroleum gas.“Share of state expenditure”includes transfers to regions.“Energy subsidies”comprise all fuel and electricity
subsidies.“Nonenergy subsidies”include subsidies for rice, fertilizer, some rail and sea transport, and assistance to small and medium enterprises.
8. 140
Figure 4.4 Government Revenue, Expenditure, and Fuel SubsidyTrends in Indonesia
0
5
10
15
20
25
a. Revenues, expenditure, and energy subsidies as a share of GDP, 2005–13
ShareofGDP,percent
Revenue
Expenditure Energy subsidies (fuel + electricity)
Fuel subsidies
2005
2006
2007
2008
2009
2010
2011
2012
2013
b. Spending on energy subsidies, education, and health as a share of
central government expenditure, 1995–2011
Shareofgovernmentexpenditure,percent
0
5
10
15
20
25
30
35
1995
2000
2005
2010
2015a
HealthEducation Fuel subsidies
Sources: Bank Indonesia Special Data Dissemination Standard (SDDS), http://www.bi.go.id/sdds/; Bi et al. 2014, updated by
the World Bank for this chapter. Government of Indonesia budget documents, various years, http://www.bpk.go.id/lkpp.
9. 141
growth each year (World Bank 2014a).This contrasts with infrastructure spend-
ing of around 7 percent in Thailand and Vietnam and 10 percent in China
(World Bank 2014b).
Political System
In its first 50 years following independence, Indonesia was led by two autocratic
governments, first by President Sukarno (1947–67) and then by President
Suharto (1967–98). Suharto’s regime fell in the aftermath of the Asian Financial
Crisis, and since then the Indonesian political system has undergone a significant
democratic transformation, a period known as Reformasi (Reform). Today,
Indonesia is a presidential representative democratic republic. The president
has fairly strong executive powers, with the capacity to block legislation and
influence the formulation of implementation guidelines (Datta et al. 2011).
The system is nonetheless marked by an uncommonly strong counterbalanc-
ing of power in the parliamentary branch of government—the People’s
Representative Council (DPR), explicitly named the country’s lawmaking
institution. Both executive agencies and ministers of parliament can draft legisla-
tion, and the DPR is expected to play an accountability role with respect to
government (Datta et al. 2011).With respect to subsidy policy, the most notable
exercise of this accountability function has been in approving the annual state
budget.The budget is formulated each year by the government proposing a draft
in August and parliamentarians then debating and approving items at a highly
detailed level. Parliamentary sectoral commissions have significant influence,
with the power to place a “hold” upon disbursements until their concerns have
been addressed (Blöndal, Hawkesworth, and Choi 2009). Another key feature
of the political system is an ongoing process of decentralization of power to the
country’s 34 provinces.
This political system reflects not only the country’s transition away from
decades of rule by two strong military heads of state but also a set of cultural
norms that places high value on negotiation and consensus. Some argue that the
Suharto regime’s oligarchic elites continue to play too strong a role in the politi-
cal system, engaging in an unacceptable degree of rent-seeking behavior. Others
emphasize the significant progress that has been made toward a functioning
democratic state while accommodating these elements from the old regime
(Datta et al. 2011).
In either case, the shift to democratization appears to have led to a fragmen-
tation of power and the rise of a number of similarly powered political parties.
Following the 2014 legislative elections, parliamentary seats were fairly well
distributed among Indonesia’s 10 major political parties. Four of them—the
Indonesian Democratic Party of Struggle (PDI-P), the Party of the Functional
Groups (Golkar), the Great Indonesia Movement Party (Gerdindra), and the
Democratic Party—each secured more than 60 of the 560 seats in the DPR.
The share of electoral votes captured by major parties has, however, consis-
tently declined since 1999, indicative of a gradual diffusion of political power
(Datta et al. 2011).
11. 143
Figure 4.6 Oil Production, Consumption, and Price in Indonesia, 1965–2014
0
200
1965
1967
1969
1971
1973
1975
1977
1979
1981
1983
1985
1987
1989
1991
1993
1995
1997
1999
2001
2003
2005
2007
2009
2011
2013
2014
400
600
800
1,000
1,200
1,400
1,600
1,800
0
20
40
60
80
100
120
140
Priceperbarrel,US$(2014)
Barrelsperday,thousands
Production ConsumptionPrice
Source: BP 2015.
Note: From 1965 to 1983, spot price is Arabian Light posted at Ras Tanura. From 1984 to 2014, spot price is Brent dated. Spot prices are inflated
to 2014 dollars.
Figure 4.7 Fuel Imports in Indonesia, 2005–14
25,000
Kiloliters,thousands
20,000
15,000
10,000
5,000
2005 2006 2007 2008 2009 2010 2011 2012 2013 2014a
0
RON 88KeroseneADO
Avtur + AvgasRON 92 + RON 95 + HOMCFuel oilIDO
Source: DEN 2015.
Note: Avtur = aviation fuel. Avgas = Aviation gasoline. HOMC = High Octane Mogas (motor fuel) Component. ADO = Automotive diesel oil.
IDO = Industrial diesel oil. Gasoline octane ratings are expressed by their Research Octane Number (RON).
a. Temporary data.
for the state-owned oil company, Pertamina, to adequately supply more-remote
regions; (b) requiring rationing in some years to avoid exceeding the approved
quota for subsidized fuel; (c) causing hoarding in anticipation of price increases;
and (d) incentivizing smuggling and illegal marketeering at above-official prices
(GSI-IISD and IESR 2012; Harvey 2005; Listy, Kristanto, and Parikesit 2014;
12. 144
Lontoh, Beaton and Clarke 2015; Sadmoko, Leonal, and Rahadiana 2014;
Suherdjoko and Muryanto 2013; Susanto and Suherdjoko 2013).
Similarly, the State Electricity Company (Perusahaan Listrik Negara, or PLN)
has for various reasons—including poorly financed electricity subsidies and the
challenges of electrification across a large archipelago nation—achieved an elec-
trification rate of 84.4 percent by 2014. However, 32.2 percent of households
still cook primarily with firewood (DEN 2015).
Energy Consumption
Energy demand in Indonesia has grown strongly in tandem with economic
growth, averaging a 5.5 percent annual increase since 2004 (DEN 2015). In
the transportation sector, the consumption of “Premium” brand (88-octane)
gasoline—the subsidized grade of gasoline—has more than doubled since 2000,
while nonsubsidized 92-octane and 95-octane gasoline5
remain a small share of
overall supply (figure 4.8, panel a).6
This growth in fuel demand has been matched by an enormous uptick in
vehicles that use this fuel.The number of private vehicles, notably motorcycles, in
Indonesia has more than quadrupled between 2000 and 2010 (figure 4.8, panel b).
History of Gasoline and Diesel Subsidies
This subsection reviews, first, the origins of gasoline and diesel subsidies in
Indonesia; second, their early history; and third, the major attempted reforms
from 2000 to 2013. Because of the complexity of understanding any given
period of subsidy reform—ideally including information on the political context,
pricing changes, compensation measures, actual economic and social impacts, and
public perceptions—this subsection identifies only the most salient aspects of
reforms during this period for which information is readily available in existing
literature. The next subsection (“The 2014–15 Reform of Gasoline and Diesel
Subsidies”) then describes Indonesia’s most recent policy changes—in November
2014 and January 2015—in greater detail. See annex 4B for a full chronology of
events and policies related to energy subsidies from 1956 to 2015.
Birth of the Indonesian Gasoline and Diesel Subsidy
Some form of fuel subsidy has existed in Indonesia since at least the 1960s
(Hunter 2007; Woo and Nasution 1989). However, it was not acknowledged
officially until the state budget of fiscal year 1977/78.
Fuel subsidies began with support for kerosene, diesel, and fuel oil (Hope and
Singh 1995;World Bank 1983). Kerosene was subsidized (a) for economic reasons
linked to inflation, and (b) for social and environmental reasons linked to modern
energy access and deforestation. In the early 1980s, kerosene accounted for 32 per-
cent of all consumption of commercial energy, so it was feared that price increases
would have a significant inflationary impact (World Bank 1983). State-owned
electricity company PLN covered only 5.7 percent of the villages in Indonesia;
24.3 percent of the population lived in poverty;7
80 percent of kerosene consump-
tion was among households; and 50 percent of total energy consumption came
13. 145
Figure 4.8 Gasoline Sales andVehicle OwnershipTrends in Indonesia, 2000–13
2000 2004 2008 2012
RON 88 11.9 15.8 19.7 28.5
RON 92 0.0 0.5 0.3 0.7
RON 95 0.0 0.1 0.1 0.1
0
5
10
15
20
25
30
Kiloliters,millions
2000 2001 2002 2003 2004 2005 2006 2007 2008 2009 2010 2011 2012 2013
Passenger car 3.0 3.2 3.4 3.8 4.2 5.1 6.0 6.9 7.5 7.9 8.9 9.5 10.4 11.5
Buses 0.7 0.7 0.7 0.8 0.9 1.1 1.4 1.7 2.1 2.2 2.3 2.3 2.3 2.3
Trucks 1.7 1.8 1.9 2.0 2.3 2.9 3.4 4.2 4.5 4.5 4.7 5.0 5.3 5.6
Motorcycles 13.6 15.3 17.0 20.0 23.1 28.5 32.5 42.0 47.7 52.8 61.1 68.8 76.4 84.7
0
10
20
30
40
50
60
70
80
90
Vehicles,millions
RON 88 RON 92 RON 95
Passenger cars BusesTrucksMotorcycles
a. Gasoline salesa
b. Vehicle ownership
Sources: ESDM 2014; Central Statistics Agency (Badan Pusat Statistik, BPS) database, http://www.bps.go.id/linkTabelStatis
/view/id/1413.
a. RON = Research Octane Number. The consumption statistics reported here do not include Pertalite, a nonsubsidized
90-octane fuel not introduced until 2015, after the period covered by the figure.
14. 146
from traditional fuel such as firewood and agricultural waste (World Bank 1983,
1984, 1990).The subsidy was intended to help extend a more convenient, cleaner
cooking and lighting fuel to communities with poor energy access.
Diesel was subsidized at the same time as a way to help Indonesian businesses
compete internationally.This subsidy policy was poorly targeted, covering all kinds
of firms whether or not they contributed to the national goal to boost exports.
By contrast, the price of gasoline was largely higher than its cost, with some
exceptions due to sudden international price changes—standing, for example, at
2.6 times more than the border (reference) price in 1986.This arrangement existed
to allow a cross-subsidy from gasoline to kerosene,according to Subroto,Indonesia’s
former minister of energy and natural resources (1978–87) who became secretary-
general (1988–94) of the Organization of Petroleum Exporting Countries (OPEC)
(Subroto 2005). Gasoline subsidies first became entrenched at some point in the
early 1990s, although sources reviewed by this study did not identify precisely
when, potentially because of poor budgetary transparency at the time.
The fuel subsidy began to take on additional significance under the “New
Order” administration of President Suharto in the latter half of the 1970s.8
During this period, policy making had become more dependent on Suharto as
the ultimate decision maker, and technocratic support was becoming less and less
influential. The government shifted toward a more nationalistic development
policy, and many factors combined to motivate opposition against the regime
(Aspinall 2005; Bourchier and Hadiz 2003; Eklöf 2003; Smith 2005; Tuong
2010; Woo, Glassburner, and Nasution 1994):
Increasing army domination in virtually every aspect of life
A surge of foreign investment and imported goods
Windfall oil profits that were not translated into a better standard of living but
did increase the costs of living through impacts on exchange rates and food prices
Blatant mismanagement and corruption
Efforts to weaken other political parties through constitutional means
That resentment subsequently led to a power struggle, which culminated in an
infamous riot in January 1974 known as the Malari Incident (“Malari” being the
acronym, in Indonesian, for January Disaster).
According to Chalmers and Hadiz (1997), the New Order’s greater emphasis
on providing subsidies, including for fuel, was a response to such regime-
threatening criticisms (essentially, part of its broader effort to retain its grip on
power)—a view also shared by Strand (2013) and Vatikiotis (1998). Commodity
subsidies were chosen because the government had limited capacity to provide
direct, tangible handouts to citizens in any more targeted way. Robison (1986)
goes further, arguing that subsidies were part of a broader swath of policies
directly intended to enable capital accumulation, thereby winning support for
the government from powerful domestic stakeholders.
The subsidy policy also reflected Indonesia’s economic means. As a result of
the first two oil price shocks, the income from oil in the 1970s rose from around
15. 147
5 percent to over 50 percent of total government revenue by the mid-1980s
(Ooi 1982;Woo and Nasution 1989). Huge oil revenues allowed the government
to finance the subsidies. It also made the protectionist nature of subsidies rela-
tively secure from influence by international powers, given Indonesia’s strong
balance of payments position (Robison 1986; World Bank 1984).
End of the New Order and Recognition of Need for Reform
Some policy changes did occur under the New Order regime but largely to reduce
fiscal expenditure and promote efficiency, without any broader ambition of a need
for subsidy removal. For example, fuel price increases took place in 1980 and
1982–86, in response to a decline in international oil prices that saw annual GDP
growth fall from 8.7 percent in 1980 to 1.1 percent in 1982.9
The per-unit subsidy
on all fuels increased as a result, with even gasoline briefly being priced at less than
its cost (World Bank 1983). The balance of payments over the same period fell
from a surplus of 2.9 percent of GDP to a deficit of 4.7 percent of GDP.10
The
government responded by devaluating the rupiah and tightening expenditure,
including an increase in fuel prices (Woo and Nasution 1989; World Bank 1985).
In 1980, the adjustments raised gasoline and diesel prices to 50 percent of their
1979 levels; by 1986, gasoline prices had been increased to 260 percent and diesel
prices to 440 percent of their 1980 levels11
(figure 4.9). This left gasoline prices
at 1.5 times the border reference price and brought diesel prices above the border
reference price briefly before a return to subsidization (Hope and Singh 1995).
Figure 4.9 Gasoline and Diesel Price Adjustments (Nominal) in Indonesia, 1966–2000
0
200
19661967196819691970197119721973197419751976197719781979198019811982198319841985198619871988198919901991199219931994199519961997
M
ay5,1998
M
ay16,199819992000
400
600
800
1,000
1,200
1,400
Rupiahperliter(nominal)
Gasoline Diesel
Source: ESDM, n.d.
Note: From 1966 to 1983, spot price is Arabian Light posted at Ras Tanura. From 1984 to 2014, spot price is Brent dated. Spot prices are inflated to
2014 dollars. Data for 1997 and 1998 reflect the period preceding and following the onset of the Asian Financial Crisis in July 1997. In the wake of
increased popular unrest, President Suharto resigned on May 21, 1998.
16. 148
These reforms took place at the peak of the New Order regime, following a
maneuver to weaken opposition to the government that was so sweeping that it
was described as “the emasculation of the political parties” (Eklöf 2003).12
The
most devastating blow was the introduction of the “floating mass” doctrine,
which restricted public political activities outside the general election period and
prohibited political activities below the district level (Eklöf 2003). Political par-
ties had to rely on government subsidies to fund their operational activities
(Aspinall 2005; Bourchier and Hadiz 2003). As a result, these price increases
were implemented without meaningful social or political challenges.
The situation abruptly changed with the onset of the Asian Financial Crisis
in 1997. To help survive the crisis—which brought a 13 percent contraction of
GDP in 1998 alongside similarly drastic impacts on government deficits, foreign
direct investment, and inflation (table 4.1)—Indonesia sought assistance from
the International Monetary Fund (IMF).The government promised several major
reforms to acquire an SDR 7.3 billion13
(US$10.07 billion) loan through an IMF
Stand-By Arrangement, which, among other things, required the government to
remove the fuel and electricity subsidies by the end of March 1998 and provide
a transparent record of all subsidies in the state budget (Government of Indonesia
1997; IMF 1997).
Following months of discontent, the government implemented its commit-
ment with a fuel price hike in May 1998, which proved to be the “missing
piece” that shifted public opinion away from seeing Suharto as a good leader
surrounded by bad advisors and toward viewing him as one of the speculators
and corrupt businessmen who had caused the economic disaster. The ensuing
protests culminated in his stepping down and the transition to democracy.
Subsequent political leaders learned from Suharto’s experience that if fuel
price hikes lead to protests, the consequences can be politically devastating.
Australian scholar Greg Barton describes this period as follows:
Tension mounted throughout March and April, but Suharto was still very much in
control. Then on 4 May that control began to disintegrate. That day he announced
a reduction of subsidies on fuel that would cause a 70 percent price hike for petrol,
in line with IMF prescriptions. The announcement met a violent response.
Table 4.1 Indonesia Macroeconomic Indicators, 1996–99
Indicator 1996 1997 1998 1999
Foreign direct investment, net inflows
Source: World Development Indicators Database.
Note: Rp = rupiah. BoP = Balance of payments.
17. 149
Large-scale riots broke out in Medan, North Sumatra, and students began flooding
into the streets throughout Java. (Barton 2002, 235–36)
As writer and journalist Michael R. J. Vatikiotis further explains,
Then, Suharto blinked. No one quite knows what moved him to increase the price
of premium gasoline by 70 percent by removing subsidies on 4 May. The IMF was
certainly in no hurry to do so. The IMF team was afraid of sparking further unrest.
On cue, that’s just what happened. The subsequent rioting in the North Sumatran
capital of Medan on 4 and 5 May brought the simmering level of public discontent
to the surface. (Vatikiotis 1998, 226)
It was an IMF requirement during the loan payback period (1997–2006) for
successive democratic governments—including those of interim President B. J.
Habibie, followed by Wahid, Megawati, and the first years of Yudhoyono—to
reiterate the commitment to reduce the subsidy and improve transparency.
In the first few years of democratic government, little significant progress was
made, but some incremental steps were taken. For example, subsidies were
entirely removed from aviation fuel on February 1, 1999 (Government of
Indonesia 1999). This slow approach reflected more-immediate priorities at the
time: rescuing severely damaged banking sectors, resolving the debt problem, and
making some other major structural adjustments such as the divestment of state-
owned enterprises (IMF 2000). It also reflected anxiety that price hikes might
once again trigger mass protests that could topple a government.
Key Attempts to Reform Fuel Subsidies, 2000–13
The Indonesian government has attempted to reform gasoline and diesel subsi-
dies numerous times since the beginning of the 21st century. Key attempts dur-
ing this period to partially reform fuel subsidies—some successful, some
unsuccessful—are summarized below and described briefly in the subsequent
sections. They include six major episodes of reform: five ad hoc price increases,
three ad hoc price decreases, and two periods of frequent price adjustments
following a pricing formula.
In addition to these discrete reform events, two ongoing developments during
the 21st century entrenched the recognition that reform would align well with
the needs of domestic policy, above and beyond the conditions of the IMF loan.
These developments were (a) the increasing fiscal strain from the subsidies; and
(b) policy makers’ recognition, in the wake of the Asian Financial Crisis, that the
country lacked an adequate social safety net for the poor and vulnerable.
Fiscal Strain from Subsidies. Fuel subsidies became increasingly costly, partly
because of the ongoing decline in domestic oil production (as shown earlier in
figure 4.6). As a result, Indonesia had to purchase fuel internationally at world
prices to meet domestic demand rather than relying on domestically produced
oil products that it could procure at the cost of production. In turn, the subsidies’
affordability became contingent on volatile world oil prices, which significantly
appreciated during the first decade of the 2000s (figure 4.10). The costs of
19. 151
importing expensive fuel imports were further exacerbated by Indonesia’s
increasingly weak foreign exchange rate. These three factors—lower domestic
production, higher international prices, and a weakening currency—led to rapidly
ballooning subsidy costs. The improved budgetary transparency required by the
IMF also furthered recognition of the fiscal problem among policy makers.
Need for Social Safety Net. Policy makers also had realized during the Asian
Financial Crisis that they had lacked necessary tools to assist the poor and vulner-
able. To manage these impacts, they introduced a set of social safety net programs
in 1998 known as the Social Safety Net (Jaring Pengaman Sosial, or JPS), which
focused on areas such as in-kind subsidies for rice, health, scholarships, and grants
to schools in poor areas (Daly and Fane 2002; Perdana 2014).These tools were, by
design, structured according to theories of how best to reduce poverty by targeting
benefits to the poor.Although some analysts criticized their initial effectiveness, the
programs represented a new model of social assistance in Indonesia (Perdana 2014).
The growth of this administrative capacity over the next decade—and the
expenditure required to sustain and expand the social safety net programs—also
called in question the significant opportunity cost of the increasingly expensive,
untargeted fuel subsidies. Moreover, policy makers increasingly understood that
gasoline and diesel subsidies performed badly at supporting poor households,
which purchased very small quantities of these fuels and thus benefited only
indirectly from the fuel subsidies’ impacts on the price of staple goods. Instead,
gasoline and diesel subsidies predominantly benefited richer households, which
could afford to own vehicles and purchase large quantities of fuel: the richest
decile captured over 40 percent of the fuel subsidies (Agustina et al. 2008).
Pricing Formula, 2001–03. In March 2001, President Abdurrahman Wahid
ordered the domestic retail prices of five fuel products (88-octane gasoline, kero-
sene, automotive diesel, industrial diesel, and fuel oil) to be set at 50 percent of
the market price, with the option of increasing prices until they reached market
levels.14
At the time this policy was introduced, subsidized gasoline had been
59 percent of market price; automotive diesel, 30 percent; and industrial diesel,
28 percent.15 This price indexation was seen as the pathway to enacting a man-
date to gradually reduce subsidies in the National Development Program
(Propenas) 2000–04 (Bappenas 2000).
The stated motivation for the policy change was to reduce the fiscal burden
of fuel subsidies. The director of Pertamina was authorized to calculate a price
benchmark adjustment every month, but the decision to actually change domes-
tic retail prices rested with the president. Initially, the combination of the new
pricing system and the decline of international oil prices reduced fuel subsidy
expenditure significantly, from Rp 68.38 trillion (4.2 percent of GDP) in 2001
to Rp 31.62 trillion (1.7 percent of GDP) in 2002, although world oil prices had
also fallen slightly from their 2000 levels (figure 4.11).
Wahid’s successor, Megawati Sukarnoputri, extended the decree.16
Her
government adjusted the formula to set gasoline prices at market levels and diesel
21. 153
prices at 75 percent of market levels, within minimum and maximum price bands,
with adjustments to take place monthly (Beaton, Christensen, and Lontoh 2015).
Soon, the system was under pressure from the start of a steady rise in world
oil prices that would peak in 2008 and eventually come to be recognized as more
than just volatility; rather, it was a structural appreciation in world markets, largely
from increased global demand. Monthly fuel price adjustments were imple-
mented as planned, but they were met with ongoing student protests in Makassar,
Jakarta, Surabaya, Denpasar, Manado, and Bandung (Beaton and Lontoh 2010).
By the end of the year, prices had reached their top bands, and the fuel sub-
sidy expenditure had been reduced by around 50 percent compared with the
previous year.
Despite its initial successes, the formula-based system for regularly adjusting
prices was abandoned in January 2003 after a strong, widespread set of protests
against a fuel price hike that took place at the same time as (a) increases in prices
of electricity, sea and train transport, toll roads, LPG, vehicle taxes, and fresh
water; and (b) the introduction of a new, higher regional minimum salary
(Beaton, Christensen, and Lontoh 2015; Liputan6.com 2002a, 2002b; Nugroho
SBM 2003; Suara Merdeka 2002; Sumantyo 2003a, 2003b).
Bacon and Kojima (2006) report that a key motivation for the protests was a
belief that the government had been favoring powerful interest groups, as well as
general dissatisfaction with political corruption and inefficiency.Two major busi-
ness associations—the Indonesian Entrepreneur Association (Asosiasi Pengusaha
Indonesia, or Apindo) and the Indonesian Chamber of Commerce (Kamar
Dagang dan Industri Indonesia, or KADIN)—challenged the policy, although
they were particularly opposed to the increase in regional minimum salaries
(Liputan6.com 2002c, 2003a, 2003b).
In addition, the technocratic planning behind the reforms may have been rela-
tively weak. Shiraishi (2006) argues that the economic ministries that would
have been in charge of these reforms were not functioning as a cohesive and
coordinated team at the time, largely because of ongoing internal instability
while the new democratic governance system found its bearings. Sardini (2003)
acknowledges the government’s inadequate planning and strategy but argues that
the principal problem was insufficient direct communication between Megawati
and the public about the rationale for the reforms.
The protests’ success in preventing policy change likely stemmed from a com-
bination of different factors, all pointing toward the high value placed on political
stability:
Megawati’s decisions were likely influenced by the role that fuel price protests
had played in the rapid demise of the Suharto regime.
Indonesia was still in the midst of its recovery from the Asian Financial Crisis
and its transition to democracy.
The new Indonesian political system placed significant power, including on
fiscal decisions,in parliament’s hands.Wahid’s presidency was cut short directly
because of a tense political showdown with parliament, which demonstrated
22. 154
its power by removing Wahid (Barton 2002). Subsequent presidents thus took
a cautious approach in negotiating sensitive policies with parliament.
And the reforms had indeed caused divisions among political parties. Megawati
had failed to gain adequate support from parliament and had not complied with
a crucial procedural requirement to consult with parliamentarians on reforms
(Isra 2003). Even within Megawati’s own party, PDI-P, many members perceived
the policy changes as a liberal approach that was against their nationalist princi-
ples (Suara Merdeka 2003). Moreover, Megawati was due to stand for reelection
in 2004. It was good timing for opposition parties to exploit a publicly sensitive
issue and so weaken her popular support base.
Throughout the Wahid and Megawati attempts to remove subsidies, a com-
pensation package was provided—the Energy Subsidy Reduction Impact
Mitigation Program (Program Penanggulangan Dampak Pengurangan Subsidi
Energi, or PPD-PSE), which allocated Rp 2.0 trillion in 2001, Rp 2.9 trillion in
2002, and Rp 3.9 trillion in 2003 (0.1 percent, 0.2 percent, and 0.2 percent of
GDP, respectively). According to the Ministry of Finance’s state budget proposal
in 2005, this “social compensation on fuel and energy price increase” consisted of
support for education, health and social welfare, transportation, clean water
infrastructure, small enterprises, empowerment of coastal communities, unem-
ployment, provisioning of contraceptive devices, and monitoring and evaluation
of public complaints (Government of Indonesia 2004).
It is hard to assess the extent to which this compensation did or did not coun-
teract opposition to reform. The policies were, however, criticized for having a
disarrayed design and for not being launched in parallel to price hikes (Liputan6.
com 2003a, 2003b).
Constitutional Challenge to 2001 Petroleum and Gas Framework. In November
2001, a few months following her inauguration, Megawati signed into law a new
framework for the governance of the oil and gas sector, Law No. 22/2001.17
One
of the law’s main objectives was to further liberalize upstream and downstream
oil and gas markets. On the upstream side, Pertamina’s monopoly was disman-
tled, and its regulatory function was transferred to twin regulatory agencies
that answered to the president: the Executive Agency for Upstream Oil and Gas
(BP Migas) and the Regulatory Agency for Downstream Oil and Gas (BPH
Migas). On the downstream side, fuel distribution was opened up to private
companies, and Article 28 created a legal basis for prices to be “entrusted to the
mechanism of fair and reasonable business competition.”
This law was intended to establish the legal basis for a gradual transition to
market prices, which had already begun during Wahid’s presidency in early 2001.
But in January 2003, the same month that the formula-based pricing system was
disbanded,a challenge was brought against Law No.22/2001 to the Constitutional
Court.18
The claimants challenged a number of articles, including the Article
28 clause about fuel pricing. Their objections focused on the third clause of
Article 33 of the Indonesian Constitution: “The land, the water and the natural
23. 155
resources within them shall be controlled by the State and shall be used for the
greatest prosperity of the people.” The challenge argued that market pricing
would both prevent the government from ensuring the energy supply and make
Indonesia vulnerable to price manipulation by foreign powers. In addition, the
policy change was accused of being a part of a neoliberal agenda that ran contrary
to the values of the constitution (Beaton, Christensen, and Lontoh 2015;
Constitutional Court of Indonesia 2004; Mochtar 2015).
The court ruled in December 2004 that Article 28 was unconstitutional,
finding that the pricing system could not be completely entrusted to business
competition, although the government could make use of competition in deter-
mining prices (Constitutional Court of Indonesia 2004; Mochtar 2015). This
ruling set a precedent that effectively ruled out reforms that structurally take
gasoline and diesel pricing entirely out of the hands of political decision makers,
such as through an automatic pricing mechanism administered by an indepen-
dent body.
As a result of the court decision, the pricing system that the Megawati regime
had abandoned—a formula system that would automatically adjust prices to
reflect international oil price fluctuations—was viewed as a risky strategy to
reenact. Such a strategy would raise the possibility of a legal challenge, and the
court had left open a significant gray area as to exactly what degree of govern-
ment decision making might be required for a pricing system to be deemed
constitutional.
2005 Price Hikes under Yudhoyono. A former minister of energy, President Susilo
Bambang Yudhoyono took action on fuel prices swiftly after coming into office.
He was in a difficult position for several reasons:
World oil prices had continued to increase since the disbanding of the formula-
based pricing system in 2003, but domestic prices had not changed, so subsidy
costs were expanding rapidly.
The pace of change was increasing. The international crude price (West Texas
Intermediate) was recorded at US$38 per barrel in June 2004 and rose to
US$43 per barrel by December that year; in August of 2005 it had climbed
further to US$65 per barrel, while the exchange rate was weakening.19
Yudhoyono had inherited a state budget from Megawati that had based the
fuel subsidy on an assumption that the crude price would decline to as low as
US$24 per barrel in 2005 (Government of Indonesia 2004). During the pre-
vious Megawati presidency, the fuel subsidy was recorded at Rp 31.16 trillion
(1.7 percent of GDP) in 2002 and Rp 30.04 trillion in 2003 (1.5 percent of
GDP), but by the end of 2004 it had ballooned to Rp 69.02 trillion (3.0 per-
cent of GDP), as shown earlier in figure 4.10.
Trends in international food prices contributed to the sense of urgency: the
cost of purchasing food was increasing for poor and nonpoor Indonesians alike,
and technocrats argued that spending on social security was slight compared
with the increasingly bloated fuel subsidy.20
24. 156
On March 1, 2005, Yudhoyono increased the gasoline price by 33 percent, auto-
motive diesel by 27 percent, and kerosene by 22 percent. On October 1, 2005, he
again increased the gasoline price, this time by 88 percent, and automotive diesel
by 105 percent, though reducing the kerosene price by 9 percent. Many external
commentators viewed these changes positively (Donnan 2005), which also
showed that an Indonesian leader could increase fuel prices without losing office.
In the short term, the 2005 price hikes were a fiscal success, reducing subsidy
expenditure by about a third in 2006. They were also a political success, in that
they were large price increases that were not immediately reversed. The success
of the price hikes reflected several factors related to the broad political context
in which they took place:
Coalition building. After winning the election,Yudhoyono had adeptly brought
a number of parties into his governing coalition, ultimately securing 59 per-
cent of parliamentary seats and pleasing many of the economic and political
forces in the country (von Luebke 2010).
Shrewd appointments. He established a cabinet that reflected not only coalition
representatives but also a number of highly skilled technocrats, such as Jusuf
Anwar, an executive director of the ADB, as minister of finance; Sri Mulyani, a
former executive director on the board of the IMF as the minister of national
development planning; and Purnomo Yusgiantoro, former minister of defense
and the president-secretary general of OPEC, as minister of energy and min-
eral resources.
Weakened opposition. Yudhoyono’s main opposition, Megawati’s PDI-P party,
had suffered heavy losses in the 2004 general election and had only recently
attempted similar policy reforms, thus reducing its legitimacy in criticizing the
reforms.The Indonesian delegation to the European Union at the time opined
that opposition forces felt empathy for the government, given their own recent
struggles with the fuel subsidy (Osman 2005).
Analysis and preparation. The reforms were built on a great deal of analysis and
preparation after the failed reforms of 2001–03. Since then, an informal task
force of reform-minded economists and technocrats had been established and
analyzed various subsidies, their incidence, possible forms of compensation for
households and industry, and the elements of an effective communications
strategy.When Yudhoyono was inaugurated, some of these task force members
entered the administration in influential positions, carrying forward its think-
ing into government planning on subsidies.21
Yudhoyono’s personal approach to implementing subsidy reform also played an
important role. A president with a flamboyant, media-conscious character,
Yudhoyono understood how to use mass communications to build support for
difficult reforms, cultivating the image of a tough-minded reformer. In one
speech, delivered at the opening of the Indonesian Capital Market 2005 event in
February 2005, he proclaimed,“A leader should be willing to become unpopular.
That issue is second or third for me. Significant subsidy reduction resulting from
25. 157
the price increase is for justice. Shame on me if I still want to be popular, but I let
the economy fall and business pillars crumble” (Detik.com 2005).
Messaging from the rest of the government was coordinated through a com-
prehensive public communications strategy crafted by a professional advertising
firm. The messaging focused first on fairness, illustrated by the regressive nature
of the subsidy and the alternative priorities that could be afforded with the same
expenditure. Second, the messaging highlighted the government’s compensation
measures. A key element of the campaign was a full-page newspaper advertise-
ment signed by a number of prominent economists and public figures. In addi-
tion, senior officials received dedicated media training and briefing notes to
ensure that government figures would speak confidently and consistently with
one unified voice.22
Yudhoyono’s government also developed a more complex approach to
mitigating the impacts of subsidy reform, reflecting the background of the
technocrats in his administration. This included the development over only
six months of a registry of low-income households to target two uncondi-
tional cash transfer payments following price increases.23
The Bantuan
Langsung Tunai (BLT) program—a temporary unconditional cash transfer
program also known as Direct Cash Assistance—was specifically developed to
help compensate for the fuel subsidy reform. It was first used alongside the
October price increase, transferring to poor households a sum worth around
US$30. Three more payments were made over the first nine months of 2006
(World Bank 2012b).
On a technical level, the BLT was a solid success. It was costly but less so than
the fuel subsidy, particularly given its temporary nature, with the total expendi-
ture reported at Rp 23 trillion (0.8 percent of GDP) (World Bank 2012a).
Moreover, it was an administratively and logistically complex policy that had
been brought from conception to implementation in only five months.
There was undeniably significant room for improvement. The registry of
beneficiaries was identified largely through community-based targeting (asking
subvillage heads to identify poor households in their community) without a clear
basis for nomination. As a result, only 46 percent of the poorest 30 percent of
households received the payments (World Bank 2012b). Nonetheless, it was still
the best-targeted of all of Indonesia’s major social assistance programs—and
significantly better targeted than gasoline and diesel subsidies.
On a political level, the BLT was generally credited with alleviating some of
the political opposition to reform, but this did not come without complexities.
Attitude surveys conducted as part of a rapid appraisal found, on average, high
levels of satisfaction among beneficiaries with targeting, distribution, and the
frequency and size of payments (Hastuti et al. 2006). But there were also nega-
tive responses to its introduction. Initially, 15.5 million households (about
28 percent of the population) were pronounced eligible for payments. This was
met with protests from households who considered themselves to have been
unjustly excluded.The government responded by commissioning a second round
of surveys after having removed some beneficiaries and adding others, increasing
26. 158
the total registry of eligible households to 19.2 million (around 35 percent of the
population) (Bacon and Kojima 2006; Widjaja 2009).
Notably, according to the rapid appraisal, almost all village officials reported
negative impacts related to their role in helping to identify eligible households,
which in some cases affected their ability to carry out their official duties
(Hastuti et al. 2006). As such, it has been hypothesized that the BLT may actu-
ally have helped to redirect political dissatisfaction with subsidy reform away
from the central government, although this was unlikely to have been a conscious
intention of policy design (Beaton and Lontoh 2010).
In addition to the BLT, some smaller compensation policies were also pro-
vided, including the following (Beaton and Lontoh 2010):
Health Insurance for the Poor (Asuransi Kesehatan Masyarakat Miskin, abbrevi-
ated as Askeskin)
School Operational Assistance (Bantuan Operational Sekolah, or BOS), a pro-
gram to eliminate fees in primary and junior secondary schools and provide
targeted scholarships for senior secondary school students
The Rural Infrastructure Program (Infrastruktur Perdesaan,or IP) to make direct
grants for low-income and remote villages to improve infrastructure and gen-
erate temporary employment
2008 Price Hikes and Reductions under Yudhoyono. The 2005 price increases
significantly reduced subsidy expenditure for only about a year. Rising world oil
prices drove expenditure upward again in 2007. By 2008, world spot prices had
risen even higher (in retrospect, we now know their peak),24
and the ballooning
subsidy budget was unsustainable.
The Yudhoyono government followed the model it had established in 2005.
In May 2008, subsidized gasoline prices were increased by 33 percent and diesel
by 28 percent. These hikes were combined with a package of compensation
measures, including two payments through the BLT unconditional cash transfer
system at a reported cost of US$1.52 billion (Beaton and Lontoh 2010), as well
as subsidized rice, loans for small businesses, and educational support for the
families of lower-ranking civil servants and the military.
Without the BLT, it was estimated that poverty would have been 1.5 percent-
age points higher than it was with the BLT in place, when actual poverty fell
from 15.4 percent in March 2008 to 14.2 percent in March 2009 (World Bank
2009, 2013a). Compared with 2005, no major public relations effort took place
in 2008, likely because of the relatively moderate price changes and the public
focus on nascent campaigning for upcoming parliamentary and presidential
elections.25
The government made announcements at the time about shifting toward a
new pricing system that would set fuel prices at market levels within fixed bands
rather than relying on one-off price adjustments that would become obsolete as
soon as world oil prices changed. However, it reversed the price increases toward
the end of 2008. At the start of December, subsidized gasoline prices were
27. 159
reduced by 9 percent. Two weeks later, the price of gasoline was reduced by a
further 10 percent and diesel by 15 percent. In addition, a third BLT payment
was arranged despite the price decreases (Beaton and Lontoh 2010).
The decision to decrease prices appeared to reflect two external factors: First,
world oil prices had begun to fall from their mid-2008 peak, removing the fiscal
pressure that was motivating reform. Second, presidential elections were to take
place in the first half of 2009.Yudhoyono won reelection, with political advertis-
ing in the run-up to elections arguing that the price reductions were an achieve-
ment of his presidency.
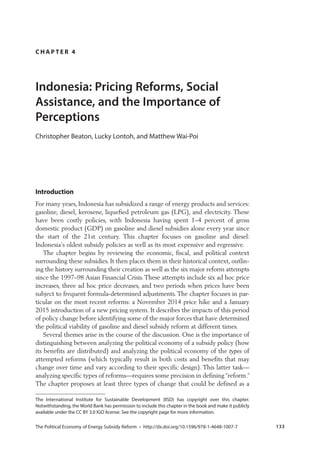
The BLT program emerged as an issue that contributed to Yudhoyono’s popu-
larity, with 84 percent of poll respondents approving of the program (O’Rourke
2009). It was viewed skeptically by opposition parties, who contended that it had
been used inappropriately to influence the elections (Adamrah 2009; Antara
News 2009; Kompas 2009; Sanjaya 2008; Wardany and Hajramurni 2009).
Although a complex array of factors can influence approval ratings, a review of
such polls for President Yudhoyono found that fuel price hikes were associated
with decreased popularity and cash transfers with increasing popularity, particu-
larly after being in place for some time (figure 4.12).
To fully understand the sensitivity of all political parties on this issue, remem-
ber that decades of systematic “depoliticization” had taken place during Suharto’s
presidency, limiting political activities for much of the recent past. Therefore, in
this political context, many citizens have weak institutional or ideological ties
with political parties; vote buying is a common practice; and many small parties,
with little funding, struggle to compete against a ruling party that can develop
programs with the state’s authority.
Despite the 2008 price increases, total fuel subsidy expenditure grew
significantly, from 2.1 percent of GDP in 2007 to 2.8 percent of GDP
Figure 4.12 Indonesian Approval Ratings of PresidentYudhoyono During Periods of Fuel Price
Hikes and CashTransfers, 2005–09
Dec
%ofrespondentsexpressingapproval
forPresidentYudhoyono
40
45
55
65
75
80
50
60
70
2005
Mar
Jun Sep Dec 2006
Mar
Jun Sep Dec 2007
Mar
Jun Sep Dec 2008
Mar
Jun Sep Dec 2009
Mar
2005 BLT cash transfer
program in place
2008 BLT cash transfer
program in place
Fuel price
hike
Fuel price
hike
Source: O’Rourke (2009) based on nationwide polls by Lembaga Survei Indonesia.
Note: BLT = Direct Cash Assistance.
28. 160
(as shown earlier in figure 4.10). Price increases therefore sufficed only to con-
tain growing expenditure, not to reduce it. In 2009, total fuel subsidy expendi-
ture fell dramatically, from 2.8 percent to only 0.8 percent of GDP. Given the
December 2008 price reductions (which would ordinarily have increased sub-
sidy expenditure), the fall in subsidy expenditure can be attributed almost
entirely to falling world oil prices and, to some extent, ongoing economic growth
rather than to government policy. By early 2010, the government had effectively
abandoned its plan to shift to a new pricing system (Beaton and Lontoh 2010).
2012 Attempted Price Increase. In early 2012, the government again began to
publicly consider raising gasoline prices, this time by around 33 percent. The
domestic fuel price had not changed since early 2009, while international crude
prices had increased from US$43.91 per barrel in January 2009 to US$106.89
per barrel in January 2012.26
After the 2009 crude price decline, resulting in a
relatively low fuel subsidy bill of Rp 45 trillion (0.8 percent of GDP), the subsidy
soared to Rp 165.6 trillion in 2011 (2.1 percent of GDP), as shown earlier in
figure 4.10.
This time, Yudhoyono faced different circumstances. Because of a prior bud-
getary agreement, fuel price increases required parliamentary approval as part of
the state budget revision instead of being solely at the president’s discretion.
Following a plenary and voting session that was televised live and lasted until the
early hours of the morning, parliament rejected the option of increasing prices,
instead agreeing only to allow the government to increase prices by Rp 1,500 per
liter if international crude oil prices rose by 15 percent above the US$105 stated
in the budget assumptions. If prices fell by 15 percent below budgetary assump-
tions,the government would be compelled to reduce domestic prices (Simorangkir
2012). Such a situation did not ultimately materialize.
Several factors worked against the attempted reform. First, the government
had changed tactics too quickly: Yudhoyono’s second-term electoral campaign
had overemphasized the benefits created by the 2009 price reductions, and his
administration had made announcements in late 2011 that prices would not
rise in 2012, instead emphasizing plans to restrict access to subsidized fuel and
promote fuel diversification (Indriyanto et al. 2013). Opposition parties could
cite Yudhoyono’s own campaign material to argue against his attempted policy
change.
Second, the proposal sparked significant public protests. The police reported
1,063 public demonstrations in March 2012 alone, 28 ending in street clashes
(Indriyanto et al. 2013). In addition, Dien Syamsudin, the leader of Muhammadiyah
(Indonesia’s second-largest Islamic mass organization), led a challenge in the
Constitutional Court against the initiative—probably in part because some mem-
bers of the ruling coalition were involved in high-profile corruption scandals
(Hafil 2012; Jakarta Post 2012a, 2012b; Mishkin 2012).
Third, and most important, Yudhoyono in 2012 seemed to display less
prowess in consolidating political support and communicating with the gen-
eral populace than he had during previous reforms. That parliament had
29. 161
established a requirement that it approve any reform was the most apparent
instance of this reduction in presidential power. But even within this frame-
work, some unexpected shifts in alliance took place. For example, days before
the parliamentary vote in late March, rumors had spread that the fuel price
increase plan had been initiated by the Golkar Party. Aburizal Bakrie, Golkar’s
chairman, immediately refuted the claim, and subsequently Golkar—one of
the five largest parties—ceased its support of the fuel price increase. There
was more political capital to be earned from opposing fuel subsidy reforms
than from supporting them.
On top of this, the government lacked an effective communications
strategy. An independent review of the government’s communication strategy,
based on interviews with officials, found that the government had conducted
a wide range of communications activities in 2012, including interactive
dialogues, cultural performances, public seminars, meetings with key interest
groups, print and television advertisements, and pamphlets and stickers
(Indriyanto et al. 2013). Despite this breadth of activities, the review could
not identify an underlying strategy: the communications appeared to have
been conducted with no clear objective beyond “awareness raising,” no sys-
tems for monitoring and evaluation, and no audience research that would
allow for audience segmentation and tailored messaging. An intergovernmen-
tal team established to coordinate communications activities had been effec-
tive in many cases, but it appeared to lose its efficacy in the case of senior
government officials, resulting in a lack of coordinated messaging at the min-
isterial level.
2013 Price Increase. By mid-2013, the Indonesian state budget was once again
under significant fiscal pressure: without more fuel subsidy reforms, the deficit
would have risen to 3.38 percent of GDP, above its legal limit of 3 percent of
GDP (GSI-IISD 2013b). In mid-June, fuel price hikes were announced, with
subsidized gasoline prices rising by around 45 percent and diesel by around
21 percent.
Again, the government provided a range of social compensation mechanisms.
The unconditional cash transfer previously known as BLT was renamed the
Temporary Cash Transfer Program (Bantuan Langsung Sementara Masyarakat, or
BLSM).This renaming was intended to help convey the temporary nature of the
policy, as it had been criticized in previous years for being short-term and not
seeking to promote a long-term exit strategy from poverty.The program was also
to be targeted using the new Unified Database (UDB), a targeting registry devel-
oped in 2012.
Other social assistance measures—rice subsidies; education subsidies; and an
expansion of the country’s conditional cash transfer program, the Hopeful
Family Program (Program Keluarga Harapan, or PKH)—were distributed
through a new social protection identification card, also targeted with the UDB.
In addition, a basic infrastructure program was announced, to focus on housing
and water infrastructure needs among poor communities.
30. 162
In total, the subsidy cuts were estimated to save around Rp 40 trillion
(0.4 percent of GDP), while the compensation package was reported to cost
around Rp 29.1 trillion (0.3 percent of GDP) (GSI-IISD 2013b; Teather 2013).
The government launched a mass communications effort in support of the
reforms, including television advertisements, text messages to 240 million active
mobile phone numbers, social media activity, and a guidebook to explain com-
pensation programs (GSI-IISD 2013b).
After the failed attempt to reform subsidies in 2012, the 2013 price hikes—
influenced largely by the need to reduce the budget deficit—took many by sur-
prise. Other drivers may have included the following:
Political cycles. Mid-2013 was likely the last time it would be possible to adjust
prices before legislative elections in early 2014 and presidential elections in
mid-2014.
Presidential term limits. That Yudhoyono was serving his second term and knew
he would be unable to stand again enabled the government to introduce what
would otherwise have been a risky policy change.
Reduced parliamentary power. More practically, the clause in the 2012 budget
that had required parliamentary approval for price reforms had not been car-
ried over to 2013. Nonetheless, parliamentary approval was required to enable
budgetary expenditure on allocation programs.
The impact of the reforms was to reduce fuel subsidy expenditure by a modest
degree, down from 2.5 percent of GDP in 2012 to 2.3 percent of GDP in 2013.
The response to the price hikes was, as in previous years, dominated by news
reports of public protests and violent clashes with police, including student and
labor groups (Cochrane 2013), though some reports indicated a muted response
compared with previous years (Einhorn and Ho 2013). Most of the criticism of
the social compensation measures focused on the BLSM unconditional cash
transfer program, inaccuracies in the register of eligible households, asynchronous
delivery of cash transfers to some areas, and particularly governance concerns
around providing cash transfers so close to upcoming elections (GSI-IISD 2013a;
Muryanto 2014).
The 2014–15 Reform of Gasoline and Diesel Subsidies
In November 2014 and January 2015, the government of Indonesia introduced
its most recent attempts at gasoline and diesel subsidy reform. The section here
reviews in more detail why and how these latest policy changes took place and
identifies some of their economic and social impacts. This complements the pre-
vious review of the history of gasoline and subsidy reforms by providing a more
in-depth review of experience in one recent period.
The 2014–15 Reforms
On November 17, 2014, Indonesia’s new government, led by President Joko
Widodo, hiked gasoline prices by around 31 percent and diesel by 36 percent
31. 163
(GSI-IISD 2015a). Only a month and a half later, on December 31, it announced
a second set of reforms:
Complete removal of gasoline subsidies in the Java-Madura-Bali area (central
Indonesia)
Removal of all gasoline subsidies in other areas of the country, except those
related to distribution costs
Introduction of a “fixed price” diesel subsidy that would set prices at Rp 1,000
(US$0.08) per liter below market prices
Under this new pricing system, the prices of gasoline and diesel were to be
adjusted every two weeks to one month, according to a published pricing for-
mula based an international market reference price. The immediate impact was
a 12 percent reduction in the price of gasoline and a 3 percent reduction in the
price of diesel because of the sudden, sharp declines in world oil prices since late
2014 (GSI-IISD 2015a).
Together, these policy changes amounted to one of the most significant periods
of reform in Indonesian fuel subsidy policy, taking prices to their highest nominal
levels and attempting to introduce the first structural reform to the underlying
pricing mechanism since 2003. What made this shift politically possible?
Lead-Up to the 2014–15 Reforms
Joko Widodo’s early signaling during the 2014 general election of his intention
to reform subsidies significantly increased the legitimacy of his government in
subsequently adjusting prices. Such messaging marked a dramatic departure
from previous elections, when references to energy pricing were generally dis-
couraged because of the issue’s controversy and divisiveness—even for Widodo’s
party, PDI-P, which had opposed subsidy reforms during most of Yudhoyono’s
administration.
In part, such campaign messaging reflected Widodo’s political style. As a poli-
tician from outside Indonesia’s traditional ruling elite—having advanced from
humble beginnings as a local furniture businessman—he developed a reputation
for taking principled stances on controversial issues. It also reflected his strong
popular support base (as evidenced by his decisive victories in mayoral elections
in Surakarta and Jakarta), which gave him a buffer against too much dependence
on traditional interest groups within his own party.
Being pro-reform was also a position that Widodo had tested publicly over the
previous year as governor of Jakarta, when he had announced to much press
attention that Jakarta would prefer to have fuel subsidies withdrawn and the
funding reallocated for the city to invest in mass urban transport. The stance of
his political campaign may also have been based on a perceived shift in public
opinion regarding subsidies, as reflected by the relatively muted protests against
price rises in 2013.
Being a political outsider may also have made Widodo more capable than his
peers in opposing special interest groups, which some media have speculated
32. 164
played a role in the previous government’s long-running inability to fully reform
the subsidy. Speculation has abounded for many years that an “oil and gas mafia”
has profited from slight discrepancies between the government’s subsidy pay-
ments and the size of the gap between the cost of fuel imports and domestic retail
prices (Asia Sentinel 2014; Saragih 2014a). It is possible that such leakage could
have been taking place because Indonesia’s subsidized fuel (88-octane gasoline)
is such a low-quality fuel that it is not commonly traded, and therefore no spot
price can be used to precisely verify that subsidy payments are the correct size.
Despite these claims—and the fact that illegal and rent-seeking behavior in
the energy sector certainly exists—no hard data have ever been produced to
prove clear corruption in the subsidy system linked to political elites.Nonetheless,
Widodo’s willingness to tackle such groups became unambiguously clear by his
launch of an oil and gas task force upon coming into office.27
With a mandate
to look into the broad set of governance issues in the sector, the team was popu-
larly dubbed the “energy mafia” task force (Cahyafitri and Widhiarto 2014;
Saragih 2014b).
In addition, public opinion may have become better disposed to fuel price
increases, having just experienced a fuel scarcity crisis as a result of postponing
reforms (Dipa and Fadli 2014; Gideon 2014; Sandi 2014)—a delay caused by the
Yudhoyono regime’s reluctance to increase fuel prices during an election year. In
the face of unsustainable subsidy costs, the civil service had been instructed
in August 2014 to constrain fuel subsidy expenditure by restricting the fuel
supply—causing panic buying and long queues that led to significant economic
disruption and social discontent.The measures were so unpopular that they were
reversed by the end of the same month (Lontoh, Beaton, and Clarke 2015).
Widodo also enjoyed the same honeymoon period that Yudhoyono had expe-
rienced in 2005, when the Megawati government, after many years of trying to
reform subsidies, had limited legitimacy in criticizing the new government.
Widodo skillfully exploited this period of goodwill by publicly reaching out to
Yudhoyono before the transfer of power and offering an arrangement to jointly
share responsibility for price increases between the two governments:Yudhoyono
would introduce one set of price hikes before leaving office, and Widodo would
complete them once inaugurated. Following an August 27 meeting in Bali, how-
ever, Yudhoyono rejected the proposal, diplomatically citing his empathy for the
poor and the lack of support he had received from the opposition when he took
office as his reasons (Jakarta Post 2014; Jong and Erviani 2014; Rahadiana and
Chatterjee 2014).
Finally, as in most instances of fuel subsidy reform in Indonesia, budgetary
necessity and world oil prices likely played significant roles—the former forcing
the government’s hand in November, and the latter opening a window of oppor-
tunity for structural reforms by the end of December.
Budgetary Issues. Budgetary pressure was strong in November 2014 because
the Yudhoyono-negotiated state budget left no space for higher-than-planned
expenditure on fuel subsidies. Because attempts to restrict the fuel supply had
33. 165
failed, Widodo’s government was on course for a budgetary crisis. In addition,
pushing back subsidy reform until 2015 did not seem to offer better pros-
pects. This budget had also been drawn up in negotiations led by the previous
administration, so it included a carry-over of subsidy debts from 2014 and,
as a “baseline budget,” was not structured to allow for mitigation measures
related to fuel subsidy reform. This would require an effort to reallocate
funds, which parliament could block if it opposed price increases (Antara
News 2014; EIU 2014; Sambijantoro and Parlina 2014; Sambijantoro and
Saragih 2014).
As a head of the government but leading a minority coalition in parlia-
ment, and given the likelihood of strong parliamentary opposition to price
reforms, it made sense for the Widodo administration to take bold, decisive
steps with whatever operating space was available. Widodo’s economic team
identified an unspent budgetary line in the 2014 budget worth Rp 5 trillion
(around US$0.5 billion), initially allocated for a social risk fund, and used
this to finance a social security program on November 3, introducing a new
card system to distribute education and health assistance and thereby pro-
vide some form of mitigation for the price hikes (Antara News 2014; GSI-
IISD 2015a).
World Oil Prices. By late December, however, world oil prices had continued
their unanticipated decline to lows not seen for many years. This left Widodo’s
adjusted November prices in an awkward position—actually above market levels.
Like some other fuel-subsidizing nations such as India, the government seized
the opportunity to announce subsidy reforms during the time of decreasing
prices, which by mid-January returned to nearly pre-November levels. This was
a politically popular move, but despite the benefits of changing the pricing sys-
tem at a structural level, it also put the government back in a position where
politically costly price hikes—hard-won in November—would likely be needed
again in the future.
2014 Compensation and 2015 Reallocation
On November 3, the government announced the launch of a social assistance
scheme titled the Productive Family Program (Program Keluarga Produktif),
which introduced four cards—the Indonesia Smart Card (Kartu Indonesia Pintar,
or KIP); the Indonesia Healthy Card (Kartu Indonesia Sehat, or KIS); the
Prosperous Family Saving Card (Kartu Simpanan Keluarga Sejahtera, or KSKS);
and a mobile phone SIM card used for checking an account status—all imple-
mented with a smart card technology called Digital Financial Service (Layanan
Keuangan Digital). These were largely renamed versions of existing programs,
albeit with improved information technology and in some cases slightly expanded
coverage.
Widodo had previously used card systems in 2008 as part of an effort to
improve the coverage of health and education assistance during his term as the
mayor of Surakarta (Abarwati 2014). Shortly after he took office as president,
34. 166
the combination of this information technology with social protection programs
became one of his highest-profile policies, providing the following benefits
(GSI-IISD 2015a; TNP2K, n.d.):
KIP provided payments targeting 152,364 students of ages 7–18 years from
elementary to high school.
KIS expanded the coverage of existing health care insurance from 86.4 million
to 88.1 million targeted recipients, with the inclusion of near-poor households
and a first payment targeting 432,000 recipients.
KSKS cards were distributed to 1 million people and provide a monthly digital
cash transfer of Rp 200,000 (around US$16),paid as Rp 400,000 for November
and December.
Upon launch, the government announced that cards would be distributed to
1 million families, with a further 14.5 million families to receive cards in 2015
(Jakarta Post 2014). This meant, however, that the large majority still received
cash transfers through post offices.
After the government’s second stage of reforms on December 31, no addi-
tional mitigation measures were announced, reflecting the decreased prices and
the expectation of no negative social impacts. Instead, the Widodo government
focused on refining and distributing its social security card program—so that
future reforms could be better targeted to the poor—and engaging in parliamen-
tary negotiations over how fuel subsidy savings should be reallocated.28
No clear record is available to show exactly how the government used savings
from the reforms because Indonesia has no formal system to track reallocation of
funds in its budget-making processes. However, the government made numerous
public commitments to reinvest the savings in infrastructure; indeed, the Revised
State Budget 2015 increased the infrastructure allocation from US$15.2 billion to
US$23.2 billion.This increase may have reflected previous criticisms of the BLT and
the BLSM policies,which had been decried as wasteful for supporting blanket short-
term consumption rather than making strategic investments that would improve
households’ longer-term capacity and opportunities (World Bank 2012a, 2012b).
Public Response to the Policy Changes
The first reforms in November 2014, which increased gasoline and diesel prices,
were met as usual with panic buying (with fuel sales increasing to more than
twice their daily average in some areas) and sporadic protests across the country,
although it was generally believed that such opposition was less fierce than in
previous years (GSI-IISD 2015a). Two student unions—typically in opposition
to reform—came out in support of the government’s policy, and one of the larg-
est demonstrations, in Makassar, came to a surprising end when locals reportedly
fought off the demonstrators, being tired of the prolonged obstruction of roads
with rocks and burning tires (GSI-IISD 2015a).
Among workers,the most significant opposition came from the Indonesian Land
Transport Operators Association (Organda), which staged a one-day nationwide
35. 167
strike that left crowds of passengers unable to reach their destinations (GSI-IISD
2015a). The strike was incited by a Ministry of Transportation restriction that pre-
vented operators from increasing their fares for the first three months after the
introduction of new fuel price—essentially forcing transport operators to absorb
the immediate burden of higher prices. The ministry quickly called a negotiation
and resolved the crisis by agreeing to let operators raise their fares by 10 percent.
The second reforms—the new pricing system and decrease of gasoline and
diesel prices in late December—were met with little public outcry. This is no
surprise as price decreases are generally greeted favorably by citizens and
could not be decried by opposition parties so soon after their criticism of price
hikes only a month and a half before. The one exception focused on concerns
around “price stickiness,” whereby fuel price reductions did not appear to
reduce the cost of living as quickly as the price hikes had increased the cost of
living (GSI-IISD 2015a).
Implementing the New Pricing Regime: An Uncertain Future
The history of attempted reforms in Indonesia provides strong reason for caution
in assuming that the country’s entanglement with fuel subsidies is over. The
reform of a consumer product subsidy is not achieved by announcing its removal
but by the consistent application of the nonsubsidized pricing regime that takes
its place. This, in turn, may depend upon addressing the structural factors that
gave rise to the subsidies in the first place.
The early days of Indonesia’s new pricing system indicate that the future is
uncertain. The immediate impact of implementing subsidy removal in January
2015 was to reduce prices—with further reductions in mid-January taking gasoline
prices close to their pre-November levels.The new pricing system was intended to
result in price changes every two weeks to one month, but since the end of January
2015 it has in effect developed into a new ad hoc pricing system.
The rest of 2015 proceeded as follows (GSI-IISD 2015a, 2015b), with the
specific gasoline price changes shown in table 4.2:
February: No price changes were made.
March: Two price increases were made, but these resulted in protests at the
same time that the minority coalition government was facing challenges in
other areas.
April: The government announced that it was planning for longer intervals
between price adjustments.
Table 4.2 Gasoline Prices in Indonesia (Java, Madura, Bali Areas), 2014–15
rupiah per liter
Fuel type Prereform Nov 18, 2014 Jan 1, 2015 Jan 19, 2015 Mar 1, 2015 Mar 28, 2015
Gasoline
Diesel
Sources: GSI-IISD 2015b, 2015d.
Note: Gasoline prices refer to 88-octane gasoline.
36. 168
May: By the end of the month, the government confirmed that adjustments
would take place every three months.
June: By June 1, the government had announced that no price changes would
take place going into Ramadan.
September: As of September 1, no new price adjustments had taken place.
October: The government announced a new set of fuel price decreases, alongside
a range of other measures to stimulate the economy.The price cuts did not apply
to the previously subsidized Premium-brand 88-octane gasoline, but they did
apply to Solar-brand diesel (still theoretically subsidized at Rp 1,000 below mar-
ket prices) and a range of fuels whose prices had not been controlled: aviation
fuel (Avtur) and two higher-quality brands of gasoline (Pertalite and Pertamax).
During the course of the year, parliament also began discussing the creation of
a “petroleum fund” to smooth prices (by taxing fuels when world prices are low
and subsidizing prices when world prices are high), thereby creating price cer-
tainty without undue subsidization. Although sound in theory, a significant body
of analysis shows that in practice such mechanisms tend to result in a return to
large-scale subsidization (Kojima 2013).
Throughout 2015, the international oil price continued to fluctuate despite
largely static domestic prices. Already in March, state oil company Pertamina
announced that the government’s retail prices were Rp 200–750 per liter
below the price that should have been determined by the official pricing formula
(GSI-IISD 2015b). As of September, the Ministry of Energy and Mineral
Resources reported that Pertamina had incurred cumulative associated losses of
Rp 6.7 trillion (US$0.5 billion) in September (table 4.3). These losses are low in
Table 4.3 Comparison of Pump and Actual Prices of 88-Octane Gasoline in Indonesia, 2015
Date
Politically
determined (pump)
price (Rp per liter)
Estimated market
pricea
(Rp per liter)
Price gap (Rp per
liter)
Total losses to
Pertamina (Rp,
billions)
Total n.a. n.a. n.a.
Source: ESDM 2015.
Note: n.a. = not applicable. Rp = rupiah. Pertamina is the state-owned oil company.
a. The“estimated market price”is the estimated cost of bringing fuel all the way to retail, including the international price,
import costs, distribution costs, and a small profit margin for the retailer.
37. 169
historical terms, but this is a function of world oil prices. The risk for Indonesia’s
pricing system will be whether the political will exists to carry through price
increases once world prices increase once again—and having lowered prices for
previously unsubsidized fuels is a dangerous precedent in this respect.
Impact of the 2014–15 Reforms
Fiscal Impact
Indonesia’s 2014–15 reforms have benefited the country’s fiscal situation more
than most historical reforms, which have typically kept subsidy expenditure
stable in the face of rising world oil prices. Electricity subsidies are still large
(budgeted at around 0.6 percent of GDP in 2015), and the country’s budget for
fuel subsidies still includes a line of expenditure that is linked to some remaining
policies—LPG subsidies, kerosene subsidies, gasoline distribution costs outside
the Java-Madura-Bali area, and the remaining diesel subsidy of Rp 1,000 per liter
(budgeted at around 0.7 percent of GDP in 2015). However, the total com-
bined outlay on energy subsidies has fallen from 3.5 percent of GDP in 2014 to
1.3 percent of GDP in 2015 (figure 4.13).
The total savings associated with the fuel subsidy reforms have been reported
at around Rp 195 trillion (US$15.6 billion, or 1.6 percent of GDP) (Lontoh,
Beaton, and Clarke 2015). The improved fiscal position was generally seen to
have increased investor confidence, with the exchange rate strengthening
against major currencies and the stock exchange rising in the days after the
Figure 4.13 Government Expenditure on Energy Subsidies in Indonesia, 2007–15a
0
0.5
1.0
1.5
2.0
2.5
3.0
3.5
4.0
4.5
5.0
0
50,000
100,000
150,000
200,000
250,000
300,000
350,000
400,000
2007 2008 2009 2010 2011 2012 2013 2014a
2015a
Rupiah,billions
ShareofGDP,percent
Fuel subsidy (Rp, billions)Electricity subsidy (Rp, billions)Total energy subsidies (% of GDP)
Source: Lontoh, Beaton, and Clarke 2015.
Note: Rp = rupiah.
a. 2014 and 2015 figures based on the revised state budget, not final audited totals.
38. 170
announcement (Casier and Beaton 2015). Standard & Poor’s improved
Indonesia’s BB+ credit rating from “stable” to “positive”—citing, among other
reasons, the improved quality, effectiveness, and predictability of government
expenditure (GSI-IISD 2015b).
Inflationary Impact
Fuel price increases generally raise concerns about inflationary impacts.Although
reforms usually create only a short-term inflationary effect, large, one-off price
increases can have significant impacts that burden low-income households by
increasing the cost of living.
The role of inflation in the recent Indonesian reforms is notable, as reflected
in the difference in inflationary response between initial price increases in
November 2014 and the subsequent price decreases in January 2015. The infla-
tionary response to price hikes in mid-November 2014 accounted for almost
half the country’s annual inflation for 2014 (figure 4.14). By contrast, only a
moderate period of deflation in January and February 2015 followed the price
decreases.
This “price stickiness” became a basis for criticizing the government’s having
entrusted pricing to market forces (Casier and Beaton 2015). It is not possible to
assess the possible inflationary impacts of ongoing price volatility because of the
lack of price changes after March 2015, although upward price adjustments in
March were not associated with any significant increase in inflation beyond the
usual trend associated with Ramadan.
Figure 4.14 Inflation and Consumer Price Index in Indonesia, January 2014 to May 2015
106
108
110
112
114
116
118
120
122
–1.0
–0.5
0
0.5
1.0
1.5
2.0
2.5
3.0
Jan
2014Feb
2014M
ar2014Apr2014M
ay2014Jun
2014
Jul2014Aug
2014Sep
2014Oct2014Nov2014Dec2014Jan
2015Feb
2015M
ar2015Apr2015M
ay2015
CPI(2012=100)
Inflationrate,percent
Inflation (monthly, percent) Consumer Price Index (CPI)
Source: GSI-IISD 2015b.
Note: CPI = Consumer price index. The CPI base year is 2012.
39. 171
Distributional Impact
Data do not yet exist that would allow for a distributional analysis of Indonesia’s
reforms in 2014 and 2015, but much can be inferred from the previous decade
of subsidy reform, when significant changes occurred in the pattern of gasoline
and diesel expenditures across the distribution of Indonesian household
consumption.
Gasoline consumption grew fastest among richer households, both in absolute
terms and as a percentage of total consumption (figures 4.15 and 4.16). The
opposite was true for diesel, where surging demand for generator fuel among
poorer households drove higher diesel demand. However, with gasoline con-
sumption far exceeding diesel consumption, aggregate fuel consumption grew
faster among richer households (table 4.4).
These consumption patterns determine the extent to which different house-
holds benefited from fuel subsidies. In 2004, the poorest half of Indonesians
received only a quarter of all subsidy spending on gasoline and diesel; by 2014,
this share had fallen to one-fifth (figure 4.17). Conversely, the share of subsidies
enjoyed by the richest quintile increased over this period from 44 percent to
50 percent.
Figure 4.15 Gasoline and Diesel Consumption in Indonesia, by Household Consumption Decile,
2004 and 2014
GasolineDiesel
0
0.5
1.0
1.5
2.0
2.5
3.0
3.5
D1-2004
D1-2014
D2-2004
D2-2014
D3-2004
D3-2014
D4-2004
D4-2014
D5-2004
D5-2014
D6-2004
D6-2014
D7-2004
D7-2014
D8-2004
D8-2014
D9-2004
D9-2014
D10-2004
D10-2014
Rupiah,trillions
Sources: National Socioeconomic Survey (SUSENAS) of the Central Statistics Agency (Badan Pusat Statistik, BPS), http://microdata.bps.go.id/mikrodata
/index.php/catalog/SUSENAS;World Bank calculations.
Note: D = decile of household per capita consumption (1 = poorest, 10 = richest). Household per capita consumption deciles are after spatial
adjustments for purchasing power. All fuel consumptions are expressed in nominal rupiah, both spatially and temporally.
40. 172
Despite the skewed and increasing share of subsidies going to richer house-
holds, the value of energy subsidies is actually greater for poorer households than
richer households as a percentage of their income before taxes and transfers (also
known as “market income”). That is, although poor and vulnerable households
benefited relatively little in absolute subsidy terms, the small benefits they gained
meant proportionally slightly more to them than to rich households because the
subsidies represented a higher percentage of their incomes (figure 4.18). As a
consequence, subsidies have had little impact on inequality (Indonesia MoF and
World Bank 2015).
Figure 4.16 Gasoline and Diesel Consumption as a Share ofTotal Consumption
in Indonesia, by Household Consumption Decile, 2004 and 2014
0
1
2
3
4
5
6
1 2 3 4 5 6 7 8 9 10
Shareoftotalconsumption,percent
Household per capita consumption decile
20042014
Sources: National Socioeconomic Survey (SUSENAS) of the Central Statistics Agency (Badan Pusat Statistik,
BPS), http://microdata.bps.go.id/mikrodata/index.php/catalog/SUSENAS; World Bank calculations.
Note: Household per capita consumption deciles (1 = poorest, 10 = richest) are after spatial adjustments for
purchasing power.
Table 4.4 Compound Annual Growth Rate (Nominal) of Household Expenditure on Fuel Consumption in
Indonesia, by Decile, 2004–14
Percent
Fuel type D1 D2 D3 D4 D5 D6 D7 D8 D9 D10
Gasoline
Diesel 32
Total
Sources: National Socioeconomic Survey (SUSENAS) of the Central Statistics Agency (Badan Pusat Statistik, BPS), http://microdata.bps.go.id/mikrodata
/index.php/catalog/SUSENAS;World Bank calculations.
Note: D = decile of household per capita consumption (1 = poorest, 10 = richest). Household per capita consumption deciles are after spatial
adjustments for purchasing power. Percentages of fuel consumption growth are calculated on the basis of expenditure on fuel in nominal rupiah,
both spatially and temporally.