SlideShare ist ein Scribd-Unternehmen logo
1 von 15
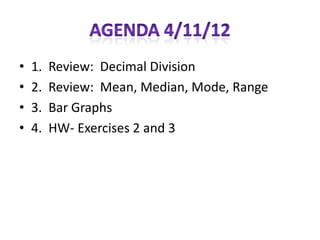
•   1.   Review: Decimal Division
•   2.   Review: Mean, Median, Mode, Range
•   3.   Bar Graphs
•   4.   HW- Exercises 2 and 3
Dividing Decimals
• If the divisor is
  not a whole
  number, move         3.8) 1614.62
  decimal point to
  right to make it a
  whole number
• Move decimal         38)16146.2
  point in dividend
  the same number
  of places.
Dividing Decimals
• Divide as usual.            42 4 9
  Keep dividing
  until the answer
                        38) 16146.2
  terminates or a           152
  repeating pattern           94
  shows up.                   76
•Position the decimal         186
point in the quotient         152
directly above the             34 2
decimal point in the           342
dividend.                         0
• 1. Find the mean of the following test scores:
• 88% 22% 90% 82% 95%
• The mean is 75.4%

• 2. Find the median of the test scores.
• 22% 82% 88% 90% 95%
• The median is 88%

• 3. Why do the mean and median differ so greatly?
• The mean and median differ because of the low test
  score of 22%.
• Complete the Bowling with the Pros and
  Hockey Stats with your table.
• On March 31, in San Diego, a meteorologist reported
  60° F as the high temperature for the day for the first
  time during March. The meteorologist also reported
  60°F as the median high temperature for San Diego
  for the month. On how many March days in San
  Diego was the high temperature lower than 60°F?


                              60

 These values are below 60°        These values are above 60°


                              1 day
          15 days                             15 days
• Tim collected data on his height (to the nearest inch) and
   that of four of his friends, but he lost the data. Time was
   the tallest, measuring 72 inches. Also, no two friends had
   the same height. Tim had calculated the following
   measures: median= 68, mean = 68, range= 7. Figure out
   what the original data was.


        Tim’s Data     1.   How many values do we need to find?
Mean         68        2.   How many do we know?
Median       68        3.   What does the range tell us?
Range        7         4.   What does the median tell us?
                       5.   What does the mean tell us?
                       6.   What else do we know about the data?
• Tim collected data on his height (to the nearest inch) and
       that of four of his friends, but he lost the data. Time was
       the tallest, measuring 72 inches. Also, no two friends had
       the same height. Tim had calculated the following
       measures: median= 68, mean = 68, range= 7. Figure out
       what the original data was.


1.   How many values do we need to find? 5
2.   How many do we know? 2
3.   What does the range tell us? The range tells us the value of the shortest height.
4.   What does the median tell us?The median tells us the EXACT middle height.
5.   What does the mean tell us? The number AFTER all heights have been added and divided.
6.   What else do we know about the data? There is no mode.
• Tim collected data on his height (to the nearest inch) and
   that of four of his friends, but he lost the data. Time was
   the tallest, measuring 72 inches. Also, no two friends had
   the same height. Tim had calculated the following
   measures: median= 68, mean = 68, range= 7. Figure out
   what the original data was.


        Tim’s Data     1.   How many values do we need to find?
Mean         68        2.   How many do we know?
Median       68        3.   What does the range tell us?
Range        7         4.   What does the median tell us?
                       5.   What does the mean tell us?
                       6.   What else do we know about the data?
• Data can be                           Month       Temp (°F)

  displayed on a                   January         13
                                   April           35
  graph.                           July            58
• A graph gives a                  October         35
  picture of the data.
                               Average Monthy Temp in
                                    Anchorage, AK
• A bar graph is used    80
                         60
  for visual             40
  comparisons.           20
                          0
                              January      April    July   October
Title

      Average Monthy Temp in
           Anchorage, AK
80
60
40
20
 0                                              Horizontal Axis
     January   April   July   October             (items being
                                                   compared)

                 Vertical Axis
                     (numbers
                   representing
                  temperatures)
Average Monthly Temperatures in       What is the average
             Los Angeles, CA               temperature in Los
80
                                           Angeles in April?
70
60
50
40
30
                                           The average
20                                         temperature
10
0
                                           is 60° for the
     January   April     July    October   month of
                                           April.
Average Monthly Temperatures in       In what month is
             Los Angeles, CA               the average
80
                                           temperature in Los
70
60
                                           Angeles 69°?
50
40                                         Since there isn’t
30
                                           a 69° on the
20
10
                                           vertical axis, you
0                                          must choose the
     January   April     July    October   one which is
                                           closest to 70°
Average Monthly Temperatures in       What is the range of
             Los Angeles, CA               average monthly
80                                         temperatures in Los
70
                                           Angeles?
60
50
40                                         Find the highest
30
                                           temperature and
20
10
                                           subtract the
0                                          lowest
     January   April     July    October   temperature
                                           from it.
• Exercise 2- Answer the questions based on the
  information presented in both of the bar
  graphs.

• Exercise 3- Drawing Bar Graphs

Weitere ähnliche Inhalte

Mehr von Clark College ABE/GED Math (9)

8:00 GED Math THUR 4/26
8:00 GED Math THUR 4/268:00 GED Math THUR 4/26
8:00 GED Math THUR 4/26
 
11:00 ABE Math WED 4/25
11:00 ABE Math WED 4/2511:00 ABE Math WED 4/25
11:00 ABE Math WED 4/25
 
8:00 Tuesday 4/24 GED Math
8:00 Tuesday 4/24 GED Math8:00 Tuesday 4/24 GED Math
8:00 Tuesday 4/24 GED Math
 
11:00 Tuesday 4/24 ABE Math
11:00 Tuesday 4/24 ABE Math11:00 Tuesday 4/24 ABE Math
11:00 Tuesday 4/24 ABE Math
 
11:00 ABE Math 4/19
11:00 ABE Math 4/1911:00 ABE Math 4/19
11:00 ABE Math 4/19
 
11:00 ABE Math 4/18
11:00 ABE Math 4/1811:00 ABE Math 4/18
11:00 ABE Math 4/18
 
8:00 GED Math 4/19
8:00 GED Math 4/198:00 GED Math 4/19
8:00 GED Math 4/19
 
8:00 GED Math Week 2 Monday
8:00 GED Math Week 2 Monday8:00 GED Math Week 2 Monday
8:00 GED Math Week 2 Monday
 
8:00 GED Math Week 1 Tue
8:00 GED Math Week 1 Tue8:00 GED Math Week 1 Tue
8:00 GED Math Week 1 Tue
 

Kürzlich hochgeladen

Presentation by Andreas Schleicher Tackling the School Absenteeism Crisis 30 ...
Presentation by Andreas Schleicher Tackling the School Absenteeism Crisis 30 ...Presentation by Andreas Schleicher Tackling the School Absenteeism Crisis 30 ...
Presentation by Andreas Schleicher Tackling the School Absenteeism Crisis 30 ...EduSkills OECD
 
Separation of Lanthanides/ Lanthanides and Actinides
Separation of Lanthanides/ Lanthanides and ActinidesSeparation of Lanthanides/ Lanthanides and Actinides
Separation of Lanthanides/ Lanthanides and ActinidesFatimaKhan178732
 
CARE OF CHILD IN INCUBATOR..........pptx
CARE OF CHILD IN INCUBATOR..........pptxCARE OF CHILD IN INCUBATOR..........pptx
CARE OF CHILD IN INCUBATOR..........pptxGaneshChakor2
 
Contemporary philippine arts from the regions_PPT_Module_12 [Autosaved] (1).pptx
Contemporary philippine arts from the regions_PPT_Module_12 [Autosaved] (1).pptxContemporary philippine arts from the regions_PPT_Module_12 [Autosaved] (1).pptx
Contemporary philippine arts from the regions_PPT_Module_12 [Autosaved] (1).pptxRoyAbrique
 
Introduction to ArtificiaI Intelligence in Higher Education
Introduction to ArtificiaI Intelligence in Higher EducationIntroduction to ArtificiaI Intelligence in Higher Education
Introduction to ArtificiaI Intelligence in Higher Educationpboyjonauth
 
PSYCHIATRIC History collection FORMAT.pptx
PSYCHIATRIC   History collection FORMAT.pptxPSYCHIATRIC   History collection FORMAT.pptx
PSYCHIATRIC History collection FORMAT.pptxPoojaSen20
 
Measures of Central Tendency: Mean, Median and Mode
Measures of Central Tendency: Mean, Median and ModeMeasures of Central Tendency: Mean, Median and Mode
Measures of Central Tendency: Mean, Median and ModeThiyagu K
 
Paris 2024 Olympic Geographies - an activity
Paris 2024 Olympic Geographies - an activityParis 2024 Olympic Geographies - an activity
Paris 2024 Olympic Geographies - an activityGeoBlogs
 
How to Make a Pirate ship Primary Education.pptx
How to Make a Pirate ship Primary Education.pptxHow to Make a Pirate ship Primary Education.pptx
How to Make a Pirate ship Primary Education.pptxmanuelaromero2013
 
Alper Gobel In Media Res Media Component
Alper Gobel In Media Res Media ComponentAlper Gobel In Media Res Media Component
Alper Gobel In Media Res Media ComponentInMediaRes1
 
Micromeritics - Fundamental and Derived Properties of Powders
Micromeritics - Fundamental and Derived Properties of PowdersMicromeritics - Fundamental and Derived Properties of Powders
Micromeritics - Fundamental and Derived Properties of PowdersChitralekhaTherkar
 
Crayon Activity Handout For the Crayon A
Crayon Activity Handout For the Crayon ACrayon Activity Handout For the Crayon A
Crayon Activity Handout For the Crayon AUnboundStockton
 
Accessible design: Minimum effort, maximum impact
Accessible design: Minimum effort, maximum impactAccessible design: Minimum effort, maximum impact
Accessible design: Minimum effort, maximum impactdawncurless
 
The basics of sentences session 2pptx copy.pptx
The basics of sentences session 2pptx copy.pptxThe basics of sentences session 2pptx copy.pptx
The basics of sentences session 2pptx copy.pptxheathfieldcps1
 
Mastering the Unannounced Regulatory Inspection
Mastering the Unannounced Regulatory InspectionMastering the Unannounced Regulatory Inspection
Mastering the Unannounced Regulatory InspectionSafetyChain Software
 
Kisan Call Centre - To harness potential of ICT in Agriculture by answer farm...
Kisan Call Centre - To harness potential of ICT in Agriculture by answer farm...Kisan Call Centre - To harness potential of ICT in Agriculture by answer farm...
Kisan Call Centre - To harness potential of ICT in Agriculture by answer farm...Krashi Coaching
 
Software Engineering Methodologies (overview)
Software Engineering Methodologies (overview)Software Engineering Methodologies (overview)
Software Engineering Methodologies (overview)eniolaolutunde
 
Organic Name Reactions for the students and aspirants of Chemistry12th.pptx
Organic Name Reactions  for the students and aspirants of Chemistry12th.pptxOrganic Name Reactions  for the students and aspirants of Chemistry12th.pptx
Organic Name Reactions for the students and aspirants of Chemistry12th.pptxVS Mahajan Coaching Centre
 

Kürzlich hochgeladen (20)

Presentation by Andreas Schleicher Tackling the School Absenteeism Crisis 30 ...
Presentation by Andreas Schleicher Tackling the School Absenteeism Crisis 30 ...Presentation by Andreas Schleicher Tackling the School Absenteeism Crisis 30 ...
Presentation by Andreas Schleicher Tackling the School Absenteeism Crisis 30 ...
 
Separation of Lanthanides/ Lanthanides and Actinides
Separation of Lanthanides/ Lanthanides and ActinidesSeparation of Lanthanides/ Lanthanides and Actinides
Separation of Lanthanides/ Lanthanides and Actinides
 
CARE OF CHILD IN INCUBATOR..........pptx
CARE OF CHILD IN INCUBATOR..........pptxCARE OF CHILD IN INCUBATOR..........pptx
CARE OF CHILD IN INCUBATOR..........pptx
 
Contemporary philippine arts from the regions_PPT_Module_12 [Autosaved] (1).pptx
Contemporary philippine arts from the regions_PPT_Module_12 [Autosaved] (1).pptxContemporary philippine arts from the regions_PPT_Module_12 [Autosaved] (1).pptx
Contemporary philippine arts from the regions_PPT_Module_12 [Autosaved] (1).pptx
 
Introduction to ArtificiaI Intelligence in Higher Education
Introduction to ArtificiaI Intelligence in Higher EducationIntroduction to ArtificiaI Intelligence in Higher Education
Introduction to ArtificiaI Intelligence in Higher Education
 
Staff of Color (SOC) Retention Efforts DDSD
Staff of Color (SOC) Retention Efforts DDSDStaff of Color (SOC) Retention Efforts DDSD
Staff of Color (SOC) Retention Efforts DDSD
 
PSYCHIATRIC History collection FORMAT.pptx
PSYCHIATRIC   History collection FORMAT.pptxPSYCHIATRIC   History collection FORMAT.pptx
PSYCHIATRIC History collection FORMAT.pptx
 
Measures of Central Tendency: Mean, Median and Mode
Measures of Central Tendency: Mean, Median and ModeMeasures of Central Tendency: Mean, Median and Mode
Measures of Central Tendency: Mean, Median and Mode
 
Paris 2024 Olympic Geographies - an activity
Paris 2024 Olympic Geographies - an activityParis 2024 Olympic Geographies - an activity
Paris 2024 Olympic Geographies - an activity
 
How to Make a Pirate ship Primary Education.pptx
How to Make a Pirate ship Primary Education.pptxHow to Make a Pirate ship Primary Education.pptx
How to Make a Pirate ship Primary Education.pptx
 
Alper Gobel In Media Res Media Component
Alper Gobel In Media Res Media ComponentAlper Gobel In Media Res Media Component
Alper Gobel In Media Res Media Component
 
Micromeritics - Fundamental and Derived Properties of Powders
Micromeritics - Fundamental and Derived Properties of PowdersMicromeritics - Fundamental and Derived Properties of Powders
Micromeritics - Fundamental and Derived Properties of Powders
 
Crayon Activity Handout For the Crayon A
Crayon Activity Handout For the Crayon ACrayon Activity Handout For the Crayon A
Crayon Activity Handout For the Crayon A
 
Accessible design: Minimum effort, maximum impact
Accessible design: Minimum effort, maximum impactAccessible design: Minimum effort, maximum impact
Accessible design: Minimum effort, maximum impact
 
The basics of sentences session 2pptx copy.pptx
The basics of sentences session 2pptx copy.pptxThe basics of sentences session 2pptx copy.pptx
The basics of sentences session 2pptx copy.pptx
 
TataKelola dan KamSiber Kecerdasan Buatan v022.pdf
TataKelola dan KamSiber Kecerdasan Buatan v022.pdfTataKelola dan KamSiber Kecerdasan Buatan v022.pdf
TataKelola dan KamSiber Kecerdasan Buatan v022.pdf
 
Mastering the Unannounced Regulatory Inspection
Mastering the Unannounced Regulatory InspectionMastering the Unannounced Regulatory Inspection
Mastering the Unannounced Regulatory Inspection
 
Kisan Call Centre - To harness potential of ICT in Agriculture by answer farm...
Kisan Call Centre - To harness potential of ICT in Agriculture by answer farm...Kisan Call Centre - To harness potential of ICT in Agriculture by answer farm...
Kisan Call Centre - To harness potential of ICT in Agriculture by answer farm...
 
Software Engineering Methodologies (overview)
Software Engineering Methodologies (overview)Software Engineering Methodologies (overview)
Software Engineering Methodologies (overview)
 
Organic Name Reactions for the students and aspirants of Chemistry12th.pptx
Organic Name Reactions  for the students and aspirants of Chemistry12th.pptxOrganic Name Reactions  for the students and aspirants of Chemistry12th.pptx
Organic Name Reactions for the students and aspirants of Chemistry12th.pptx
 

11:00 Week 1 Wednesday Data

  • 1. 1. Review: Decimal Division • 2. Review: Mean, Median, Mode, Range • 3. Bar Graphs • 4. HW- Exercises 2 and 3
  • 2. Dividing Decimals • If the divisor is not a whole number, move 3.8) 1614.62 decimal point to right to make it a whole number • Move decimal 38)16146.2 point in dividend the same number of places.
  • 3. Dividing Decimals • Divide as usual. 42 4 9 Keep dividing until the answer 38) 16146.2 terminates or a 152 repeating pattern 94 shows up. 76 •Position the decimal 186 point in the quotient 152 directly above the 34 2 decimal point in the 342 dividend. 0
  • 4. • 1. Find the mean of the following test scores: • 88% 22% 90% 82% 95% • The mean is 75.4% • 2. Find the median of the test scores. • 22% 82% 88% 90% 95% • The median is 88% • 3. Why do the mean and median differ so greatly? • The mean and median differ because of the low test score of 22%.
  • 5. • Complete the Bowling with the Pros and Hockey Stats with your table.
  • 6. • On March 31, in San Diego, a meteorologist reported 60° F as the high temperature for the day for the first time during March. The meteorologist also reported 60°F as the median high temperature for San Diego for the month. On how many March days in San Diego was the high temperature lower than 60°F? 60 These values are below 60° These values are above 60° 1 day 15 days 15 days
  • 7. • Tim collected data on his height (to the nearest inch) and that of four of his friends, but he lost the data. Time was the tallest, measuring 72 inches. Also, no two friends had the same height. Tim had calculated the following measures: median= 68, mean = 68, range= 7. Figure out what the original data was. Tim’s Data 1. How many values do we need to find? Mean 68 2. How many do we know? Median 68 3. What does the range tell us? Range 7 4. What does the median tell us? 5. What does the mean tell us? 6. What else do we know about the data?
  • 8. • Tim collected data on his height (to the nearest inch) and that of four of his friends, but he lost the data. Time was the tallest, measuring 72 inches. Also, no two friends had the same height. Tim had calculated the following measures: median= 68, mean = 68, range= 7. Figure out what the original data was. 1. How many values do we need to find? 5 2. How many do we know? 2 3. What does the range tell us? The range tells us the value of the shortest height. 4. What does the median tell us?The median tells us the EXACT middle height. 5. What does the mean tell us? The number AFTER all heights have been added and divided. 6. What else do we know about the data? There is no mode.
  • 9. • Tim collected data on his height (to the nearest inch) and that of four of his friends, but he lost the data. Time was the tallest, measuring 72 inches. Also, no two friends had the same height. Tim had calculated the following measures: median= 68, mean = 68, range= 7. Figure out what the original data was. Tim’s Data 1. How many values do we need to find? Mean 68 2. How many do we know? Median 68 3. What does the range tell us? Range 7 4. What does the median tell us? 5. What does the mean tell us? 6. What else do we know about the data?
  • 10. • Data can be Month Temp (°F) displayed on a January 13 April 35 graph. July 58 • A graph gives a October 35 picture of the data. Average Monthy Temp in Anchorage, AK • A bar graph is used 80 60 for visual 40 comparisons. 20 0 January April July October
  • 11. Title Average Monthy Temp in Anchorage, AK 80 60 40 20 0 Horizontal Axis January April July October (items being compared) Vertical Axis (numbers representing temperatures)
  • 12. Average Monthly Temperatures in What is the average Los Angeles, CA temperature in Los 80 Angeles in April? 70 60 50 40 30 The average 20 temperature 10 0 is 60° for the January April July October month of April.
  • 13. Average Monthly Temperatures in In what month is Los Angeles, CA the average 80 temperature in Los 70 60 Angeles 69°? 50 40 Since there isn’t 30 a 69° on the 20 10 vertical axis, you 0 must choose the January April July October one which is closest to 70°
  • 14. Average Monthly Temperatures in What is the range of Los Angeles, CA average monthly 80 temperatures in Los 70 Angeles? 60 50 40 Find the highest 30 temperature and 20 10 subtract the 0 lowest January April July October temperature from it.
  • 15. • Exercise 2- Answer the questions based on the information presented in both of the bar graphs. • Exercise 3- Drawing Bar Graphs