SlideShare ist ein Scribd-Unternehmen logo
1 von 25
Downloaden Sie, um offline zu lesen
3.1 - 1
Example 14: Auto Sales
Find the variance and standard deviation for the
amount of European auto sales for a sample of 6
years. The data are in millions of dollars.
11.2, 11.9, 12.0, 12.8, 13.4, 14.3
3.1 - 2
Example 14: Auto Sales
Find the variance and standard deviation for the
amount of European auto sales for a sample of 6
years. The data are in millions of dollars.
11.2, 11.9, 12.0, 12.8, 13.4, 14.3
1
)( 2




n
xx
s
3.1 - 3
1
)( 2




n
xx
s
Example 14: Auto Sales
Find the variance and standard deviation for the
amount of European auto sales for a sample of 6
years. The data are in millions of dollars.
11.2, 11.9, 12.0, 12.8, 13.4, 14.3
Calculate the mean
3.1 - 4
Example 14: Auto Sales
1
)( 2




n
xx
s
Find the variance and standard deviation for the
amount of European auto sales for a sample of 6
years. The data are in millions of dollars.
11.2, 11.9, 12.0, 12.8, 13.4, 14.3
Calculate the mean
3.1 - 5
Example 14: Auto Sales
Find the variance and standard deviation for the
amount of European auto sales for a sample of 6
years. The data are in millions of dollars.
11.2, 11.9, 12.0, 12.8, 13.4, 14.3
Create a column of each
value minus the mean
1
)( 2




n
xx
s
3.1 - 6
Example 14: Auto Sales
Find the variance and standard deviation for the
amount of European auto sales for a sample of 6
years. The data are in millions of dollars.
11.2, 11.9, 12.0, 12.8, 13.4, 14.3
Create a column of each
value minus the mean
x
11.2
11.9
12.0
12.8
13.4
14.3
1
)( 2




n
xx
s
3.1 - 7
Example 14: Auto Sales
Find the variance and standard deviation for the
amount of European auto sales for a sample of 6
years. The data are in millions of dollars.
11.2, 11.9, 12.0, 12.8, 13.4, 14.3
Create a column of each
value minus the mean
x
11.2
11.9
12.0
12.8
13.4
14.3
12.6
12.6
12.6
12.6
12.6
12.6
1
)( 2




n
xx
s
3.1 - 8
Example 14: Auto Sales
Find the variance and standard deviation for the
amount of European auto sales for a sample of 6
years. The data are in millions of dollars.
11.2, 11.9, 12.0, 12.8, 13.4, 14.3
Create a column of each
value minus the mean
x
11.2
11.9
12.0
12.8
13.4
14.3
11.2-12.612.6
12.6
12.6
12.6
12.6
12.6
1
)( 2




n
xx
s
3.1 - 9
Example 14: Auto Sales
Find the variance and standard deviation for the
amount of European auto sales for a sample of 6
years. The data are in millions of dollars.
11.2, 11.9, 12.0, 12.8, 13.4, 14.3
Create a column of each
value minus the mean
x
11.2
11.9
12.0
12.8
13.4
14.3
12.6
12.6
12.6
12.6
12.6
12.6
-1.4 1
)( 2




n
xx
s
3.1 - 10
Example 14: Auto Sales
Find the variance and standard deviation for the
amount of European auto sales for a sample of 6
years. The data are in millions of dollars.
11.2, 11.9, 12.0, 12.8, 13.4, 14.3
Create a column of each
value minus the mean
x
11.2
11.9
12.0
12.8
13.4
14.3
12.6
12.6
12.6
12.6
12.6
12.6
-1.4
-0.7
1
)( 2




n
xx
s
3.1 - 11
Example 14: Auto Sales
Find the variance and standard deviation for the
amount of European auto sales for a sample of 6
years. The data are in millions of dollars.
11.2, 11.9, 12.0, 12.8, 13.4, 14.3
Create a column of each
value minus the mean
x
11.2
11.9
12.0
12.8
13.4
14.3
12.6
12.6
12.6
12.6
12.6
12.6
-1.4
-0.7
-0.6
1
)( 2




n
xx
s
3.1 - 12
Example 14: Auto Sales
Find the variance and standard deviation for the
amount of European auto sales for a sample of 6
years. The data are in millions of dollars.
11.2, 11.9, 12.0, 12.8, 13.4, 14.3
Create a column of each
value minus the mean
x
11.2
11.9
12.0
12.8
13.4
14.3
12.6
12.6
12.6
12.6
12.6
12.6
-1.4
-0.7
-0.6
0.2
1
)( 2




n
xx
s
3.1 - 13
Example 14: Auto Sales
Find the variance and standard deviation for the
amount of European auto sales for a sample of 6
years. The data are in millions of dollars.
11.2, 11.9, 12.0, 12.8, 13.4, 14.3
Create a column of each
value minus the mean
x
11.2
11.9
12.0
12.8
13.4
14.3
12.6
12.6
12.6
12.6
12.6
12.6
-1.4
-0.7
-0.6
0.2
0.8
1
)( 2




n
xx
s
3.1 - 14
Example 14: Auto Sales
Find the variance and standard deviation for the
amount of European auto sales for a sample of 6
years. The data are in millions of dollars.
11.2, 11.9, 12.0, 12.8, 13.4, 14.3
Create a column of each
value minus the mean
x
11.2
11.9
12.0
12.8
13.4
14.3
12.6
12.6
12.6
12.6
12.6
12.6
-1.4
-0.7
-0.6
0.2
0.8
1.7
1
)( 2




n
xx
s
3.1 - 15
Example 14: Auto Sales
Find the variance and standard deviation for the
amount of European auto sales for a sample of 6
years. The data are in millions of dollars.
11.2, 11.9, 12.0, 12.8, 13.4, 14.3
Square each deviation
from the mean
x
11.2
11.9
12.0
12.8
13.4
14.3
12.6
12.6
12.6
12.6
12.6
12.6
-1.4
-0.7
-0.6
0.2
0.8
1.7
1
)( 2




n
xx
s
3.1 - 16
Example 14: Auto Sales
Find the variance and standard deviation for the
amount of European auto sales for a sample of 6
years. The data are in millions of dollars.
11.2, 11.9, 12.0, 12.8, 13.4, 14.3
Square each deviation
from the mean
x
11.2
11.9
12.0
12.8
13.4
14.3
12.6
12.6
12.6
12.6
12.6
12.6
-1.4
-0.7
-0.6
0.2
0.8
1.7
1.96 1
)( 2




n
xx
s
3.1 - 17
Example 14: Auto Sales
Find the variance and standard deviation for the
amount of European auto sales for a sample of 6
years. The data are in millions of dollars.
11.2, 11.9, 12.0, 12.8, 13.4, 14.3
Square each deviation
from the mean
x
11.2
11.9
12.0
12.8
13.4
14.3
12.6
12.6
12.6
12.6
12.6
12.6
-1.4
-0.7
-0.6
0.2
0.8
1.7
1.96
0.49
1
)( 2




n
xx
s
3.1 - 18
Example 14: Auto Sales
Find the variance and standard deviation for the
amount of European auto sales for a sample of 6
years. The data are in millions of dollars.
11.2, 11.9, 12.0, 12.8, 13.4, 14.3
Square each deviation
from the mean
x
11.2
11.9
12.0
12.8
13.4
14.3
12.6
12.6
12.6
12.6
12.6
12.6
-1.4
-0.7
-0.6
0.2
0.8
1.7
1.96
0.49
0.36
1
)( 2




n
xx
s
3.1 - 19
Example 14: Auto Sales
Find the variance and standard deviation for the
amount of European auto sales for a sample of 6
years. The data are in millions of dollars.
11.2, 11.9, 12.0, 12.8, 13.4, 14.3
Square each deviation
from the mean
x
11.2
11.9
12.0
12.8
13.4
14.3
12.6
12.6
12.6
12.6
12.6
12.6
-1.4
-0.7
-0.6
0.2
0.8
1.7
1.96
0.49
0.36
0.04
1
)( 2




n
xx
s
3.1 - 20
Example 14: Auto Sales
Find the variance and standard deviation for the
amount of European auto sales for a sample of 6
years. The data are in millions of dollars.
11.2, 11.9, 12.0, 12.8, 13.4, 14.3
Square each deviation
from the mean
x
11.2
11.9
12.0
12.8
13.4
14.3
12.6
12.6
12.6
12.6
12.6
12.6
-1.4
-0.7
-0.6
0.2
0.8
1.7
1.96
0.49
0.36
0.04
0.64
1
)( 2




n
xx
s
3.1 - 21
Example 14: Auto Sales
Find the variance and standard deviation for the
amount of European auto sales for a sample of 6
years. The data are in millions of dollars.
11.2, 11.9, 12.0, 12.8, 13.4, 14.3
Square each deviation
from the mean
x
11.2
11.9
12.0
12.8
13.4
14.3
12.6
12.6
12.6
12.6
12.6
12.6
-1.4
-0.7
-0.6
0.2
0.8
1.7
1.96
0.49
0.36
0.04
0.64
2.89
1
)( 2




n
xx
s
3.1 - 22
Example 14: Auto Sales
Find the variance and standard deviation for the
amount of European auto sales for a sample of 6
years. The data are in millions of dollars.
11.2, 11.9, 12.0, 12.8, 13.4, 14.3
Sum the squared
deviations from the
mean
x
11.2
11.9
12.0
12.8
13.4
14.3
12.6
12.6
12.6
12.6
12.6
12.6
-1.4
-0.7
-0.6
0.2
0.8
1.7
1.96
0.49
0.36
0.04
0.64
2.89
1
)( 2




n
xx
s
3.1 - 23
Example 14: Auto Sales
Find the variance and standard deviation for the
amount of European auto sales for a sample of 6
years. The data are in millions of dollars.
11.2, 11.9, 12.0, 12.8, 13.4, 14.3
Sum the squared
deviations from the
mean
x
11.2
11.9
12.0
12.8
13.4
14.3
12.6
12.6
12.6
12.6
12.6
12.6
-1.4
-0.7
-0.6
0.2
0.8
1.7
1.96
0.49
0.36
0.04
0.64
2.89
6.38
1
)( 2




n
xx
s
3.1 - 24
Example 14: Auto Sales
Find the variance and standard deviation for the
amount of European auto sales for a sample of 6
years. The data are in millions of dollars.
11.2, 11.9, 12.0, 12.8, 13.4, 14.3
x
11.2
11.9
12.0
12.8
13.4
14.3
12.6
12.6
12.6
12.6
12.6
12.6
-1.4
-0.7
-0.6
0.2
0.8
1.7
1.96
0.49
0.36
0.04
0.64
2.89
6.38
5
38.6
1
)( 2





n
xx
s
3.1 - 25
Example 14: Auto Sales
Find the variance and standard deviation for the
amount of European auto sales for a sample of 6
years. The data are in millions of dollars.
11.2, 11.9, 12.0, 12.8, 13.4, 14.3
x
11.2
11.9
12.0
12.8
13.4
14.3
12.6
12.6
12.6
12.6
12.6
12.6
-1.4
-0.7
-0.6
0.2
0.8
1.7
1.96
0.49
0.36
0.04
0.64
2.89
6.38 13.1
5
38.6
1
)( 2






n
xx
s

Weitere ähnliche Inhalte

Was ist angesagt?

Chapter 4 part2- Random Variables
Chapter 4 part2- Random VariablesChapter 4 part2- Random Variables
Chapter 4 part2- Random Variablesnszakir
 
Philippine laws in Protecting Environtment
Philippine laws in Protecting EnvirontmentPhilippine laws in Protecting Environtment
Philippine laws in Protecting EnvirontmentElly Brent Baldovino
 
Weighted Mean - New Diet Cola
Weighted Mean - New Diet ColaWeighted Mean - New Diet Cola
Weighted Mean - New Diet Colaccooking
 
Real Applications of Normal Distributions
Real Applications of Normal Distributions Real Applications of Normal Distributions
Real Applications of Normal Distributions Long Beach City College
 
Ch3 Probability and The Normal Distribution
Ch3 Probability and The Normal Distribution Ch3 Probability and The Normal Distribution
Ch3 Probability and The Normal Distribution Farhan Alfin
 
parameter and statistic - Copy.pptx
parameter and statistic - Copy.pptxparameter and statistic - Copy.pptx
parameter and statistic - Copy.pptxJoyMendoza31
 
Chapter 3 research methodology
Chapter 3 research methodologyChapter 3 research methodology
Chapter 3 research methodologyNeilson Silva
 
Mean, variance, and standard deviation of a Discrete Random Variable
Mean, variance, and standard deviation of a Discrete Random VariableMean, variance, and standard deviation of a Discrete Random Variable
Mean, variance, and standard deviation of a Discrete Random VariableMichael Ogoy
 
Manelyn L. Mananap Thesis (Chapter 3)
Manelyn L. Mananap Thesis (Chapter 3)Manelyn L. Mananap Thesis (Chapter 3)
Manelyn L. Mananap Thesis (Chapter 3)mtlobrido
 
Questions On Hypothesis Testing
Questions On Hypothesis TestingQuestions On Hypothesis Testing
Questions On Hypothesis TestingNeha Chauhan
 

Was ist angesagt? (20)

Chapter 4 part2- Random Variables
Chapter 4 part2- Random VariablesChapter 4 part2- Random Variables
Chapter 4 part2- Random Variables
 
Philippine laws in Protecting Environtment
Philippine laws in Protecting EnvirontmentPhilippine laws in Protecting Environtment
Philippine laws in Protecting Environtment
 
Ch8 ppt
Ch8 pptCh8 ppt
Ch8 ppt
 
11-Management Science
11-Management Science11-Management Science
11-Management Science
 
Weighted Mean - New Diet Cola
Weighted Mean - New Diet ColaWeighted Mean - New Diet Cola
Weighted Mean - New Diet Cola
 
Real Applications of Normal Distributions
Real Applications of Normal Distributions Real Applications of Normal Distributions
Real Applications of Normal Distributions
 
Annuities
AnnuitiesAnnuities
Annuities
 
Compound interest
Compound interestCompound interest
Compound interest
 
Ch3 Probability and The Normal Distribution
Ch3 Probability and The Normal Distribution Ch3 Probability and The Normal Distribution
Ch3 Probability and The Normal Distribution
 
parameter and statistic - Copy.pptx
parameter and statistic - Copy.pptxparameter and statistic - Copy.pptx
parameter and statistic - Copy.pptx
 
Probability and statistics
Probability and statisticsProbability and statistics
Probability and statistics
 
Chapter 3
Chapter 3Chapter 3
Chapter 3
 
Case study format
Case study formatCase study format
Case study format
 
Presentation on ra 8749
Presentation on ra 8749Presentation on ra 8749
Presentation on ra 8749
 
Chapter 3 research methodology
Chapter 3 research methodologyChapter 3 research methodology
Chapter 3 research methodology
 
Mean, variance, and standard deviation of a Discrete Random Variable
Mean, variance, and standard deviation of a Discrete Random VariableMean, variance, and standard deviation of a Discrete Random Variable
Mean, variance, and standard deviation of a Discrete Random Variable
 
Manelyn L. Mananap Thesis (Chapter 3)
Manelyn L. Mananap Thesis (Chapter 3)Manelyn L. Mananap Thesis (Chapter 3)
Manelyn L. Mananap Thesis (Chapter 3)
 
Case analysis format
Case analysis formatCase analysis format
Case analysis format
 
Questions On Hypothesis Testing
Questions On Hypothesis TestingQuestions On Hypothesis Testing
Questions On Hypothesis Testing
 
Measures of variation discuss 2.1
Measures of variation discuss  2.1Measures of variation discuss  2.1
Measures of variation discuss 2.1
 

Mehr von ccooking

Module 3 example 15
Module 3 example 15Module 3 example 15
Module 3 example 15ccooking
 
Module 8 desk work 3
Module 8 desk work 3Module 8 desk work 3
Module 8 desk work 3ccooking
 
Desk work 4
Desk work 4Desk work 4
Desk work 4ccooking
 
Relative frequency approximation Blood Types
Relative frequency approximation Blood TypesRelative frequency approximation Blood Types
Relative frequency approximation Blood Typesccooking
 
Sample Standard Deviation - Desk Work 8
Sample Standard Deviation - Desk Work 8Sample Standard Deviation - Desk Work 8
Sample Standard Deviation - Desk Work 8ccooking
 
Population Standard Deviation - Desk Work 7
Population Standard Deviation - Desk Work 7Population Standard Deviation - Desk Work 7
Population Standard Deviation - Desk Work 7ccooking
 
Weighted Mean - Class Average (Desk Work 6)
Weighted Mean - Class Average (Desk Work 6)Weighted Mean - Class Average (Desk Work 6)
Weighted Mean - Class Average (Desk Work 6)ccooking
 
Weighted Mean - Helicopter Costs
Weighted Mean - Helicopter CostsWeighted Mean - Helicopter Costs
Weighted Mean - Helicopter Costsccooking
 
Weighted Mean - Class Average
Weighted Mean - Class AverageWeighted Mean - Class Average
Weighted Mean - Class Averageccooking
 
Mean of a frequency distribution
Mean of a frequency distributionMean of a frequency distribution
Mean of a frequency distributionccooking
 

Mehr von ccooking (10)

Module 3 example 15
Module 3 example 15Module 3 example 15
Module 3 example 15
 
Module 8 desk work 3
Module 8 desk work 3Module 8 desk work 3
Module 8 desk work 3
 
Desk work 4
Desk work 4Desk work 4
Desk work 4
 
Relative frequency approximation Blood Types
Relative frequency approximation Blood TypesRelative frequency approximation Blood Types
Relative frequency approximation Blood Types
 
Sample Standard Deviation - Desk Work 8
Sample Standard Deviation - Desk Work 8Sample Standard Deviation - Desk Work 8
Sample Standard Deviation - Desk Work 8
 
Population Standard Deviation - Desk Work 7
Population Standard Deviation - Desk Work 7Population Standard Deviation - Desk Work 7
Population Standard Deviation - Desk Work 7
 
Weighted Mean - Class Average (Desk Work 6)
Weighted Mean - Class Average (Desk Work 6)Weighted Mean - Class Average (Desk Work 6)
Weighted Mean - Class Average (Desk Work 6)
 
Weighted Mean - Helicopter Costs
Weighted Mean - Helicopter CostsWeighted Mean - Helicopter Costs
Weighted Mean - Helicopter Costs
 
Weighted Mean - Class Average
Weighted Mean - Class AverageWeighted Mean - Class Average
Weighted Mean - Class Average
 
Mean of a frequency distribution
Mean of a frequency distributionMean of a frequency distribution
Mean of a frequency distribution
 

Kürzlich hochgeladen

SOCIAL AND HISTORICAL CONTEXT - LFTVD.pptx
SOCIAL AND HISTORICAL CONTEXT - LFTVD.pptxSOCIAL AND HISTORICAL CONTEXT - LFTVD.pptx
SOCIAL AND HISTORICAL CONTEXT - LFTVD.pptxiammrhaywood
 
Paris 2024 Olympic Geographies - an activity
Paris 2024 Olympic Geographies - an activityParis 2024 Olympic Geographies - an activity
Paris 2024 Olympic Geographies - an activityGeoBlogs
 
The basics of sentences session 2pptx copy.pptx
The basics of sentences session 2pptx copy.pptxThe basics of sentences session 2pptx copy.pptx
The basics of sentences session 2pptx copy.pptxheathfieldcps1
 
Nutritional Needs Presentation - HLTH 104
Nutritional Needs Presentation - HLTH 104Nutritional Needs Presentation - HLTH 104
Nutritional Needs Presentation - HLTH 104misteraugie
 
Web & Social Media Analytics Previous Year Question Paper.pdf
Web & Social Media Analytics Previous Year Question Paper.pdfWeb & Social Media Analytics Previous Year Question Paper.pdf
Web & Social Media Analytics Previous Year Question Paper.pdfJayanti Pande
 
CARE OF CHILD IN INCUBATOR..........pptx
CARE OF CHILD IN INCUBATOR..........pptxCARE OF CHILD IN INCUBATOR..........pptx
CARE OF CHILD IN INCUBATOR..........pptxGaneshChakor2
 
mini mental status format.docx
mini    mental       status     format.docxmini    mental       status     format.docx
mini mental status format.docxPoojaSen20
 
Sports & Fitness Value Added Course FY..
Sports & Fitness Value Added Course FY..Sports & Fitness Value Added Course FY..
Sports & Fitness Value Added Course FY..Disha Kariya
 
The Most Excellent Way | 1 Corinthians 13
The Most Excellent Way | 1 Corinthians 13The Most Excellent Way | 1 Corinthians 13
The Most Excellent Way | 1 Corinthians 13Steve Thomason
 
BAG TECHNIQUE Bag technique-a tool making use of public health bag through wh...
BAG TECHNIQUE Bag technique-a tool making use of public health bag through wh...BAG TECHNIQUE Bag technique-a tool making use of public health bag through wh...
BAG TECHNIQUE Bag technique-a tool making use of public health bag through wh...Sapna Thakur
 
Accessible design: Minimum effort, maximum impact
Accessible design: Minimum effort, maximum impactAccessible design: Minimum effort, maximum impact
Accessible design: Minimum effort, maximum impactdawncurless
 
social pharmacy d-pharm 1st year by Pragati K. Mahajan
social pharmacy d-pharm 1st year by Pragati K. Mahajansocial pharmacy d-pharm 1st year by Pragati K. Mahajan
social pharmacy d-pharm 1st year by Pragati K. Mahajanpragatimahajan3
 
Beyond the EU: DORA and NIS 2 Directive's Global Impact
Beyond the EU: DORA and NIS 2 Directive's Global ImpactBeyond the EU: DORA and NIS 2 Directive's Global Impact
Beyond the EU: DORA and NIS 2 Directive's Global ImpactPECB
 
Interactive Powerpoint_How to Master effective communication
Interactive Powerpoint_How to Master effective communicationInteractive Powerpoint_How to Master effective communication
Interactive Powerpoint_How to Master effective communicationnomboosow
 
A Critique of the Proposed National Education Policy Reform
A Critique of the Proposed National Education Policy ReformA Critique of the Proposed National Education Policy Reform
A Critique of the Proposed National Education Policy ReformChameera Dedduwage
 
Measures of Central Tendency: Mean, Median and Mode
Measures of Central Tendency: Mean, Median and ModeMeasures of Central Tendency: Mean, Median and Mode
Measures of Central Tendency: Mean, Median and ModeThiyagu K
 
Introduction to Nonprofit Accounting: The Basics
Introduction to Nonprofit Accounting: The BasicsIntroduction to Nonprofit Accounting: The Basics
Introduction to Nonprofit Accounting: The BasicsTechSoup
 
1029 - Danh muc Sach Giao Khoa 10 . pdf
1029 -  Danh muc Sach Giao Khoa 10 . pdf1029 -  Danh muc Sach Giao Khoa 10 . pdf
1029 - Danh muc Sach Giao Khoa 10 . pdfQucHHunhnh
 
Separation of Lanthanides/ Lanthanides and Actinides
Separation of Lanthanides/ Lanthanides and ActinidesSeparation of Lanthanides/ Lanthanides and Actinides
Separation of Lanthanides/ Lanthanides and ActinidesFatimaKhan178732
 

Kürzlich hochgeladen (20)

SOCIAL AND HISTORICAL CONTEXT - LFTVD.pptx
SOCIAL AND HISTORICAL CONTEXT - LFTVD.pptxSOCIAL AND HISTORICAL CONTEXT - LFTVD.pptx
SOCIAL AND HISTORICAL CONTEXT - LFTVD.pptx
 
Paris 2024 Olympic Geographies - an activity
Paris 2024 Olympic Geographies - an activityParis 2024 Olympic Geographies - an activity
Paris 2024 Olympic Geographies - an activity
 
The basics of sentences session 2pptx copy.pptx
The basics of sentences session 2pptx copy.pptxThe basics of sentences session 2pptx copy.pptx
The basics of sentences session 2pptx copy.pptx
 
Nutritional Needs Presentation - HLTH 104
Nutritional Needs Presentation - HLTH 104Nutritional Needs Presentation - HLTH 104
Nutritional Needs Presentation - HLTH 104
 
Web & Social Media Analytics Previous Year Question Paper.pdf
Web & Social Media Analytics Previous Year Question Paper.pdfWeb & Social Media Analytics Previous Year Question Paper.pdf
Web & Social Media Analytics Previous Year Question Paper.pdf
 
CARE OF CHILD IN INCUBATOR..........pptx
CARE OF CHILD IN INCUBATOR..........pptxCARE OF CHILD IN INCUBATOR..........pptx
CARE OF CHILD IN INCUBATOR..........pptx
 
mini mental status format.docx
mini    mental       status     format.docxmini    mental       status     format.docx
mini mental status format.docx
 
Sports & Fitness Value Added Course FY..
Sports & Fitness Value Added Course FY..Sports & Fitness Value Added Course FY..
Sports & Fitness Value Added Course FY..
 
The Most Excellent Way | 1 Corinthians 13
The Most Excellent Way | 1 Corinthians 13The Most Excellent Way | 1 Corinthians 13
The Most Excellent Way | 1 Corinthians 13
 
BAG TECHNIQUE Bag technique-a tool making use of public health bag through wh...
BAG TECHNIQUE Bag technique-a tool making use of public health bag through wh...BAG TECHNIQUE Bag technique-a tool making use of public health bag through wh...
BAG TECHNIQUE Bag technique-a tool making use of public health bag through wh...
 
Accessible design: Minimum effort, maximum impact
Accessible design: Minimum effort, maximum impactAccessible design: Minimum effort, maximum impact
Accessible design: Minimum effort, maximum impact
 
social pharmacy d-pharm 1st year by Pragati K. Mahajan
social pharmacy d-pharm 1st year by Pragati K. Mahajansocial pharmacy d-pharm 1st year by Pragati K. Mahajan
social pharmacy d-pharm 1st year by Pragati K. Mahajan
 
Beyond the EU: DORA and NIS 2 Directive's Global Impact
Beyond the EU: DORA and NIS 2 Directive's Global ImpactBeyond the EU: DORA and NIS 2 Directive's Global Impact
Beyond the EU: DORA and NIS 2 Directive's Global Impact
 
Interactive Powerpoint_How to Master effective communication
Interactive Powerpoint_How to Master effective communicationInteractive Powerpoint_How to Master effective communication
Interactive Powerpoint_How to Master effective communication
 
INDIA QUIZ 2024 RLAC DELHI UNIVERSITY.pptx
INDIA QUIZ 2024 RLAC DELHI UNIVERSITY.pptxINDIA QUIZ 2024 RLAC DELHI UNIVERSITY.pptx
INDIA QUIZ 2024 RLAC DELHI UNIVERSITY.pptx
 
A Critique of the Proposed National Education Policy Reform
A Critique of the Proposed National Education Policy ReformA Critique of the Proposed National Education Policy Reform
A Critique of the Proposed National Education Policy Reform
 
Measures of Central Tendency: Mean, Median and Mode
Measures of Central Tendency: Mean, Median and ModeMeasures of Central Tendency: Mean, Median and Mode
Measures of Central Tendency: Mean, Median and Mode
 
Introduction to Nonprofit Accounting: The Basics
Introduction to Nonprofit Accounting: The BasicsIntroduction to Nonprofit Accounting: The Basics
Introduction to Nonprofit Accounting: The Basics
 
1029 - Danh muc Sach Giao Khoa 10 . pdf
1029 -  Danh muc Sach Giao Khoa 10 . pdf1029 -  Danh muc Sach Giao Khoa 10 . pdf
1029 - Danh muc Sach Giao Khoa 10 . pdf
 
Separation of Lanthanides/ Lanthanides and Actinides
Separation of Lanthanides/ Lanthanides and ActinidesSeparation of Lanthanides/ Lanthanides and Actinides
Separation of Lanthanides/ Lanthanides and Actinides
 

Calculate Variance and Standard Deviation of European Auto Sales

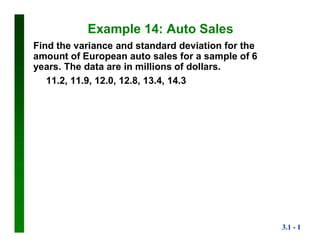
  • 1. 3.1 - 1 Example 14: Auto Sales Find the variance and standard deviation for the amount of European auto sales for a sample of 6 years. The data are in millions of dollars. 11.2, 11.9, 12.0, 12.8, 13.4, 14.3
  • 2. 3.1 - 2 Example 14: Auto Sales Find the variance and standard deviation for the amount of European auto sales for a sample of 6 years. The data are in millions of dollars. 11.2, 11.9, 12.0, 12.8, 13.4, 14.3 1 )( 2     n xx s
  • 3. 3.1 - 3 1 )( 2     n xx s Example 14: Auto Sales Find the variance and standard deviation for the amount of European auto sales for a sample of 6 years. The data are in millions of dollars. 11.2, 11.9, 12.0, 12.8, 13.4, 14.3 Calculate the mean
  • 4. 3.1 - 4 Example 14: Auto Sales 1 )( 2     n xx s Find the variance and standard deviation for the amount of European auto sales for a sample of 6 years. The data are in millions of dollars. 11.2, 11.9, 12.0, 12.8, 13.4, 14.3 Calculate the mean
  • 5. 3.1 - 5 Example 14: Auto Sales Find the variance and standard deviation for the amount of European auto sales for a sample of 6 years. The data are in millions of dollars. 11.2, 11.9, 12.0, 12.8, 13.4, 14.3 Create a column of each value minus the mean 1 )( 2     n xx s
  • 6. 3.1 - 6 Example 14: Auto Sales Find the variance and standard deviation for the amount of European auto sales for a sample of 6 years. The data are in millions of dollars. 11.2, 11.9, 12.0, 12.8, 13.4, 14.3 Create a column of each value minus the mean x 11.2 11.9 12.0 12.8 13.4 14.3 1 )( 2     n xx s
  • 7. 3.1 - 7 Example 14: Auto Sales Find the variance and standard deviation for the amount of European auto sales for a sample of 6 years. The data are in millions of dollars. 11.2, 11.9, 12.0, 12.8, 13.4, 14.3 Create a column of each value minus the mean x 11.2 11.9 12.0 12.8 13.4 14.3 12.6 12.6 12.6 12.6 12.6 12.6 1 )( 2     n xx s
  • 8. 3.1 - 8 Example 14: Auto Sales Find the variance and standard deviation for the amount of European auto sales for a sample of 6 years. The data are in millions of dollars. 11.2, 11.9, 12.0, 12.8, 13.4, 14.3 Create a column of each value minus the mean x 11.2 11.9 12.0 12.8 13.4 14.3 11.2-12.612.6 12.6 12.6 12.6 12.6 12.6 1 )( 2     n xx s
  • 9. 3.1 - 9 Example 14: Auto Sales Find the variance and standard deviation for the amount of European auto sales for a sample of 6 years. The data are in millions of dollars. 11.2, 11.9, 12.0, 12.8, 13.4, 14.3 Create a column of each value minus the mean x 11.2 11.9 12.0 12.8 13.4 14.3 12.6 12.6 12.6 12.6 12.6 12.6 -1.4 1 )( 2     n xx s
  • 10. 3.1 - 10 Example 14: Auto Sales Find the variance and standard deviation for the amount of European auto sales for a sample of 6 years. The data are in millions of dollars. 11.2, 11.9, 12.0, 12.8, 13.4, 14.3 Create a column of each value minus the mean x 11.2 11.9 12.0 12.8 13.4 14.3 12.6 12.6 12.6 12.6 12.6 12.6 -1.4 -0.7 1 )( 2     n xx s
  • 11. 3.1 - 11 Example 14: Auto Sales Find the variance and standard deviation for the amount of European auto sales for a sample of 6 years. The data are in millions of dollars. 11.2, 11.9, 12.0, 12.8, 13.4, 14.3 Create a column of each value minus the mean x 11.2 11.9 12.0 12.8 13.4 14.3 12.6 12.6 12.6 12.6 12.6 12.6 -1.4 -0.7 -0.6 1 )( 2     n xx s
  • 12. 3.1 - 12 Example 14: Auto Sales Find the variance and standard deviation for the amount of European auto sales for a sample of 6 years. The data are in millions of dollars. 11.2, 11.9, 12.0, 12.8, 13.4, 14.3 Create a column of each value minus the mean x 11.2 11.9 12.0 12.8 13.4 14.3 12.6 12.6 12.6 12.6 12.6 12.6 -1.4 -0.7 -0.6 0.2 1 )( 2     n xx s
  • 13. 3.1 - 13 Example 14: Auto Sales Find the variance and standard deviation for the amount of European auto sales for a sample of 6 years. The data are in millions of dollars. 11.2, 11.9, 12.0, 12.8, 13.4, 14.3 Create a column of each value minus the mean x 11.2 11.9 12.0 12.8 13.4 14.3 12.6 12.6 12.6 12.6 12.6 12.6 -1.4 -0.7 -0.6 0.2 0.8 1 )( 2     n xx s
  • 14. 3.1 - 14 Example 14: Auto Sales Find the variance and standard deviation for the amount of European auto sales for a sample of 6 years. The data are in millions of dollars. 11.2, 11.9, 12.0, 12.8, 13.4, 14.3 Create a column of each value minus the mean x 11.2 11.9 12.0 12.8 13.4 14.3 12.6 12.6 12.6 12.6 12.6 12.6 -1.4 -0.7 -0.6 0.2 0.8 1.7 1 )( 2     n xx s
  • 15. 3.1 - 15 Example 14: Auto Sales Find the variance and standard deviation for the amount of European auto sales for a sample of 6 years. The data are in millions of dollars. 11.2, 11.9, 12.0, 12.8, 13.4, 14.3 Square each deviation from the mean x 11.2 11.9 12.0 12.8 13.4 14.3 12.6 12.6 12.6 12.6 12.6 12.6 -1.4 -0.7 -0.6 0.2 0.8 1.7 1 )( 2     n xx s
  • 16. 3.1 - 16 Example 14: Auto Sales Find the variance and standard deviation for the amount of European auto sales for a sample of 6 years. The data are in millions of dollars. 11.2, 11.9, 12.0, 12.8, 13.4, 14.3 Square each deviation from the mean x 11.2 11.9 12.0 12.8 13.4 14.3 12.6 12.6 12.6 12.6 12.6 12.6 -1.4 -0.7 -0.6 0.2 0.8 1.7 1.96 1 )( 2     n xx s
  • 17. 3.1 - 17 Example 14: Auto Sales Find the variance and standard deviation for the amount of European auto sales for a sample of 6 years. The data are in millions of dollars. 11.2, 11.9, 12.0, 12.8, 13.4, 14.3 Square each deviation from the mean x 11.2 11.9 12.0 12.8 13.4 14.3 12.6 12.6 12.6 12.6 12.6 12.6 -1.4 -0.7 -0.6 0.2 0.8 1.7 1.96 0.49 1 )( 2     n xx s
  • 18. 3.1 - 18 Example 14: Auto Sales Find the variance and standard deviation for the amount of European auto sales for a sample of 6 years. The data are in millions of dollars. 11.2, 11.9, 12.0, 12.8, 13.4, 14.3 Square each deviation from the mean x 11.2 11.9 12.0 12.8 13.4 14.3 12.6 12.6 12.6 12.6 12.6 12.6 -1.4 -0.7 -0.6 0.2 0.8 1.7 1.96 0.49 0.36 1 )( 2     n xx s
  • 19. 3.1 - 19 Example 14: Auto Sales Find the variance and standard deviation for the amount of European auto sales for a sample of 6 years. The data are in millions of dollars. 11.2, 11.9, 12.0, 12.8, 13.4, 14.3 Square each deviation from the mean x 11.2 11.9 12.0 12.8 13.4 14.3 12.6 12.6 12.6 12.6 12.6 12.6 -1.4 -0.7 -0.6 0.2 0.8 1.7 1.96 0.49 0.36 0.04 1 )( 2     n xx s
  • 20. 3.1 - 20 Example 14: Auto Sales Find the variance and standard deviation for the amount of European auto sales for a sample of 6 years. The data are in millions of dollars. 11.2, 11.9, 12.0, 12.8, 13.4, 14.3 Square each deviation from the mean x 11.2 11.9 12.0 12.8 13.4 14.3 12.6 12.6 12.6 12.6 12.6 12.6 -1.4 -0.7 -0.6 0.2 0.8 1.7 1.96 0.49 0.36 0.04 0.64 1 )( 2     n xx s
  • 21. 3.1 - 21 Example 14: Auto Sales Find the variance and standard deviation for the amount of European auto sales for a sample of 6 years. The data are in millions of dollars. 11.2, 11.9, 12.0, 12.8, 13.4, 14.3 Square each deviation from the mean x 11.2 11.9 12.0 12.8 13.4 14.3 12.6 12.6 12.6 12.6 12.6 12.6 -1.4 -0.7 -0.6 0.2 0.8 1.7 1.96 0.49 0.36 0.04 0.64 2.89 1 )( 2     n xx s
  • 22. 3.1 - 22 Example 14: Auto Sales Find the variance and standard deviation for the amount of European auto sales for a sample of 6 years. The data are in millions of dollars. 11.2, 11.9, 12.0, 12.8, 13.4, 14.3 Sum the squared deviations from the mean x 11.2 11.9 12.0 12.8 13.4 14.3 12.6 12.6 12.6 12.6 12.6 12.6 -1.4 -0.7 -0.6 0.2 0.8 1.7 1.96 0.49 0.36 0.04 0.64 2.89 1 )( 2     n xx s
  • 23. 3.1 - 23 Example 14: Auto Sales Find the variance and standard deviation for the amount of European auto sales for a sample of 6 years. The data are in millions of dollars. 11.2, 11.9, 12.0, 12.8, 13.4, 14.3 Sum the squared deviations from the mean x 11.2 11.9 12.0 12.8 13.4 14.3 12.6 12.6 12.6 12.6 12.6 12.6 -1.4 -0.7 -0.6 0.2 0.8 1.7 1.96 0.49 0.36 0.04 0.64 2.89 6.38 1 )( 2     n xx s
  • 24. 3.1 - 24 Example 14: Auto Sales Find the variance and standard deviation for the amount of European auto sales for a sample of 6 years. The data are in millions of dollars. 11.2, 11.9, 12.0, 12.8, 13.4, 14.3 x 11.2 11.9 12.0 12.8 13.4 14.3 12.6 12.6 12.6 12.6 12.6 12.6 -1.4 -0.7 -0.6 0.2 0.8 1.7 1.96 0.49 0.36 0.04 0.64 2.89 6.38 5 38.6 1 )( 2      n xx s
  • 25. 3.1 - 25 Example 14: Auto Sales Find the variance and standard deviation for the amount of European auto sales for a sample of 6 years. The data are in millions of dollars. 11.2, 11.9, 12.0, 12.8, 13.4, 14.3 x 11.2 11.9 12.0 12.8 13.4 14.3 12.6 12.6 12.6 12.6 12.6 12.6 -1.4 -0.7 -0.6 0.2 0.8 1.7 1.96 0.49 0.36 0.04 0.64 2.89 6.38 13.1 5 38.6 1 )( 2       n xx s