SlideShare ist ein Scribd-Unternehmen logo
1 von 39
Downloaden Sie, um offline zu lesen
CONGRESS OF THE UNITED STATES
                                                     CONGRESSIONAL BUDGET OFFICE


                                                      CBO
                                                             Use of
                                                       Tax Incentives for
                                                          Retirement
                                                        Saving in 2006
           Traditional or Roth IRA
1997
2000
2003
2006


           Employment-Based Plan
1997
2000
2003
2006


           Any Retirement Plan
1997


                                                                                                              © Shutterstock Images, LLC
2000
2003
2006
       0                  10                   20                       30                      40      50   60
                                     Participation in Retirement Plans as a Percentage of All Workers


                                                            OCTOBER 2011
Pub. No. 4167
CBO
   Use of Tax Incentives for
  Retirement Saving in 2006
                       October 2011


The Congress of the United States O Congressional Budget Office
Notes and Definitions
      Unless otherwise noted, all years referred to are calendar years. Numbers in the text, tables, and exhibits may not add up
      to totals because of rounding.


      Types of Tax Benefits
      Traditional: Retirement plans offering these benefits allow contributions to be made from before-tax income, deferring
      taxes until the funds are withdrawn.

      Roth-style: Retirement plans offering these benefits require contributions to be made from after-tax income, but
      impose no tax on withdrawals.


      Employment-Based Retirement Plans
      Defined-Benefit Plans: Retirement payments under this group of plans are set on the basis of formulas that typically
      consider an employee’s earnings and years of service. Because defined-benefit plans do not accept before-tax contribu-
      tions from employees, they are categorized as noncontributory. Roth-style benefits are not available through such plans.

      Defined-Contribution Plans: Retirement payments under this group of plans are made out of accounts that contain the
      amounts contributed by the employer and the employee, and the investment earnings on those contributions. For this
      study, defined-contribution plans are further subdivided into two groups, 401(k)-type plans and noncontributory
      defined-contribution plans.

      401(k)-type plans: These plans accept before-tax contributions from employees. Many such plans also permit employers
      to match some or all of their employees’ contributions. This category includes 401(k), 403(b), and 457 plans (all named
      for the sections of the Internal Revenue Code in which they are defined) and the federal government’s Thrift Savings
      Plan. 401(k) plans are most common in the private sector, 403(b) plans are most common in the nonprofit sector and
      in public school systems, and 457 plans are most common in other state and local government units. Before 2006,
      401(k)-type plans provided traditional tax benefits only; in 2006, Roth 401(k) plans were introduced for wage earners
      but not for self-employed people.

      Noncontributory defined-contribution plans: These plans do not accept before-tax contributions from employees; instead,
      they are funded entirely by employers. Roth-style benefits are not available through such plans.
CBO
NOTES AND DEFINITIONS                                                                                                     USE OF TAX INCENTIVES FOR RETIREMENT SAVING IN 2006   iii


                              Individual Retirement Accounts
                              Traditional IRAs: Most taxpayers who contribute to a traditional individual retirement account (IRA) are permitted to
                              make before-tax contributions to that account. However, if either the taxpayer or the taxpayer’s spouse is covered by an
                              employment-based plan, some or all of those contributions may be deemed after-tax contributions, depending on
                              income (see Table A-1 of the online supplemental material for details). In such cases, the amounts contributed can be
                              withdrawn tax-free, but the earnings on those contributions are taxable upon withdrawal. For this report, before- and
                              after-tax contributions to traditional IRAs were tabulated together.

                              Roth IRAs: The Roth-style IRA (introduced in 1998) accepts after-tax contributions only, and withdrawals are tax-free
                              once the account is five years old. Above certain income thresholds, however, contributions are limited or disallowed
                              (see Table A-1 of the online supplemental material for details).


                              Data and Supplemental Material
                              Source data: Participation in tax-favored retirement plans, contributions to such plans, and the amounts claimed for the
                              saver’s credit were tabulated from a sample of 320,897 individual income tax returns for 2006 and enhanced by attach-
                              ing data from supplemental tax forms filed by employers and financial institutions. Details on how that database was
                              assembled and used are presented in the appendix.

                              Identification of Plan Types: The data did not permit the discrete identification of all types of plans. For wage earners,
                              401(k)-type plans could be identified, but it was impossible to distinguish noncontributory defined-contribution from
                              noncontributory defined-benefit plans, so both varieties were tabulated together. (Note that noncontributory plans,
                              despite their label, include plans that require employees to make after-tax contributions and pay tax on benefits in
                              excess of those contributions.) None of the different employment-based plan types could be identified for self-employed
                              people, so all data on those workers were tabulated together.

                              People can participate in more than one type of plan, and such participation is generally reflected in the tabulations.
                              People who participated in an employment-based plan along with an IRA are counted in each category, as are people
                              who contributed both to a traditional IRA and to a Roth IRA. The exception is wage earners who participated in a
                              401(k)-type plan and a noncontributory plan at the same time. Because they are not separately identifiable in the data,
                              those workers are counted only as participants in 401(k)-type plans. Roth 401(k) plans are not identified separately in
                              the data, but there is evidence that participation in 2006 (the first year of their existence) was low.

                              Supplemental Material: Additional material is available online (www.cbo.gov), including detailed historical informa-
                              tion on changes in tax provisions and on participation rates; average contributions (in nominal amounts and as adjusted
                              for inflation); and percentages of people who were constrained by contribution limits for 1997, 2000, 2003, and 2006.


CBO
Preface


      In 2006, more than half of all U.S. workers participated in some form of tax-favored retirement plan. This study,
      the fourth in a triennial series published by the Congressional Budget Office (CBO) on participation rates in and
      contributions to various plans, examines data for that year. The first in the series, Utilization of Tax Incentives for
      Retirement Saving (August 2003), presented data from 1997; the subsequent updates presented data for 2000 and 2003.

      This document was prepared at the request of the Chairman of the Senate Finance Committee. In keeping with CBO’s
      mandate to provide objective, impartial analysis, the study makes no recommendations.

      Paul Burnham of CBO’s Tax Analysis Division produced the study under the direction of Frank Sammartino and
      Janet Holtzblatt. Frank Russek of CBO and Peter Brady of the Investment Company Institute provided useful
      comments. The assistance of an external reviewer implies no responsibility for the final product, which rests solely
      with CBO.

      Kate Kelly edited the document, and John Skeen proofread it. Maureen Costantino and Jeanine Rees prepared the
      document for publication, Monte Ruffin produced the printed copies, and Linda Schimmel handled the print
      distribution. An electronic version is available from CBO’s Web site (www.cbo.gov).


                                                              Douglas W. Elmendorf
                                                              Director

      October 2011


CBO
List of Exhibits

      Exhibit                                                                                                                     Page
      Participation Rates and Contributions
          1.    Participation in Tax-Favored Retirement Plans, 2003 and 2006                                                         5

          2.    Participation of Wage Earners in Employment-Based Retirement Plans, 2003 and 2006                                    6

          3.    Participation of the Self-Employed in Employment-Based Retirement Plans, 2003 and 2006                               7

          4.    Participation of the Self-Employed and Wage Earners in Employment-Based Retirement Plans, by Income Range, 2006      8

          5.    IRA Participation, 2003 and 2006                                                                                     9

          6.    IRA Participation, by Income Range, 2006                                                                            10

          7.    Retirement Plan Participation, 1997 to 2006                                                                         11

          8.    Contributions by Wage Earners to 401(k)-Type Plans, 2003 and 2006                                                   12

          9.    Contributions by the Self-Employed to Employment-Based Retirement Plans, 2003 and 2006                              13

         10.    Contributions to Traditional IRAs, 2003 and 2006                                                                    14

         11.    Contributions to Roth IRAs, 2003 and 2006                                                                           15

         12.    Average Contributions to Roth and Traditional IRAs, by Age Group, 2006                                              16

      Effects of EGTRRA’s Increases in Contribution Limits
         13.    Participants Making the Maximum Contribution, 2000 to 2006                                                          18

         14.    Average Real Contributions to Retirement Plans, 1997 to 2006                                                        19


CBO
LIST OF EXHIBITS                                                                                                USE OF TAX INCENTIVES FOR RETIREMENT SAVING IN 2006   vii


           Exhibit                                                                                                                                           Page
               15.       The Effect of EGTRRA on Maximum Contributions to 401(k)-Type Plans, 2006                                                               20

               16.       The Effect of EGTRRA on Maximum Contributions to Traditional IRAs, 2006                                                                21

               17.       The Effect of EGTRRA on Maximum Contributions to Roth IRAs, 2006                                                                       22

           Use of the Saver’s Credit
               18.       Eligibility for the Saver’s Credit, 2003 and 2006                                                                                      24

               19.       Claiming of the Saver’s Credit by Eligible Workers, 2003 and 2006                                                                      25

               20.       Eligible Contributors Claiming the Saver’s Credit, 2006                                                                                26

               21.       Average Saver’s Credits and Associated Contributions, 2003 and 2006                                                                    27

               22.       Other Features of Contributions for Which the Saver’s Credit May Be Claimed, 2003 and 2006                                             28

               23.       Effective Rate of the Saver’s Credit, 2006                                                                                             29


CBO
Use of Tax Incentives for
                                                                Retirement Saving in 2006

      The federal income tax system contains two alter-          This publication of the Congressional Budget          some of those workers also participated in
      native types of incentives to encourage workers to         Office (CBO) examines participation rates in and      employment-based plans.
      save for retirement. With traditional incentives,          contributions to various plans in 2006, with some
      workers make contributions (up to a statutory              earlier data presented for comparison. Two features   Twenty-nine percent of workers who filed tax
      limit) into certain accounts from their before-tax         of the Economic Growth and Tax Relief Reconcili-      returns were wage earners who contributed to
      income and defer tax payments until the funds are          ation Act of 2001 (EGTRRA) also are analyzed:         401(k)-type plans. Another 18 percent were wage
      withdrawn. With so-called Roth-style incentives,           increases in contribution limits and an additional    earners who participated in noncontributory
      workers contribute from after-tax income but pay           incentive created to encourage lower-income tax-      employment-based plans only. Participation rates
      no tax at the time of withdrawal. In either case, the      payers to save for retirement that is known as the    by age, income, and marital status for 401(k)-type
      resulting investment income is effectively earned          “saver’s credit.”                                     plans were similar to those for all tax-favored retire-
      tax-free. If the participant’s marginal tax rate is the                                                          ment plans. For employees who participated in
      same at the time of contribution as it is at the time                                                            noncontributory plans only, the rates were much
      of withdrawal, the tax benefits of traditional and         Participation Rates and                               more uniform across all groupings. Participants in
                                                                                                                       401(k)-type plans contributed an average of
      Roth-style treatment are the same. A participant           Contributions                                         $4,350 in 2006. Average contributions were higher
      whose marginal tax rate is lower at the time funds         In 2006, just over half (52 percent) of all workers
      are withdrawn would prefer traditional treatment;                                                                among older workers and those whose earnings fell
                                                                 who filed tax returns participated in some form of    into higher income ranges. For example, average
      a participant whose marginal tax rate is higher at         tax-favored retirement plan. The highest rates of
      withdrawal would prefer Roth-style treatment.                                                                    contributions were $670 among participants
                                                                 participation (64 percent and above) were seen        whose income was below $20,000 and $11,000
      Among the retirement savings vehicles permitting           among workers between the ages of 45 and 59;          among those earning $160,000 or more. Contri-
      a choice between traditional and Roth-style                those whose income was $40,000 or more; and           butions also were higher among married workers
      incentives are individual retirement accounts              those who were the primary (that is, the higher)      who were either a sole or a primary earner than
      (IRAs) and (at the discretion of the employer)             earner in a two-earner household. The lowest rates    they were among unmarried workers or among
      401(k)-type plans. Contributions to 401(k)-type            (41 percent or less) were among workers under the     secondary earners in two-earner couples.
      plans also can be made by employers, but such              age of 30; those whose income was under $20,000;
      contributions can benefit only from the traditional        and those who were unmarried. Participation was       Slightly fewer workers contributed to traditional
      incentive. Similarly, employer contributions to            concentrated in employment-based plans, with          IRAs (3 percent) than to Roth IRAs (4 percent)
      plans to which employees do not contribute (non-           48 percent of all workers either contributing to or   in 2006. Participation in each type of IRA was
      contributory plans) can benefit only from the              being covered by such a plan (47 percent as wage      strongly associated with income (except in the
      traditional incentive.                                     earners and 1 percent as self-employed people).       highest income range, in which workers were
                                                                 Only 7 percent of workers contributed to IRAs;        ineligible to contribute to a Roth IRA).


CBO
INTRODUCTION                                                                                                         USE OF TAX INCENTIVES FOR RETIREMENT SAVING IN 2006   2


      Participation in traditional IRAs was more strongly    be attributed to new saving and what represented
      correlated with age than was participation in Roth     shifting between types of accounts.                    Comparison of Pre-EGTRRA and
      IRAs. Two-earner married couples who filed joint
      returns were more likely than other married cou-
                                                                                                                    Current-Law Contribution Limits
      ples or single workers to contribute to any type of    Effects of EGTRRA’s Increases in                       in 2006
      IRA. Participation was lowest among unmarried          Contribution Limits                                                            Under                    Under
      workers. Contributions to traditional IRAs were        Tax law has always limited contributions to tax-                            Pre-EGTRRA               Current Law
      larger ($2,840), on average, than contributions to     favored retirement plans—both in dollar terms and                               Law                   (EGTRRA)
      Roth IRAs ($2,590). Average contributions to           as a percentage of compensation. EGTRRA raised                                             401(k) Plan
      both types of IRAs generally increased with age        most of those limits (see the table to the right).
      and income.                                                                                                   Percentage of
                                                             The percentage-of-compensation limits were             Compensation               25                       100
      Overall participation in some form of tax-favored      increased immediately by that act for 401(k)-type
                                                             plans; they were already at 100 percent for IRAs.      Dollar Amount
      retirement plan was nearly the same in 1997, 2000,                                                              Under age 50        12,000    a
                                                                                                                                                                   15,000
      2003, and 2006—within 1 percentage point of            The dollar limits were increased according to a                                        a
                                                                                                                      Age 50 or older     12,000                   20,000
      51 percent. The 52 percent participation rate for      schedule (over five years for 401(k)-type plans and
      2006 represented an increase of 2 percentage           over seven years for IRAs) and now are indexed for                                         IRA (Dollars)
      points over the rate for 2003, and the change was      inflation. Unlike most other aspects of EGTRRA,        Traditional
                                                             the higher contribution limits are not scheduled to      Under age 50         2,000                      4,000
      fairly uniform across age groups and income ranges
                                                             expire after 2012—they were made permanent by            Age 50 or older      2,000                      5,000
      and according to marital or earner status. Between
      2003 and 2006, participation in 401(k)-type plans      the Pension Protection Act of 2006.                    Roth
      and IRAs did not change, and participation solely                                                               Under age 50         2,000                      4,000
                                                             Contribution limits affect the extent to which
      in noncontributory plans increased by 1 percentage                                                              Age 50 or older      2,000                      5,000
                                                             certain types of expansions in tax incentives for
      point.                                                 retirement savings increase private saving. Partici-
                                                                                                                    Source: Congressional Budget Office.
      Average contributions to all types of plans            pants whose contributions fall below a limit would
                                                             not have any incentive to save more if the limit was   Note: EGTRRA = Economic Growth and Tax Relief
      increased in real (inflation-adjusted) terms between                                                                Reconciliation Act of 2001; IRA = individual
      2003 and 2006, reflecting mostly the scheduled         raised: Under current law, they could receive a
                                                                                                                          retirement account.
      increases in the maximum contribution under            larger tax benefit by saving more, but they choose
                                                             not to. In contrast, participants who contribute the   a. The contribution limits under pre-EGTRRA law are
      EGTRRA. Changes in average contributions in                                                                      estimated on the basis of inflation since 2001.
      excess of income growth might not indicate any         maximum amount allowed under current law
      change in the overall saving rate; instead, the dif-   would have an incentive to save more if the limit
                                                             was raised, and they might choose to save more.        the percentage of participants who might be
      ferences in average contributions might reflect the                                                           induced to save more if the limits were raised.
      shifting of assets between taxable and tax-favored     Thus, the percentage of participants who already
      accounts. CBO did not attempt to identify what         contribute the maximum amounts allowed (that is,       Five percent of participants in 401(k)-type plans in
      proportion of higher average contributions should      the percentage who are constrained by the current      2006 contributed up to the limits established by
                                                             contribution limits) represents an upper bound on      EGTRRA. Twelve percent contributed amounts


CBO
INTRODUCTION                                                                                                          USE OF TAX INCENTIVES FOR RETIREMENT SAVING IN 2006   3


      equal to or greater than the pre-EGTRRA limits        The saver’s credit is nonrefundable, meaning that it
      and presumably would have made the maximum            cannot exceed a taxpayer’s income tax liability.         Saver’s Credit Rates and Income
      allowable contributions in the absence of             Thus, workers without any income tax liability
      EGTRRA. Therefore, EGTRRA reduced the                 cannot claim the credit, even if they make qualify-
                                                                                                                     Ranges, 2003 and 2006
      proportion of participants who were constrained       ing contributions. The saver’s credit originally was     (Dollars)
      by the contribution limits for 401(k)-type plans by   scheduled to expire after 2006, but it was made          Rate of Credit              Income Range
      7 percentage points. For traditional IRAs,            permanent (and the top threshold was indexed for                          Single or Married Filing Separately
      EGTRRA reduced the proportion of participants         inflation) by the Pension Protection Act of 2006.
                                                                                                                     50 Percent                    0 to 14,999
      constrained by the contribution limits in 2006                                                                 20 Percent                  15,000 to 16,249
      from 73 percent to 52 percent, a decline of 21 per-   In 2006, 25 percent of all workers who filed tax
                                                                                                                     10 Percent                  16,250 to 24,999
      centage points; for Roth IRAs, the corresponding      returns were eligible to take the saver’s credit (down
      proportions were 62 percent and 39 percent, for a     from 30 percent in 2003) on the basis of their                                    Married Filing Jointly
      decline of 23 percentage points.                      income and tax liability. Only 20 percent of those       50 Percent                    0 to 29,999
                                                            eligible actually contributed to a retirement            20 Percent                  30,000 to 33,499
                                                            account (down slightly from 21 percent in 2003),         10 Percent                  33,500 to 49,999
      The Saver’s Credit                                    and 65 percent of those who contributed claimed
                                                                                                                                          Filing as Head of Household
      The saver’s credit was introduced by EGTRRA           the credit (up from 59 percent in 2003).
                                                                                                                     50 Percent                    0 to 22,499
      to encourage retirement saving by providing tax                                                                20 Percent                  22,500 to 24,374
                                                            Taxpayers whose income was low enough to qual-
      credits to qualifying taxpayers whose adjusted                                                                 10 Percent                  24,375 to 37,499
                                                            ify for the top credit rate (50 percent) were the
      gross income falls below particular thresholds.
                                                            least likely either to make qualifying contributions
      To qualify, a worker must contribute either to a                                                               Source: Congressional Budget Office.
                                                            or to claim the credit if they did. Those whose
      401(k)-type plan or to an IRA. The rate of the                                                                 Note: The income ranges refer to adjusted gross
                                                            income placed them in the lowest bracket (10 per-
      credit is determined by a worker’s adjusted gross                                                                    income.
                                                            cent) were the most likely to make qualifying
      income and filing status, and it is applied to the
                                                            contributions and to claim the credit. The average
      first $2,000 of qualifying contributions (see the
                                                            amount of the credit was $156.
      table to the right).


CBO
Participation Rates and Contributions


CBO
PARTICIPATION RATES AND CONTRIBUTIONS                                                                                     USE OF TAX INCENTIVES FOR RETIREMENT SAVING IN 2006   5


      Exhibit 1.
                                                                                                                            In 2006, 52 percent of U.S. workers partici-
      Participation in Tax-Favored Retirement Plans, 2003 and 2006                                                          pated in some sort of tax-favored retirement
                                                                                                                            plan. That rate was 2 percentage points higher
                                                  2003                                           2006                       than the overall participation rate in 2003. In
                                   Number of               Percentage             Number of              Percentage         both 2003 and 2006, participation rates varied
                                    Workers              Participating in          Workers              Participating in    widely by age, income, and marital and earner
                                    (Millions)              Any Plana              (Millions)              Any Plan a       status.
                                                                     Age Group (Years)
      Under 30                         38.9                     32                    41.8                     33           Participation increased with age—but only to
      30 to 44                         48.8                     56                    49.6                     57           age 60. In 2006, the participation rate among
      45 to 59                         39.8                     63                    44.7                     64           workers under 30 was 33 percent. The rate was
      60 or Older                      13.3
                                     _____                      44                    13.5
                                                                                    _____                      45           57 percent among 30- to 44-year-olds and
           All Ages                  140.8                      50                  149.6                     52            64 percent among 45- to 59-year-olds. Only
                                                                                                                            45 percent of workers age 60 or older partici-
                                                                                             b
                                                             Income Range (2006 dollars)                                    pated, probably because that group includes
      Under $20,000                    38.8                     17                    41.5                     17           workers who are semiretired and are receiving
      $20,000 to $39,999               30.6                     46                    31.9                     47           benefits rather than saving for them.
      $40,000 to $79,999               37.2                     63                    38.6                     65
      $80,000 to $119,999              19.0                     76                    19.8                     77           Participation was lowest among people whose
      $120,000 to $159,999              7.2                     82                     7.9                     81           income was below $20,000—17 percent in
      $160,000 and Above                7.9                     81                     9.9                     81           2006. In each successive income category,
                                     _____                                          _____
                                                                                                                            except the highest, participation was greater. In
           All Income
           Ranges                    140.8                      50                  149.6                     52
                                                                                                                            2006, participation was 81 percent in the
                                                                                                                            highest income range, the same as in the next-
                                                               Marital and Earner Status                                    highest range.
      Unmarried Earners                69.8                     40                   74.8                      41
                                                                                                                            Unmarried workers were less likely than
      Married Earners
                                                                                                                            married workers to participate in some kind
        Sole                           21.2                     52                    20.0                     52
        Primary                        24.9                     72                    27.4                     74
                                                                                                                            of tax-favored plan. Participation was lower
        Secondary                      24.9                     57                    27.4                     57           (41 percent in 2006) among unmarried people
                                     _____                                          _____
                                                                                                                            than among primary (higher) earners (74 per-
           All Earners               140.8                      50                  149.6                     52
                                                                                                                            cent) or secondary (lower) earners (57 percent)
      Nonearning Spouses               21.2                      6                   20.0                       7           in two-earner families or among sole earners in
                                                                                                                            one-earner married couples (52 percent). 
      Source: Congressional Budget Office tabulations of a sample of 2003 and 2006 individual income tax returns and
              tax information returns.
      a. Participation consists of either enrolling in a noncontributory plan or contributing to an individual retirement
         account; a 401(k)-type plan; or a self-employment SEP (simplified employee pension), SIMPLE (Savings
         Incentive Match Plan for Employees), or other qualified plan.
      b. The income ranges refer to adjusted gross income plus excluded contributions to retirement plans minus
CBO      taxable distributions from individual retirement accounts.
PARTICIPATION RATES AND CONTRIBUTIONS                                                                                        USE OF TAX INCENTIVES FOR RETIREMENT SAVING IN 2006   6


      Exhibit 2.
                                                                                                                               In 2006, 47 percent of workers participated in
      Participation of Wage Earners in Employment-Based                                                                        employment-based retirement plans, account-
                                                                                                                               ing for more than 90 percent of those who par-
      Retirement Plans, 2003 and 2006                                                                                          ticipated in any tax-favored plan. The largest
      (Percentage of all workers)                                                                                              group (29 percent of all workers) contributed
                                                                                                                               to a 401(k)-type plan; 18 percent of workers
                                                   2003                                             2006
                                                                    Any                                              Any
                                                                                                                               were enrolled in a noncontributory plan only.
                              401(k)-Type     Noncontributory   Employment-    401(k)-Type     Noncontributory   Employment-   The patterns of participation in 401(k)-type
                                 Plana          Plan Onlyb       Based Plan       Plana          Plan Onlyb       Based Plan   plans—by age, income, and marital and earner
                                                                     Age Group (Years)                                         status—were similar to those for all tax-
       Under 30                   14                16               30             16               15              31        favored retirement plans. Participation was
       30 to 44                   34                18               52             34               20              54        greater among workers between the ages of 30
       45 to 59                   38                19               57             39               19              58        and 59 and among workers with annual
       60 or Older                22                15               37             23               15              38        income of $80,000 or more. Participation of
            All Ages              29               17                46             29              18               47
                                                                                                                               married people, regardless of earner status,
                                                                Income Range (2006 dollars)c                                   outstripped that of unmarried people.
       Under $20,000               4                10               15              5               11              16        Rates of participation in noncontributory
       $20,000 to $39,999         21                21               43             23               21              44        plans only were fairly uniform among the vari-
       $40,000 to $79,999         37                22               58             38               22              61        ous groups. Participation was highest among
       $80,000 to $119,999        51                19               70             50               21              71        30- to 44-year-old workers (20 percent), simi-
       $120,000 to $159,999       58                16               74             58               17              74
                                                                                                                               lar to that among 45- to 59-year-old workers
       $160,000 and Above         57                13               69             56               14              70
                                                                                                                               (19 percent). Participation peaked at 22 per-
            All Income
                                                                                                                               cent among workers earning between $40,000
            Ranges                29               17                46             29              18               47
                                                                                                                               and $79,999 per year, although the rate was
                                                                 Marital and Earner Status                                     almost the same (21 percent) among workers
       Unmarried Earners          21                16               37             22               16              38        earning between $20,000 and $39,999 and
       Married Earners                                                                                                         workers earning between $80,000 and
         Sole                     30                17               46             30               17              47        $119,999. There were only small differences in
         Primary                  47                20               67             48               20              69        participation among groups by marital and
         Secondary                31                19               50             31               20              51        earner status.
            All Earners           29               17                46             29              18               47
                                                                                                                               Because the available data sources do not
      Source: Congressional Budget Office tabulations of a sample of 2003 and 2006 individual income tax returns and           contain enough information to identify people
              tax information returns.                                                                                         who participated in 401(k)-type and non-
                                                                                                                               contributory plans simultaneously, such
      a. Participation consists of contributing to a 401(k)-type plan during the given year.
                                                                                                                               participants were counted in the 401(k)-type
      b. Participation consists of being enrolled in a noncontributory plan during the given year, while not contributing      group only. Results for workers who partici-
         to a 401(k)-type plan.                                                                                                pated in a noncontributory plan alone may not
CBO c. The income ranges refer to adjusted gross income plus excluded contributions to retirement plans minus                  reflect the patterns for all participants in
          taxable distributions from individual retirement accounts.                                                           noncontributory plans. 
PARTICIPATION RATES AND CONTRIBUTIONS                                                                                USE OF TAX INCENTIVES FOR RETIREMENT SAVING IN 2006   7


      Exhibit 3.
                                                                                                                       Self-employed workers participating in
      Participation of the Self-Employed in Employment-Based                                                           employment-based retirement plans accounted
                                                                                                                       for a much smaller share of participation in
      Retirement Plans, 2003 and 2006                                                                                  tax-favored retirement plans in 2003 or 2006
                                                                                                                       than did wage earners participating in
                                                  2003                                          2006
                                                                                                                       employment-based plans or IRA contributors.
                                                         Percentage of                                 Percentage of
                                                                                                                       Just 1 percent of all U.S. workers fell into the
                                  Percentage of          Self-Employed         Percentage of           Self-Employed
                                   All Workersa             Workersa            All Workersa              Workersa
                                                                                                                       category of self-employed participants in either
                                                                                                                       year. Among workers with self-employment
                                                                   Age Group (Years)                                   income, the participation rate in employment-
      Under 30                         <1                      1                       <1                    1
                                                                                                                       based retirement plans in both 2003 and 2006
      30 to 44                          1                      7                        1                    6
                                                                                                                       was 8 percent, far below the participation rate
      45 to 59                          2                     12                        2                   11
                                                                                                                       among wage earners.
      60 or Older                       2                      8                        2                   10
           All Ages                      1                     8                        1                    8         Expressed as a percentage of self-employed
                                                            Income Range (2006 dollars)     b                          people, participation was lowest in the under-
                                                                                                                       30 age group (1 percent in 2006) and highest
      Under $20,000                    <1                      1                       <1                    1
                                                                                                                       among 45- to 59-year-old workers (11 per-
      $20,000 to $39,999               <1                      2                       <1                    2
                                                                                                                       cent). Among workers over the age of 59,
      $40,000 to $79,999                1                      6                       <1                    5
      $80,000 to $119,999               1                     13                        1                   11
                                                                                                                       however, the rate of participation dropped
      $120,000 to $159,999              3                     24                        2                   19         back to 10 percent. Unmarried earners were
      $160,000 and Above                7                     38                        7                   36         less likely (4 percent) than married workers to
           All Income Ranges             1                     8                        1                    8         participate; within married couples, primary
                                                                                                                       earners had the highest rate of participation
                                                              Marital and Earner Status                                (13 percent). 
      Unmarried Earners                <1                      4                       <1                    4
      Married Earners
        Sole                              1                    8                        1                    8
        Primary                           2                   15                        2                   13
        Secondary                         1                   10                        1                    9
           All Earners                   1                     8                        1                    8

      Source: Congressional Budget Office tabulations of a sample of 2003 and 2006 individual income tax returns and
              tax information returns.
      Note: Self-employed workers are those who file Schedule SE.
      a. Participation consists of reporting a contribution to a self-employment SEP (simplified employee pension),
         SIMPLE (Savings Incentive Match Plan for Employees), or other qualified plan.
      b. The income ranges refer to adjusted gross income plus excluded contributions to retirement plans minus
         taxable distributions from individual retirement accounts.
CBO
PARTICIPATION RATES AND CONTRIBUTIONS                                                                                                 USE OF TAX INCENTIVES FOR RETIREMENT SAVING IN 2006   8


      Exhibit 4.
                                                                                                                                        Rates of participation in employment-based
      Participation of the Self-Employed and Wage Earners in                                                                            retirement plans among the self-employed in
      Employment-Based Retirement Plans, by Income Range, 2006                                                                          2006 differed markedly by participants’ annual
                                                                                                                                        income, from 1 percent in the under-$20,000
                                                                                                                                        group to 36 percent in the group earning
                                 1
            Under $20,000
                                                          18
                                                                                                                                        $160,000 or more. That pattern contrasts with
                                                                                                                                        participation among wage earners, for whom
                                     2
        $20,000 to $39,999                                                                                                              the rate was relatively flat in all income groups
                                                                                         46
                                                                                                                                        above $80,000 and actually slightly lower in
                                         5                                                                                              the highest income group than in the second-
        $40,000 to $79,999
                                                                                                            63
                                                                                                                                        highest income group.
                                                  11
       $80,000 to $119,999
                                                                                                                       74               Despite that difference in the pattern of partic-
                                                           19                                                                           ipation across income groups, participation
      $120,000 to $159,999                                                                                                  78          among wage earners was higher than among
                                                                             36                                                         self-employed people in every income group.
       $160,000 and Above                                                                                                               Overall, half of all wage earners and 8 percent
                                                                                                                         76
                                             8
                                                                                                                                        of self-employed people participated in an
         All Income Ranges                                                                                                              employment-based plan in 2006. (Unlike
                                                                                               50
                                                                                                                                        Exhibit 2, this exhibit shows participation
                             0               10           20         30           40          50       60        70           80   90   rates for wage earners calculated as a percent-
                                                                                                                                        age of wage earners, not as a percentage of all
                                                       Percentage of the Self-Employed              Percentage of Wage Earners          workers.) 

      Source: Congressional Budget Office tabulations of a sample of 2006 individual income tax returns and tax
              information returns.
      Notes: Figures for wage earners are not comparable to those in Exhibit 2 because that exhibit calculates
             participation as a percentage of all workers, not as a percentage of wage earners.
             The income ranges refer to adjusted gross income plus excluded contributions to retirement plans minus
             taxable distributions from individual retirement accounts.


CBO
PARTICIPATION RATES AND CONTRIBUTIONS                                                                                  USE OF TAX INCENTIVES FOR RETIREMENT SAVING IN 2006   9


      Exhibit 5.
                                                                                                                         Only 7 percent of workers contributed to an
      IRA Participation, 2003 and 2006                                                                                   individual retirement account in 2003 or in
                                                                                                                         2006—a far lower percentage than partici-
      (Percentage of all workers)                                                                                        pated in employment-based retirement plans
                                                     2003                                        2006                    in either year. Participation was 4 percent in
      Category                     Traditional IRA   Roth IRA      Any IRA     Traditional IRA   Roth IRA      Any IRA   2003 and 3 percent in 2006 for traditional
                                                                     Age Group (Years)                                   IRAs and 4 percent in both years for Roth
      Under 30                           1              3             4              1              3             4      IRAs. (A small number of people contributed
      30 to 44                           3              4             7              3              4             7      to both types in the same year.)
      45 to 59                           6              5            10              6              5            10
                                                                                                                         In 2006, overall participation in IRAs was
      60 to 70                           9              3            11              8              3            11
                                                                                                                         highest (11 percent) among workers between
      71 or Older                      n.a.             3             3            n.a.             2             2
           All Ages                      4              4             7              3              4             7      the ages of 60 and 70. People over the age of
                                                                                                                         70½ cannot contribute to traditional IRAs, so
                                                                Income Range (2006 dollars) a                            the overall IRA participation rate among work-
      Under $20,000                      1              1             2              1               1            2      ers who were 71 or older was only 2 percent
      $20,000 to $39,999                 3              2             5              3               3            5      that year. Participation in traditional IRAs was
      $40,000 to $79,999                 5              4             9              4               5            9      lowest among those under age 30 and highest
      $80,000 to $119,999                5              7            12              4               8           12      among people between the ages of 60 and 70.
      $120,000 to $159,999               6             10            15              6             10            15      Participation in Roth IRAs peaked at 5 percent
      $160,000 and Above                10              3            13             10            n.a.           10      among people between the ages of 45 and 59.
           All Income Ranges             4              4             7              3              4             7      Younger workers were more likely to partici-
                                                                  Marital and Earner Status
                                                                                                                         pate in a Roth IRA (3 percent under the age
                                                                                                                         of 30 did so) than in a traditional IRA (just
      Unmarried Earners                   2             3             5              2              3             5      1 percent participated). In contrast, the partic-
      Married Earners                                                                                                    ipation rate in traditional IRAs among people
        Sole                              5             3             8              4              4             8
                                                                                                                         in the 60- to 70-year-old group was 8 percent,
        Primary                           5             5            10              5              5            10
                                                                                                                         more than twice that for Roth IRAs
        Secondary                         5             5            10              5              5            10
           All Earners                   4              4             7              3              4             7
                                                                                                                         (3 percent).

      Nonearning Spousesb                 4             2             6              4              3             7      There was little difference in participation
                                                                                                                         among groups by marital and earner status.
      Source: Congressional Budget Office tabulations of a sample of 2003 and 2006 individual income tax returns and     Ten percent of members of two-earner house-
              tax information returns.                                                                                   holds contributed to IRAs—5 percent to each
                                                                                                                         type—regardless of whether they were the
      Note: IRA = individual retirement account; n.a. = not applicable.                                                  primary or secondary earner. 
      a. The income ranges refer to adjusted gross income plus excluded contributions to retirement plans minus
         taxable distributions from IRAs.
      b. Participation is calculated as a percentage of all nonearning spouses, not as a percentage of all workers.

CBO
PARTICIPATION RATES AND CONTRIBUTIONS                                                                                USE OF TAX INCENTIVES FOR RETIREMENT SAVING IN 2006   10


      Exhibit 6.
                                                                                                                       Participation in traditional and Roth IRAs
      IRA Participation, by Income Range, 2006                                                                         generally rose with income in 2006. However,
                                                                                                                       the increase was somewhat greater for Roth
      (Percentage of all workers)                                                                                      than for traditional IRAs.
                                     1
             Under $20,000
                                     1                                                                                 At the lower end of the income scale, partici-
                                                                                                                       pation in traditional and Roth IRAs was
                                                    3
        $20,000 to $39,999                                                                                             similar—1 percent for those with income
                                                    3
                                                                5
                                                                                                                       under $20,000 and 3 percent for people whose
        $40,000 to $79,999                                                                                             income was between $20,000 and $39,999. At
                                                           4
                                                                                            8                          higher income ranges, up to $160,000, how-
       $80,000 to $119,999
                                                           4                                                           ever, participation was higher for Roth IRAs
                                                                                                     10                than for traditional IRAs. In the $120,000-to-
      $120,000 to $159,999
                                                                       6                                               $159,999 range, Roth participation reached a
                             a                                                                                         peak of 10 percent; about 6 percent of people
       $160,000 and Above                                                                            10                in that group participated in a traditional IRA.
                                                           4
          All Income Ranges                                                                                            Although people whose income is above
                                                    3
                                                                                                                       $160,000 cannot contribute to a Roth IRA,
                                 0            2           4           6                     8      10             12   there is no such restriction for traditional IRAs
                                                                                                                       (although contributions may not be deduct-
                                                    Roth IRA              Traditional IRA                              ible). Ten percent of workers in that top
                                                                                                                       income range made contributions (including
      Source: Congressional Budget Office tabulations of a sample of 2006 individual income tax returns and tax
              information returns.
                                                                                                                       nondeductible contributions) to those
                                                                                                                       accounts. 
      Notes: The income ranges refer to adjusted gross income plus excluded contributions to retirement plans minus
             taxable distributions from IRAs.
             IRA = individual retirement account.
      a. Contributions to Roth IRAs are not permitted in this income range.


CBO
PARTICIPATION RATES AND CONTRIBUTIONS                                                                             USE OF TAX INCENTIVES FOR RETIREMENT SAVING IN 2006   11


      Exhibit 7.
                                                                                                                    In 1997, 2000, 2003, and 2006, overall partic-
      Retirement Plan Participation, 1997 to 2006                                                                   ipation in all types of tax-favored retirement
                                                                                                                    plans ranged from 50 percent to 52 percent,
      (Percentage of all workers)                                                                                   with no discernable trend over time. Participa-
       Traditional or Roth IRA                                                                                      tion in employment-based plans for all work-
                        1997           6                                                                            ers—wage earners and the self-employed
                        2000                   8                                                                    alike—ranged from 46 percent to 48 percent,
                        2003               7                                                                        and IRA participation (whether in a traditional
                        2006               7
                                                                                                                    plan or in a Roth plan) ranged from 6 percent
                                                                                                                    to 8 percent. 
      Employment-Based Plan
                        1997                                                               48
                        2000                                                            46
                        2003                                                             47
                        2006                                                               48

          Any Retirement Plan
                        1997                                                                     51
                        2000                                                                    50
                        2003                                                                    50
                        2006                                                                       52

                                 0             10    20           30           40           50           60

      Source: Congressional Budget Office tabulations of a sample of 1997, 2000, 2003, and 2006 individual income
              tax returns and tax information returns.
      Note: IRA = individual retirement account.


CBO
PARTICIPATION RATES AND CONTRIBUTIONS                                                                                      USE OF TAX INCENTIVES FOR RETIREMENT SAVING IN 2006   12


      Exhibit 8.
                                                                                                                             In 2006, workers under the age of 50 could
      Contributions by Wage Earners to 401(k)-Type Plans,                                                                    contribute 100 percent of their compensation,
      2003 and 2006                                                                                                          up to $15,000, to a 401(k) plan; the limit for
                                                                                                                             people age 50 or older was $20,000. The aver-
                                                                                                               Annual        age contribution among all groups was
                                             2003                                      2006                  Percentage      $4,350, and 5 percent of all participants con-
                                          Average    Percentage of                  Average    Percentage of  Change in      tributed the maximum allowable amount.
                              Number of Contribution Participants       Number of Contribution Participants    Average
                             Participants  (2006       Contributing    Participants  (2006      Contributing Contribution,   The higher contribution limits for older work-
      Category                (Millions)  dollars)    the Maximum       (Millions)  dollars)    the Maximum 2003–2006a       ers may be partly responsible for the fact that
                                                                     Age Group (Years)                                       those groups contributed the most to 401(k)-
      Under 30                   5.6        2,140           1               6.6           1,950      1            -3         type plans. But even workers between the ages
      30 to 44                  16.6        3,860           6              16.9           3,990      5             1         of 30 and 44 made substantially higher average
      45 to 59                  15.1        4,900           6              17.8           5,340      6             3         contributions ($3,990) than did workers
      60 or Older                2.9
                               ____         4,750           5               3.1
                                                                          ____            5,910      6             8         under the age of 30 ($1,950). The two groups
           All Ages            40.3         4,070           5             44.1           4,350       5            2          with members subject to higher limits made
                                                                Income Range (2006 dollars)  b                               the largest average contributions—$5,340 for
                                                                                                                             people between the ages of 45 and 59, and
      Under $20,000              1.7          720         <1                2.1             670     <1           -2
      $20,000 to $39,999         6.5        1,320         <1                7.4           1,290     <1           -1          $5,910 for people age 60 or older. Contribu-
      $40,000 to $79,999        13.7        2,820          1               14.7           2,810      1          >-1          tions also grew fastest among older workers;
      $80,000 to $119,999        9.7        4,570          3                9.4           4,720      2            1          average real (inflation-adjusted) contributions
      $120,000 to $159,999       4.2        6,700          8                4.6           7,050      7            2          from people in the 60-or-older group increased
      $160,000 and Above         4.5
                               ____         9,550         28                5.6
                                                                          ____           11,000     27            5          by an average of 8 percent per year over the
           All Income                                                                                                        three-year period.
           Ranges              40.3         4,070           5             44.1           4,350       5            2
                                                                                                                             The association between the average contribu-
                                                                 Marital and Earner Status                                   tion and income also was strong. The average
      Unmarried Earners         14.5        3,170           3              16.4           3,210      3           <1          contribution in 2006 was $670 for people
      Married Earners                                                                                                        whose income was below $20,000; people
        Sole                     6.3        5,240           8               6.0           5,940      9             4         making more than $160,000 contributed an
        Primary                 11.8        4,990           7              13.3           5,430      6             3         average of $11,000.
        Secondary                7.7
                               ____         3,400           3               8.4
                                                                          ____            3,750      4             3
           All Earners         40.3         4,070           5             44.1           4,350       5            2          In 2006, the average contribution of a working
                                                                                                                             spouse in a one-earner family ($5,940) was the
      Source: Congressional Budget Office tabulations of a sample of 2003 and 2006 individual income tax returns and         highest among the various groups by marital
              tax information returns.                                                                                       and earner status. Within two-earner couples,
      a. Average change, adjusted for inflation.                                                                             the primary earner contributed an average of
                                                                                                                             $5,430, and the secondary earner contributed
      b. The income ranges refer to adjusted gross income plus excluded contributions to retirement plans minus
                                                                                                                             an average of $3,750. Unmarried workers
         taxable distributions from individual retirement accounts.
                                                                                                                             contributed the least, averaging $3,210. 
CBO
PARTICIPATION RATES AND CONTRIBUTIONS                                                                                      USE OF TAX INCENTIVES FOR RETIREMENT SAVING IN 2006   13


      Exhibit 9.
                                                                                                                             In 2006, contributions by self-employed
      Contributions by the Self-Employed to Employment-Based                                                                 people to employment-based plans were lim-
      Retirement Plans, 2003 and 2006                                                                                        ited to $44,000. The average contribution was
                                                                                                                             $16,370, and 12 percent of participants con-
                                                                                                               Annual        tributed the statutory maximum amount.
                                             2003                                      2006                  Percentage
                                          Average    Percentage of                  Average    Percentage of  Change in
                                                                                                                             Average contributions by the self-employed
                              Number of Contribution Participants       Number of Contribution Participants    Average       generally increased with age and income.
                             Participants  (2006       Contributing    Participants  (2006      Contributing Contribution,   Among contributors who were age 60 or older,
      Category                (Millions)  dollars)    the Maximum       (Millions)  dollars)    the Maximum 2003–2006a       however, average contributions were about the
                                                                     Age Group (Years)                                       same as they were for people between the ages
      Under 30                 <0.1          8,200          5             <0.1           10,000      10            7         of 45 and 59. Average contributions varied
      30 to 44                  0.4         13,510          9               0.3          15,000      11            4         much more by marital and earner status than
      45 to 59                  0.7         16,040         12               0.7          17,010      13            2         was the case for other types of plans, ranging
      60 or Older               0.2
                               ___          15,340          9               0.3
                                                                           ___           17,020      11            4         from a low of $6,830 for secondary earners in
           All Ages             1.3        14,990         10               1.3           16,370     12            3          two-earner couples to a high of $23,340 for
                                                                Income Range (2006 dollars)b
                                                                                                                             sole earners in one-earner couples.
      Under $20,000            <0.1          3,390          4             <0.1            3,090       6           -3         Average real (inflation-adjusted) contributions
      $20,000 to $39,999         0.1         4,360        <1                0.1           4,260       1           -1         to employment-based plans by self-employed
      $40,000 to $79,999         0.2         6,150          4               0.2           6,150       3          <1          people increased by about 3 percent per year
      $80,000 to $119,999        0.2         8,800          1               0.2           8,220       3           -2
                                                                                                                             between 2003 and 2006. Although the limit
      $120,000 to $159,999       0.2        10,010          4               0.2          11,390       3            4
      $160,000 and Above         0.6        23,680         20               0.7          24,090      20            1
                                                                                                                             on contributions was virtually unchanged in
                                ___                                        ___                                               real terms over the period, the proportion of
           All Income
                                                                                                                             workers constrained by the limit increased
           Ranges               1.3        14,990         10               1.3           16,370     12            3
                                                                                                                             from 10 percent to 12 percent. 
                                                                 Marital and Earner Status
      Unmarried Earners          0.3        15,890         11               0.3          15,740      10         >-1
      Married Earners
        Sole                     0.3        20,380         17               0.3          23,340      20            5
        Primary                  0.4        17,820         11               0.4          19,540      13            3
        Secondary                0.3
                                ___          6,070          4               0.3
                                                                           ___            6,830       5            4
           All Earners          1.3        14,990         10               1.3           16,370     12            3


      Source: Congressional Budget Office tabulations of a sample of 2003 and 2006 individual income tax returns and
              tax information returns.
      a. Average change, adjusted for inflation.
      b. The income ranges refer to adjusted gross income plus excluded contributions to retirement plans minus
         taxable distributions from individual retirement accounts.

CBO
PARTICIPATION RATES AND CONTRIBUTIONS                                                                                        USE OF TAX INCENTIVES FOR RETIREMENT SAVING IN 2006   14


      Exhibit 10.
                                                                                                                               In 2006, contributions to traditional IRAs
      Contributions to Traditional IRAs, 2003 and 2006                                                                         were limited to $4,000 for people under the
                                                                                                                               age of 50 and $5,000 for people who were 50
                                                                                                                  Annual       or older. For someone with an employment-
                                             2003                                       2006                    Percentage     based plan (or whose spouse had access to such
                                          Average    Percentage of                   Average    Percentage of    Change in
                                                                                                                               a plan), the deductible amount depended on
                              Number of Contribution Participants        Number of Contribution Participants      Average
                             Participants  (2006       Contributing     Participants  (2006       Contributing Contribution,
                                                                                                                               income. This exhibit shows deductible and
      Category                (Millions)  dollars)    the Maximum        (Millions)  dollars)    the Maximum 2003–2006a        nondeductible contributions combined.
                                                                      Age Group (Years)                                        The average contribution to traditional IRAs
      Under 30                   0.4        1,690          38                0.4          1,770       28              2        in 2006 was $2,840, and 52 percent of partici-
      30 to 44                   1.4        2,080          55                1.4          2,360       52              4        pants contributed the statutory maximum.
      45 to 59                   2.5        2,530          58                2.6          3,070       55              7        Although average real (inflation-adjusted)
      60 to 70                   0.8        2,796          57                0.8          3,570       57              8
                                                                                                                               contributions increased by approximately
      71 or Older               n.a.
                                ___           n.a.        n.a.              n.a.
                                                                            ___             n.a.     n.a.          n.a.
                                                                                                                               6 percent per year from 2003 to 2006, the
           All Ages             5.2         2,370         55                5.2           2,840       52             6
                                                                                                                               maximum allowable contribution rose much
                                                                 Income Range (2006 dollars)  b
                                                                                                                               more, so the percentage contributing the maxi-
      Under $20,000              0.3        1,810          26                0.4          1,920       21             2         mum dropped from 55 percent to 52 percent.
      $20,000 to $39,999         1.0        1,990          33                0.8          2,180       25             3
      $40,000 to $79,999         1.8        2,270          45                1.7          2,620       40             5         Because so many IRA contributors were con-
      $80,000 to $119,999        0.9        2,360          66                0.9          2,850       59             6         strained by the limits, there was much less
      $120,000 to $159,999       0.4        2,680          75                0.4          3,320       74             7         variation in average amounts by income range
      $160,000 and Above         0.8
                                ___         3,180          92                1.0
                                                                            ___           3,920       92             7         than was the case for 401(k)-type plans. The
           All Income                                                                                                          average in 2006 for the under-$20,000 range
           Ranges               5.2         2,370         55                5.2           2,840       52             6         ($1,920) was not quite half that ($3,920) con-
                                                                  Marital and Earner Status
                                                                                                                               tributed by the group earning $160,000 or
                                                                                                                               more. In contrast, the average contribution to
      Unmarried Earners          1.7        2,160          49                1.7          2,600       46             6
                                                                                                                               a 401(k)-type plan in the highest income range
      Married Earners
        Sole                     1.0        2,630          60                0.9          3,140       58             6         exceeded the average contribution in the low-
        Primary                  1.2        2,450          56                1.3          2,860       53             5         est by a factor of more than 16 (see Exhibit 8).
        Secondary                1.3
                                ___         2,380          57                1.4
                                                                            ___           2,940       55             7
                                                                                                                               Average contributions varied much less accord-
           All Earners          5.2         2,370         55                5.2           2,840       52             6
                                                                                                                               ing to marital and earner status than they did
      Nonearning Spouses         0.9        2,720          66                0.8          3,290       64             7         for other characteristics or among contributors
                                                                                                                               to 401(k)-type plans. Unmarried people con-
      Source: Congressional Budget Office tabulations of a sample of 2003 and 2006 individual income tax returns and           tributed the least—about $2,600, on average,
              tax information returns.                                                                                         in 2006. Contributions from the sole earner in
      Note: IRA = individual retirement account; n.a. = not applicable.                                                        one-earner couples averaged $3,140; their
      a. Average change, adjusted for inflation.                                                                               nonearning spouses contributed the most:
                                                                                                                               $3,290, on average. 
      b. The income ranges refer to adjusted gross income plus excluded contributions to retirement plans minus
CBO      taxable distributions from IRAs.
Use of Tax Incentives for Retirement Saving in 2006

Weitere ähnliche Inhalte

Was ist angesagt?

CBO's 2010 Long-Term Projections for Social Security: Chartbook
CBO's 2010 Long-Term Projections for Social Security: ChartbookCBO's 2010 Long-Term Projections for Social Security: Chartbook
CBO's 2010 Long-Term Projections for Social Security: ChartbookCongressional Budget Office
 
Trends in Operation and Maintenance Spending by the Department of Defense
Trends in Operation and Maintenance Spending by the Department of DefenseTrends in Operation and Maintenance Spending by the Department of Defense
Trends in Operation and Maintenance Spending by the Department of DefenseCongressional Budget Office
 
Choices for Federal Spending and Taxes: CBO Director Doug Elmendorf's Goldman...
Choices for Federal Spending and Taxes: CBO Director Doug Elmendorf's Goldman...Choices for Federal Spending and Taxes: CBO Director Doug Elmendorf's Goldman...
Choices for Federal Spending and Taxes: CBO Director Doug Elmendorf's Goldman...Congressional Budget Office
 
Communicating Uncertainty in Budgetary and Economic Estimates
Communicating Uncertainty in Budgetary and Economic EstimatesCommunicating Uncertainty in Budgetary and Economic Estimates
Communicating Uncertainty in Budgetary and Economic EstimatesCongressional Budget Office
 
Charts from CBO's January 2012 Budget and Economic Outlook
Charts from CBO's January 2012 Budget and Economic OutlookCharts from CBO's January 2012 Budget and Economic Outlook
Charts from CBO's January 2012 Budget and Economic OutlookCongressional Budget Office
 
The 2013 Long-Term Projections for Social Security: Additional Information
The 2013 Long-Term Projections for Social Security: Additional InformationThe 2013 Long-Term Projections for Social Security: Additional Information
The 2013 Long-Term Projections for Social Security: Additional InformationCongressional Budget Office
 
Charts from CBO's Budget and Economic Outlook: An Update
Charts from CBO's Budget and Economic Outlook: An UpdateCharts from CBO's Budget and Economic Outlook: An Update
Charts from CBO's Budget and Economic Outlook: An UpdateCongressional Budget Office
 
CBO Director Doug Elmendorf's Presentation to the National Economists Club
CBO Director Doug Elmendorf's Presentation to the National Economists ClubCBO Director Doug Elmendorf's Presentation to the National Economists Club
CBO Director Doug Elmendorf's Presentation to the National Economists ClubCongressional Budget Office
 
The Status of Federal Housing Assistance for Low-Income Households
The Status of Federal Housing Assistance for Low-Income HouseholdsThe Status of Federal Housing Assistance for Low-Income Households
The Status of Federal Housing Assistance for Low-Income HouseholdsCongressional Budget Office
 
Approaches to Reducing Federal Spending on Military Pay and Benefits
Approaches to Reducing Federal Spending on Military Pay and BenefitsApproaches to Reducing Federal Spending on Military Pay and Benefits
Approaches to Reducing Federal Spending on Military Pay and BenefitsCongressional Budget Office
 
Coverage Effects of Limiting the Tax Exclusion for Employment-Based Health In...
Coverage Effects of Limiting the Tax Exclusion for Employment-Based Health In...Coverage Effects of Limiting the Tax Exclusion for Employment-Based Health In...
Coverage Effects of Limiting the Tax Exclusion for Employment-Based Health In...Congressional Budget Office
 

Was ist angesagt? (20)

Trends in Federal Tax Revenues and Rates
Trends in Federal Tax Revenues and RatesTrends in Federal Tax Revenues and Rates
Trends in Federal Tax Revenues and Rates
 
Overview of the Federal Budget
Overview of the Federal BudgetOverview of the Federal Budget
Overview of the Federal Budget
 
CBO's 2010 Long-Term Projections for Social Security: Chartbook
CBO's 2010 Long-Term Projections for Social Security: ChartbookCBO's 2010 Long-Term Projections for Social Security: Chartbook
CBO's 2010 Long-Term Projections for Social Security: Chartbook
 
Trends in Operation and Maintenance Spending by the Department of Defense
Trends in Operation and Maintenance Spending by the Department of DefenseTrends in Operation and Maintenance Spending by the Department of Defense
Trends in Operation and Maintenance Spending by the Department of Defense
 
Federal Investment
Federal InvestmentFederal Investment
Federal Investment
 
Choices for Federal Spending and Taxes: CBO Director Doug Elmendorf's Goldman...
Choices for Federal Spending and Taxes: CBO Director Doug Elmendorf's Goldman...Choices for Federal Spending and Taxes: CBO Director Doug Elmendorf's Goldman...
Choices for Federal Spending and Taxes: CBO Director Doug Elmendorf's Goldman...
 
Communicating Uncertainty in Budgetary and Economic Estimates
Communicating Uncertainty in Budgetary and Economic EstimatesCommunicating Uncertainty in Budgetary and Economic Estimates
Communicating Uncertainty in Budgetary and Economic Estimates
 
Charts from CBO's January 2012 Budget and Economic Outlook
Charts from CBO's January 2012 Budget and Economic OutlookCharts from CBO's January 2012 Budget and Economic Outlook
Charts from CBO's January 2012 Budget and Economic Outlook
 
The 2013 Long-Term Projections for Social Security: Additional Information
The 2013 Long-Term Projections for Social Security: Additional InformationThe 2013 Long-Term Projections for Social Security: Additional Information
The 2013 Long-Term Projections for Social Security: Additional Information
 
Charts from CBO's Budget and Economic Outlook: An Update
Charts from CBO's Budget and Economic Outlook: An UpdateCharts from CBO's Budget and Economic Outlook: An Update
Charts from CBO's Budget and Economic Outlook: An Update
 
The Economic Outlook and Fiscal Policy Choices
The Economic Outlook and Fiscal Policy ChoicesThe Economic Outlook and Fiscal Policy Choices
The Economic Outlook and Fiscal Policy Choices
 
CBO’s Analysis of Health Care Policy
CBO’s Analysis of Health Care PolicyCBO’s Analysis of Health Care Policy
CBO’s Analysis of Health Care Policy
 
Shifting Priorities in the Federal Budget
Shifting Priorities in the Federal BudgetShifting Priorities in the Federal Budget
Shifting Priorities in the Federal Budget
 
CBO Director Doug Elmendorf's Presentation to the National Economists Club
CBO Director Doug Elmendorf's Presentation to the National Economists ClubCBO Director Doug Elmendorf's Presentation to the National Economists Club
CBO Director Doug Elmendorf's Presentation to the National Economists Club
 
The Status of Federal Housing Assistance for Low-Income Households
The Status of Federal Housing Assistance for Low-Income HouseholdsThe Status of Federal Housing Assistance for Low-Income Households
The Status of Federal Housing Assistance for Low-Income Households
 
Overview of the Federal Budget
Overview of the Federal BudgetOverview of the Federal Budget
Overview of the Federal Budget
 
CBO’s Role in the Legislative Process
CBO’s Role in the Legislative ProcessCBO’s Role in the Legislative Process
CBO’s Role in the Legislative Process
 
Approaches to Reducing Federal Spending on Military Pay and Benefits
Approaches to Reducing Federal Spending on Military Pay and BenefitsApproaches to Reducing Federal Spending on Military Pay and Benefits
Approaches to Reducing Federal Spending on Military Pay and Benefits
 
Coverage Effects of Limiting the Tax Exclusion for Employment-Based Health In...
Coverage Effects of Limiting the Tax Exclusion for Employment-Based Health In...Coverage Effects of Limiting the Tax Exclusion for Employment-Based Health In...
Coverage Effects of Limiting the Tax Exclusion for Employment-Based Health In...
 
How CBO Promotes Integrity in Its Analyses
How CBO Promotes Integrity in Its AnalysesHow CBO Promotes Integrity in Its Analyses
How CBO Promotes Integrity in Its Analyses
 

Andere mochten auch

Hur gör man produkter som människor älskar
Hur gör man produkter som människor älskarHur gör man produkter som människor älskar
Hur gör man produkter som människor älskarKarin Hedin
 
GR8 Conf US: Spock Soup to Nuts
GR8 Conf US: Spock Soup to NutsGR8 Conf US: Spock Soup to Nuts
GR8 Conf US: Spock Soup to Nutszanthrash
 
SEV090114FshBTS_Lo
SEV090114FshBTS_LoSEV090114FshBTS_Lo
SEV090114FshBTS_LoJill Amos
 
Startups and Smalltak - Presented at Smalltalks2014 Córdoba, Argentina
Startups and Smalltak - Presented at Smalltalks2014 Córdoba, ArgentinaStartups and Smalltak - Presented at Smalltalks2014 Córdoba, Argentina
Startups and Smalltak - Presented at Smalltalks2014 Córdoba, Argentinasebastian sastre
 
Making Your Site Printable: Booster Conference
Making Your Site Printable: Booster ConferenceMaking Your Site Printable: Booster Conference
Making Your Site Printable: Booster ConferenceAdrian Roselli
 
Classic Spice Cake Recipe by Log Barn 1912
Classic Spice Cake Recipe by Log Barn 1912Classic Spice Cake Recipe by Log Barn 1912
Classic Spice Cake Recipe by Log Barn 1912Log Barn 1912
 
Digital Marketing is Dead – It takes Experience Marketing to Create Lifetime ...
Digital Marketing is Dead – It takes Experience Marketing to Create Lifetime ...Digital Marketing is Dead – It takes Experience Marketing to Create Lifetime ...
Digital Marketing is Dead – It takes Experience Marketing to Create Lifetime ...Atcom SA
 
Making spirits bright: Deloitte’s 2014 holiday shopping survey
Making spirits bright: Deloitte’s 2014 holiday shopping surveyMaking spirits bright: Deloitte’s 2014 holiday shopping survey
Making spirits bright: Deloitte’s 2014 holiday shopping surveyDeloitte United States
 
How to-cheat-at-content-marketing
How to-cheat-at-content-marketingHow to-cheat-at-content-marketing
How to-cheat-at-content-marketingKevin McGrath
 

Andere mochten auch (9)

Hur gör man produkter som människor älskar
Hur gör man produkter som människor älskarHur gör man produkter som människor älskar
Hur gör man produkter som människor älskar
 
GR8 Conf US: Spock Soup to Nuts
GR8 Conf US: Spock Soup to NutsGR8 Conf US: Spock Soup to Nuts
GR8 Conf US: Spock Soup to Nuts
 
SEV090114FshBTS_Lo
SEV090114FshBTS_LoSEV090114FshBTS_Lo
SEV090114FshBTS_Lo
 
Startups and Smalltak - Presented at Smalltalks2014 Córdoba, Argentina
Startups and Smalltak - Presented at Smalltalks2014 Córdoba, ArgentinaStartups and Smalltak - Presented at Smalltalks2014 Córdoba, Argentina
Startups and Smalltak - Presented at Smalltalks2014 Córdoba, Argentina
 
Making Your Site Printable: Booster Conference
Making Your Site Printable: Booster ConferenceMaking Your Site Printable: Booster Conference
Making Your Site Printable: Booster Conference
 
Classic Spice Cake Recipe by Log Barn 1912
Classic Spice Cake Recipe by Log Barn 1912Classic Spice Cake Recipe by Log Barn 1912
Classic Spice Cake Recipe by Log Barn 1912
 
Digital Marketing is Dead – It takes Experience Marketing to Create Lifetime ...
Digital Marketing is Dead – It takes Experience Marketing to Create Lifetime ...Digital Marketing is Dead – It takes Experience Marketing to Create Lifetime ...
Digital Marketing is Dead – It takes Experience Marketing to Create Lifetime ...
 
Making spirits bright: Deloitte’s 2014 holiday shopping survey
Making spirits bright: Deloitte’s 2014 holiday shopping surveyMaking spirits bright: Deloitte’s 2014 holiday shopping survey
Making spirits bright: Deloitte’s 2014 holiday shopping survey
 
How to-cheat-at-content-marketing
How to-cheat-at-content-marketingHow to-cheat-at-content-marketing
How to-cheat-at-content-marketing
 

Ähnlich wie Use of Tax Incentives for Retirement Saving in 2006

CONGRESS OF THE UNITED STATESCONGRESSIONAL BUDGET OFFICE
CONGRESS OF THE UNITED STATESCONGRESSIONAL BUDGET OFFICECONGRESS OF THE UNITED STATESCONGRESSIONAL BUDGET OFFICE
CONGRESS OF THE UNITED STATESCONGRESSIONAL BUDGET OFFICEAlleneMcclendon878
 
Accounting For Pensions And Postretirement Benefits
Accounting For Pensions And Postretirement BenefitsAccounting For Pensions And Postretirement Benefits
Accounting For Pensions And Postretirement BenefitsStephen Faucher
 
Small Business Retirement Plans
Small Business Retirement PlansSmall Business Retirement Plans
Small Business Retirement Plansmrbeckerphd
 
How CBO Adjusts for Underreporting of Means Tested Transfers in Its Distribut...
How CBO Adjusts for Underreporting of Means Tested Transfers in Its Distribut...How CBO Adjusts for Underreporting of Means Tested Transfers in Its Distribut...
How CBO Adjusts for Underreporting of Means Tested Transfers in Its Distribut...Congressional Budget Office
 
Business.com guide to 401k
Business.com guide to 401kBusiness.com guide to 401k
Business.com guide to 401kBusiness.com
 
Form 14035 Pilot Questionnaire for Governmental Plans Initiative
Form 14035  Pilot Questionnaire for Governmental Plans Initiative Form 14035  Pilot Questionnaire for Governmental Plans Initiative
Form 14035 Pilot Questionnaire for Governmental Plans Initiative taxman taxman
 
IntroductionComment by Exploring Series This is listed as a Head.docx
IntroductionComment by Exploring Series This is listed as a Head.docxIntroductionComment by Exploring Series This is listed as a Head.docx
IntroductionComment by Exploring Series This is listed as a Head.docxvrickens
 
401(k) / IRA Rollover Options
401(k) / IRA Rollover Options401(k) / IRA Rollover Options
401(k) / IRA Rollover OptionsPierre4pc
 
2017 Retirement Plan Contribution Limits and Key Dates
2017 Retirement Plan Contribution Limits and Key Dates2017 Retirement Plan Contribution Limits and Key Dates
2017 Retirement Plan Contribution Limits and Key DatesPhil Zimmerman
 
Shifting the Balance - The Evolution of America's Pension System
Shifting the Balance - The Evolution of America's Pension SystemShifting the Balance - The Evolution of America's Pension System
Shifting the Balance - The Evolution of America's Pension SystemJoanne Kolebar-Sepinsky
 
What are some tax consequences related to a qualified pension plan- (P.docx
What are some tax consequences related to a qualified pension plan- (P.docxWhat are some tax consequences related to a qualified pension plan- (P.docx
What are some tax consequences related to a qualified pension plan- (P.docxloisj1
 
Could the lifetime allowance make a comeback
Could the lifetime allowance make a comebackCould the lifetime allowance make a comeback
Could the lifetime allowance make a comebackHenry Tapper
 
An Overview of CBO’s Microsimulation Tax Model
An Overview of CBO’s Microsimulation Tax ModelAn Overview of CBO’s Microsimulation Tax Model
An Overview of CBO’s Microsimulation Tax ModelCongressional Budget Office
 
DI Comment to FGBased on the recipients of information the cri.docx
DI Comment to FGBased on the recipients of information the cri.docxDI Comment to FGBased on the recipients of information the cri.docx
DI Comment to FGBased on the recipients of information the cri.docxcuddietheresa
 

Ähnlich wie Use of Tax Incentives for Retirement Saving in 2006 (20)

Ch20
Ch20Ch20
Ch20
 
CONGRESS OF THE UNITED STATESCONGRESSIONAL BUDGET OFFICE
CONGRESS OF THE UNITED STATESCONGRESSIONAL BUDGET OFFICECONGRESS OF THE UNITED STATESCONGRESSIONAL BUDGET OFFICE
CONGRESS OF THE UNITED STATESCONGRESSIONAL BUDGET OFFICE
 
Roth 401(K)
Roth 401(K)Roth 401(K)
Roth 401(K)
 
Accounting For Pensions And Postretirement Benefits
Accounting For Pensions And Postretirement BenefitsAccounting For Pensions And Postretirement Benefits
Accounting For Pensions And Postretirement Benefits
 
Small Business Retirement Plans
Small Business Retirement PlansSmall Business Retirement Plans
Small Business Retirement Plans
 
How CBO Adjusts for Underreporting of Means Tested Transfers in Its Distribut...
How CBO Adjusts for Underreporting of Means Tested Transfers in Its Distribut...How CBO Adjusts for Underreporting of Means Tested Transfers in Its Distribut...
How CBO Adjusts for Underreporting of Means Tested Transfers in Its Distribut...
 
Pension Plans
Pension PlansPension Plans
Pension Plans
 
1161E.1-C
1161E.1-C1161E.1-C
1161E.1-C
 
Business.com guide to 401k
Business.com guide to 401kBusiness.com guide to 401k
Business.com guide to 401k
 
Form 14035 Pilot Questionnaire for Governmental Plans Initiative
Form 14035  Pilot Questionnaire for Governmental Plans Initiative Form 14035  Pilot Questionnaire for Governmental Plans Initiative
Form 14035 Pilot Questionnaire for Governmental Plans Initiative
 
IntroductionComment by Exploring Series This is listed as a Head.docx
IntroductionComment by Exploring Series This is listed as a Head.docxIntroductionComment by Exploring Series This is listed as a Head.docx
IntroductionComment by Exploring Series This is listed as a Head.docx
 
Taxation in Pakistan
Taxation in PakistanTaxation in Pakistan
Taxation in Pakistan
 
401(k) / IRA Rollover Options
401(k) / IRA Rollover Options401(k) / IRA Rollover Options
401(k) / IRA Rollover Options
 
2017 Retirement Plan Contribution Limits and Key Dates
2017 Retirement Plan Contribution Limits and Key Dates2017 Retirement Plan Contribution Limits and Key Dates
2017 Retirement Plan Contribution Limits and Key Dates
 
New Pension Rules
New Pension RulesNew Pension Rules
New Pension Rules
 
Shifting the Balance - The Evolution of America's Pension System
Shifting the Balance - The Evolution of America's Pension SystemShifting the Balance - The Evolution of America's Pension System
Shifting the Balance - The Evolution of America's Pension System
 
What are some tax consequences related to a qualified pension plan- (P.docx
What are some tax consequences related to a qualified pension plan- (P.docxWhat are some tax consequences related to a qualified pension plan- (P.docx
What are some tax consequences related to a qualified pension plan- (P.docx
 
Could the lifetime allowance make a comeback
Could the lifetime allowance make a comebackCould the lifetime allowance make a comeback
Could the lifetime allowance make a comeback
 
An Overview of CBO’s Microsimulation Tax Model
An Overview of CBO’s Microsimulation Tax ModelAn Overview of CBO’s Microsimulation Tax Model
An Overview of CBO’s Microsimulation Tax Model
 
DI Comment to FGBased on the recipients of information the cri.docx
DI Comment to FGBased on the recipients of information the cri.docxDI Comment to FGBased on the recipients of information the cri.docx
DI Comment to FGBased on the recipients of information the cri.docx
 

Mehr von Congressional Budget Office

How the Congressional Budget Office Assists Lawmakers
How the Congressional Budget Office Assists LawmakersHow the Congressional Budget Office Assists Lawmakers
How the Congressional Budget Office Assists LawmakersCongressional Budget Office
 
Introduction to the Role of the Congressional Budget Office
Introduction to the Role of the Congressional Budget OfficeIntroduction to the Role of the Congressional Budget Office
Introduction to the Role of the Congressional Budget OfficeCongressional Budget Office
 
CBO’s Work on Health Care and a Call for New Research
CBO’s Work on Health Care and a Call for New ResearchCBO’s Work on Health Care and a Call for New Research
CBO’s Work on Health Care and a Call for New ResearchCongressional Budget Office
 
The Federal Perspective on Coverage of Medications to Treat Obesity: Consider...
The Federal Perspective on Coverage of Medications to Treat Obesity: Consider...The Federal Perspective on Coverage of Medications to Treat Obesity: Consider...
The Federal Perspective on Coverage of Medications to Treat Obesity: Consider...Congressional Budget Office
 
CBO’s Approach to Estimating the Budgetary Effects of the No Surprises Act of...
CBO’s Approach to Estimating the Budgetary Effects of the No Surprises Act of...CBO’s Approach to Estimating the Budgetary Effects of the No Surprises Act of...
CBO’s Approach to Estimating the Budgetary Effects of the No Surprises Act of...Congressional Budget Office
 
The Budget and Economic Outlook for 2024 to 2034: Press Briefing Slides
The Budget and Economic Outlook for 2024 to 2034: Press Briefing SlidesThe Budget and Economic Outlook for 2024 to 2034: Press Briefing Slides
The Budget and Economic Outlook for 2024 to 2034: Press Briefing SlidesCongressional Budget Office
 
The Economic Outlook for 2024 to 2034 in 19 Slides
The Economic Outlook for 2024 to 2034 in 19 SlidesThe Economic Outlook for 2024 to 2034 in 19 Slides
The Economic Outlook for 2024 to 2034 in 19 SlidesCongressional Budget Office
 
Using Multiple Data Sources to Learn About the Race and Ethnicity of Taxpayers
Using Multiple Data Sources to Learn About the Race and Ethnicity of TaxpayersUsing Multiple Data Sources to Learn About the Race and Ethnicity of Taxpayers
Using Multiple Data Sources to Learn About the Race and Ethnicity of TaxpayersCongressional Budget Office
 
Perspectives on the Navy’s 2024 Shipbuilding Plan
Perspectives on the Navy’s 2024 Shipbuilding PlanPerspectives on the Navy’s 2024 Shipbuilding Plan
Perspectives on the Navy’s 2024 Shipbuilding PlanCongressional Budget Office
 
The 2024 Outlook for Navy Shipbuilding: Familiar Plans and Higher Costs
The 2024 Outlook for Navy Shipbuilding: Familiar Plans and Higher CostsThe 2024 Outlook for Navy Shipbuilding: Familiar Plans and Higher Costs
The 2024 Outlook for Navy Shipbuilding: Familiar Plans and Higher CostsCongressional Budget Office
 
Exploring the Effects of Medicaid During Childhood on the Economy and the Budget
Exploring the Effects of Medicaid During Childhood on the Economy and the BudgetExploring the Effects of Medicaid During Childhood on the Economy and the Budget
Exploring the Effects of Medicaid During Childhood on the Economy and the BudgetCongressional Budget Office
 
CBO’s Role and Most Recent Long-Term Budget Projections
CBO’s Role and Most Recent Long-Term Budget ProjectionsCBO’s Role and Most Recent Long-Term Budget Projections
CBO’s Role and Most Recent Long-Term Budget ProjectionsCongressional Budget Office
 
Approaches to Estimating the Noncyclical Rate of Unemployment
 Approaches to Estimating the Noncyclical Rate of Unemployment Approaches to Estimating the Noncyclical Rate of Unemployment
Approaches to Estimating the Noncyclical Rate of UnemploymentCongressional Budget Office
 
CBO’s Analysis of the Long-Term Budgetary Outlook
CBO’s Analysis of the Long-Term Budgetary OutlookCBO’s Analysis of the Long-Term Budgetary Outlook
CBO’s Analysis of the Long-Term Budgetary OutlookCongressional Budget Office
 
Projecting the Effects of U.S. Federal Policies on Electric Vehicle Demand an...
Projecting the Effects of U.S. Federal Policies on Electric Vehicle Demand an...Projecting the Effects of U.S. Federal Policies on Electric Vehicle Demand an...
Projecting the Effects of U.S. Federal Policies on Electric Vehicle Demand an...Congressional Budget Office
 
CBO’s Recent Appeals for New Research to Enhance Its Work for the Congress
CBO’s Recent Appeals for New Research to Enhance Its Work for the CongressCBO’s Recent Appeals for New Research to Enhance Its Work for the Congress
CBO’s Recent Appeals for New Research to Enhance Its Work for the CongressCongressional Budget Office
 
Trends in the Distribution of Household Income From 1979 to 2020
Trends in the Distribution of Household Income From 1979 to 2020Trends in the Distribution of Household Income From 1979 to 2020
Trends in the Distribution of Household Income From 1979 to 2020Congressional Budget Office
 

Mehr von Congressional Budget Office (20)

The Federal Budget and Health Care Policy
The Federal Budget and Health Care PolicyThe Federal Budget and Health Care Policy
The Federal Budget and Health Care Policy
 
How the Congressional Budget Office Assists Lawmakers
How the Congressional Budget Office Assists LawmakersHow the Congressional Budget Office Assists Lawmakers
How the Congressional Budget Office Assists Lawmakers
 
Introduction to the Role of the Congressional Budget Office
Introduction to the Role of the Congressional Budget OfficeIntroduction to the Role of the Congressional Budget Office
Introduction to the Role of the Congressional Budget Office
 
CBO’s Work on Health Care and a Call for New Research
CBO’s Work on Health Care and a Call for New ResearchCBO’s Work on Health Care and a Call for New Research
CBO’s Work on Health Care and a Call for New Research
 
The Federal Perspective on Coverage of Medications to Treat Obesity: Consider...
The Federal Perspective on Coverage of Medications to Treat Obesity: Consider...The Federal Perspective on Coverage of Medications to Treat Obesity: Consider...
The Federal Perspective on Coverage of Medications to Treat Obesity: Consider...
 
CBO’s Approach to Estimating the Budgetary Effects of the No Surprises Act of...
CBO’s Approach to Estimating the Budgetary Effects of the No Surprises Act of...CBO’s Approach to Estimating the Budgetary Effects of the No Surprises Act of...
CBO’s Approach to Estimating the Budgetary Effects of the No Surprises Act of...
 
The Budget and Economic Outlook for 2024 to 2034: Press Briefing Slides
The Budget and Economic Outlook for 2024 to 2034: Press Briefing SlidesThe Budget and Economic Outlook for 2024 to 2034: Press Briefing Slides
The Budget and Economic Outlook for 2024 to 2034: Press Briefing Slides
 
The Economic Outlook for 2024 to 2034 in 19 Slides
The Economic Outlook for 2024 to 2034 in 19 SlidesThe Economic Outlook for 2024 to 2034 in 19 Slides
The Economic Outlook for 2024 to 2034 in 19 Slides
 
Using Multiple Data Sources to Learn About the Race and Ethnicity of Taxpayers
Using Multiple Data Sources to Learn About the Race and Ethnicity of TaxpayersUsing Multiple Data Sources to Learn About the Race and Ethnicity of Taxpayers
Using Multiple Data Sources to Learn About the Race and Ethnicity of Taxpayers
 
Perspectives on the Navy’s 2024 Shipbuilding Plan
Perspectives on the Navy’s 2024 Shipbuilding PlanPerspectives on the Navy’s 2024 Shipbuilding Plan
Perspectives on the Navy’s 2024 Shipbuilding Plan
 
The 2024 Outlook for Navy Shipbuilding: Familiar Plans and Higher Costs
The 2024 Outlook for Navy Shipbuilding: Familiar Plans and Higher CostsThe 2024 Outlook for Navy Shipbuilding: Familiar Plans and Higher Costs
The 2024 Outlook for Navy Shipbuilding: Familiar Plans and Higher Costs
 
CBO’s Use of GitHub
CBO’s Use of GitHubCBO’s Use of GitHub
CBO’s Use of GitHub
 
Exploring the Effects of Medicaid During Childhood on the Economy and the Budget
Exploring the Effects of Medicaid During Childhood on the Economy and the BudgetExploring the Effects of Medicaid During Childhood on the Economy and the Budget
Exploring the Effects of Medicaid During Childhood on the Economy and the Budget
 
CBO’s Role and Most Recent Long-Term Budget Projections
CBO’s Role and Most Recent Long-Term Budget ProjectionsCBO’s Role and Most Recent Long-Term Budget Projections
CBO’s Role and Most Recent Long-Term Budget Projections
 
Atlas of Military Compensation
Atlas of Military CompensationAtlas of Military Compensation
Atlas of Military Compensation
 
Approaches to Estimating the Noncyclical Rate of Unemployment
 Approaches to Estimating the Noncyclical Rate of Unemployment Approaches to Estimating the Noncyclical Rate of Unemployment
Approaches to Estimating the Noncyclical Rate of Unemployment
 
CBO’s Analysis of the Long-Term Budgetary Outlook
CBO’s Analysis of the Long-Term Budgetary OutlookCBO’s Analysis of the Long-Term Budgetary Outlook
CBO’s Analysis of the Long-Term Budgetary Outlook
 
Projecting the Effects of U.S. Federal Policies on Electric Vehicle Demand an...
Projecting the Effects of U.S. Federal Policies on Electric Vehicle Demand an...Projecting the Effects of U.S. Federal Policies on Electric Vehicle Demand an...
Projecting the Effects of U.S. Federal Policies on Electric Vehicle Demand an...
 
CBO’s Recent Appeals for New Research to Enhance Its Work for the Congress
CBO’s Recent Appeals for New Research to Enhance Its Work for the CongressCBO’s Recent Appeals for New Research to Enhance Its Work for the Congress
CBO’s Recent Appeals for New Research to Enhance Its Work for the Congress
 
Trends in the Distribution of Household Income From 1979 to 2020
Trends in the Distribution of Household Income From 1979 to 2020Trends in the Distribution of Household Income From 1979 to 2020
Trends in the Distribution of Household Income From 1979 to 2020
 

Kürzlich hochgeladen

Manipur-Book-Final-2-compressed.pdfsal'rpk
Manipur-Book-Final-2-compressed.pdfsal'rpkManipur-Book-Final-2-compressed.pdfsal'rpk
Manipur-Book-Final-2-compressed.pdfsal'rpkbhavenpr
 
VIP Girls Available Call or WhatsApp 9711199012
VIP Girls Available Call or WhatsApp 9711199012VIP Girls Available Call or WhatsApp 9711199012
VIP Girls Available Call or WhatsApp 9711199012ankitnayak356677
 
Experience the Future of the Web3 Gaming Trend
Experience the Future of the Web3 Gaming TrendExperience the Future of the Web3 Gaming Trend
Experience the Future of the Web3 Gaming TrendFabwelt
 
IndiaWest: Your Trusted Source for Today's Global News
IndiaWest: Your Trusted Source for Today's Global NewsIndiaWest: Your Trusted Source for Today's Global News
IndiaWest: Your Trusted Source for Today's Global NewsIndiaWest2
 
Rohan Jaitley: Central Gov't Standing Counsel for Justice
Rohan Jaitley: Central Gov't Standing Counsel for JusticeRohan Jaitley: Central Gov't Standing Counsel for Justice
Rohan Jaitley: Central Gov't Standing Counsel for JusticeAbdulGhani778830
 
16042024_First India Newspaper Jaipur.pdf
16042024_First India Newspaper Jaipur.pdf16042024_First India Newspaper Jaipur.pdf
16042024_First India Newspaper Jaipur.pdfFIRST INDIA
 
complaint-ECI-PM-media-1-Chandru.pdfra;;prfk
complaint-ECI-PM-media-1-Chandru.pdfra;;prfkcomplaint-ECI-PM-media-1-Chandru.pdfra;;prfk
complaint-ECI-PM-media-1-Chandru.pdfra;;prfkbhavenpr
 
Global Terrorism and its types and prevention ppt.
Global Terrorism and its types and prevention ppt.Global Terrorism and its types and prevention ppt.
Global Terrorism and its types and prevention ppt.NaveedKhaskheli1
 
57 Bidens Annihilation Nation Policy.pdf
57 Bidens Annihilation Nation Policy.pdf57 Bidens Annihilation Nation Policy.pdf
57 Bidens Annihilation Nation Policy.pdfGerald Furnkranz
 
Quiz for Heritage Indian including all the rounds
Quiz for Heritage Indian including all the roundsQuiz for Heritage Indian including all the rounds
Quiz for Heritage Indian including all the roundsnaxymaxyy
 

Kürzlich hochgeladen (10)

Manipur-Book-Final-2-compressed.pdfsal'rpk
Manipur-Book-Final-2-compressed.pdfsal'rpkManipur-Book-Final-2-compressed.pdfsal'rpk
Manipur-Book-Final-2-compressed.pdfsal'rpk
 
VIP Girls Available Call or WhatsApp 9711199012
VIP Girls Available Call or WhatsApp 9711199012VIP Girls Available Call or WhatsApp 9711199012
VIP Girls Available Call or WhatsApp 9711199012
 
Experience the Future of the Web3 Gaming Trend
Experience the Future of the Web3 Gaming TrendExperience the Future of the Web3 Gaming Trend
Experience the Future of the Web3 Gaming Trend
 
IndiaWest: Your Trusted Source for Today's Global News
IndiaWest: Your Trusted Source for Today's Global NewsIndiaWest: Your Trusted Source for Today's Global News
IndiaWest: Your Trusted Source for Today's Global News
 
Rohan Jaitley: Central Gov't Standing Counsel for Justice
Rohan Jaitley: Central Gov't Standing Counsel for JusticeRohan Jaitley: Central Gov't Standing Counsel for Justice
Rohan Jaitley: Central Gov't Standing Counsel for Justice
 
16042024_First India Newspaper Jaipur.pdf
16042024_First India Newspaper Jaipur.pdf16042024_First India Newspaper Jaipur.pdf
16042024_First India Newspaper Jaipur.pdf
 
complaint-ECI-PM-media-1-Chandru.pdfra;;prfk
complaint-ECI-PM-media-1-Chandru.pdfra;;prfkcomplaint-ECI-PM-media-1-Chandru.pdfra;;prfk
complaint-ECI-PM-media-1-Chandru.pdfra;;prfk
 
Global Terrorism and its types and prevention ppt.
Global Terrorism and its types and prevention ppt.Global Terrorism and its types and prevention ppt.
Global Terrorism and its types and prevention ppt.
 
57 Bidens Annihilation Nation Policy.pdf
57 Bidens Annihilation Nation Policy.pdf57 Bidens Annihilation Nation Policy.pdf
57 Bidens Annihilation Nation Policy.pdf
 
Quiz for Heritage Indian including all the rounds
Quiz for Heritage Indian including all the roundsQuiz for Heritage Indian including all the rounds
Quiz for Heritage Indian including all the rounds
 

Use of Tax Incentives for Retirement Saving in 2006

  • 1. CONGRESS OF THE UNITED STATES CONGRESSIONAL BUDGET OFFICE CBO Use of Tax Incentives for Retirement Saving in 2006 Traditional or Roth IRA 1997 2000 2003 2006 Employment-Based Plan 1997 2000 2003 2006 Any Retirement Plan 1997 © Shutterstock Images, LLC 2000 2003 2006 0 10 20 30 40 50 60 Participation in Retirement Plans as a Percentage of All Workers OCTOBER 2011
  • 3. CBO Use of Tax Incentives for Retirement Saving in 2006 October 2011 The Congress of the United States O Congressional Budget Office
  • 4. Notes and Definitions Unless otherwise noted, all years referred to are calendar years. Numbers in the text, tables, and exhibits may not add up to totals because of rounding. Types of Tax Benefits Traditional: Retirement plans offering these benefits allow contributions to be made from before-tax income, deferring taxes until the funds are withdrawn. Roth-style: Retirement plans offering these benefits require contributions to be made from after-tax income, but impose no tax on withdrawals. Employment-Based Retirement Plans Defined-Benefit Plans: Retirement payments under this group of plans are set on the basis of formulas that typically consider an employee’s earnings and years of service. Because defined-benefit plans do not accept before-tax contribu- tions from employees, they are categorized as noncontributory. Roth-style benefits are not available through such plans. Defined-Contribution Plans: Retirement payments under this group of plans are made out of accounts that contain the amounts contributed by the employer and the employee, and the investment earnings on those contributions. For this study, defined-contribution plans are further subdivided into two groups, 401(k)-type plans and noncontributory defined-contribution plans. 401(k)-type plans: These plans accept before-tax contributions from employees. Many such plans also permit employers to match some or all of their employees’ contributions. This category includes 401(k), 403(b), and 457 plans (all named for the sections of the Internal Revenue Code in which they are defined) and the federal government’s Thrift Savings Plan. 401(k) plans are most common in the private sector, 403(b) plans are most common in the nonprofit sector and in public school systems, and 457 plans are most common in other state and local government units. Before 2006, 401(k)-type plans provided traditional tax benefits only; in 2006, Roth 401(k) plans were introduced for wage earners but not for self-employed people. Noncontributory defined-contribution plans: These plans do not accept before-tax contributions from employees; instead, they are funded entirely by employers. Roth-style benefits are not available through such plans. CBO
  • 5. NOTES AND DEFINITIONS USE OF TAX INCENTIVES FOR RETIREMENT SAVING IN 2006 iii Individual Retirement Accounts Traditional IRAs: Most taxpayers who contribute to a traditional individual retirement account (IRA) are permitted to make before-tax contributions to that account. However, if either the taxpayer or the taxpayer’s spouse is covered by an employment-based plan, some or all of those contributions may be deemed after-tax contributions, depending on income (see Table A-1 of the online supplemental material for details). In such cases, the amounts contributed can be withdrawn tax-free, but the earnings on those contributions are taxable upon withdrawal. For this report, before- and after-tax contributions to traditional IRAs were tabulated together. Roth IRAs: The Roth-style IRA (introduced in 1998) accepts after-tax contributions only, and withdrawals are tax-free once the account is five years old. Above certain income thresholds, however, contributions are limited or disallowed (see Table A-1 of the online supplemental material for details). Data and Supplemental Material Source data: Participation in tax-favored retirement plans, contributions to such plans, and the amounts claimed for the saver’s credit were tabulated from a sample of 320,897 individual income tax returns for 2006 and enhanced by attach- ing data from supplemental tax forms filed by employers and financial institutions. Details on how that database was assembled and used are presented in the appendix. Identification of Plan Types: The data did not permit the discrete identification of all types of plans. For wage earners, 401(k)-type plans could be identified, but it was impossible to distinguish noncontributory defined-contribution from noncontributory defined-benefit plans, so both varieties were tabulated together. (Note that noncontributory plans, despite their label, include plans that require employees to make after-tax contributions and pay tax on benefits in excess of those contributions.) None of the different employment-based plan types could be identified for self-employed people, so all data on those workers were tabulated together. People can participate in more than one type of plan, and such participation is generally reflected in the tabulations. People who participated in an employment-based plan along with an IRA are counted in each category, as are people who contributed both to a traditional IRA and to a Roth IRA. The exception is wage earners who participated in a 401(k)-type plan and a noncontributory plan at the same time. Because they are not separately identifiable in the data, those workers are counted only as participants in 401(k)-type plans. Roth 401(k) plans are not identified separately in the data, but there is evidence that participation in 2006 (the first year of their existence) was low. Supplemental Material: Additional material is available online (www.cbo.gov), including detailed historical informa- tion on changes in tax provisions and on participation rates; average contributions (in nominal amounts and as adjusted for inflation); and percentages of people who were constrained by contribution limits for 1997, 2000, 2003, and 2006. CBO
  • 6. Preface In 2006, more than half of all U.S. workers participated in some form of tax-favored retirement plan. This study, the fourth in a triennial series published by the Congressional Budget Office (CBO) on participation rates in and contributions to various plans, examines data for that year. The first in the series, Utilization of Tax Incentives for Retirement Saving (August 2003), presented data from 1997; the subsequent updates presented data for 2000 and 2003. This document was prepared at the request of the Chairman of the Senate Finance Committee. In keeping with CBO’s mandate to provide objective, impartial analysis, the study makes no recommendations. Paul Burnham of CBO’s Tax Analysis Division produced the study under the direction of Frank Sammartino and Janet Holtzblatt. Frank Russek of CBO and Peter Brady of the Investment Company Institute provided useful comments. The assistance of an external reviewer implies no responsibility for the final product, which rests solely with CBO. Kate Kelly edited the document, and John Skeen proofread it. Maureen Costantino and Jeanine Rees prepared the document for publication, Monte Ruffin produced the printed copies, and Linda Schimmel handled the print distribution. An electronic version is available from CBO’s Web site (www.cbo.gov). Douglas W. Elmendorf Director October 2011 CBO
  • 7. List of Exhibits Exhibit Page Participation Rates and Contributions 1. Participation in Tax-Favored Retirement Plans, 2003 and 2006 5 2. Participation of Wage Earners in Employment-Based Retirement Plans, 2003 and 2006 6 3. Participation of the Self-Employed in Employment-Based Retirement Plans, 2003 and 2006 7 4. Participation of the Self-Employed and Wage Earners in Employment-Based Retirement Plans, by Income Range, 2006 8 5. IRA Participation, 2003 and 2006 9 6. IRA Participation, by Income Range, 2006 10 7. Retirement Plan Participation, 1997 to 2006 11 8. Contributions by Wage Earners to 401(k)-Type Plans, 2003 and 2006 12 9. Contributions by the Self-Employed to Employment-Based Retirement Plans, 2003 and 2006 13 10. Contributions to Traditional IRAs, 2003 and 2006 14 11. Contributions to Roth IRAs, 2003 and 2006 15 12. Average Contributions to Roth and Traditional IRAs, by Age Group, 2006 16 Effects of EGTRRA’s Increases in Contribution Limits 13. Participants Making the Maximum Contribution, 2000 to 2006 18 14. Average Real Contributions to Retirement Plans, 1997 to 2006 19 CBO
  • 8. LIST OF EXHIBITS USE OF TAX INCENTIVES FOR RETIREMENT SAVING IN 2006 vii Exhibit Page 15. The Effect of EGTRRA on Maximum Contributions to 401(k)-Type Plans, 2006 20 16. The Effect of EGTRRA on Maximum Contributions to Traditional IRAs, 2006 21 17. The Effect of EGTRRA on Maximum Contributions to Roth IRAs, 2006 22 Use of the Saver’s Credit 18. Eligibility for the Saver’s Credit, 2003 and 2006 24 19. Claiming of the Saver’s Credit by Eligible Workers, 2003 and 2006 25 20. Eligible Contributors Claiming the Saver’s Credit, 2006 26 21. Average Saver’s Credits and Associated Contributions, 2003 and 2006 27 22. Other Features of Contributions for Which the Saver’s Credit May Be Claimed, 2003 and 2006 28 23. Effective Rate of the Saver’s Credit, 2006 29 CBO
  • 9. Use of Tax Incentives for Retirement Saving in 2006 The federal income tax system contains two alter- This publication of the Congressional Budget some of those workers also participated in native types of incentives to encourage workers to Office (CBO) examines participation rates in and employment-based plans. save for retirement. With traditional incentives, contributions to various plans in 2006, with some workers make contributions (up to a statutory earlier data presented for comparison. Two features Twenty-nine percent of workers who filed tax limit) into certain accounts from their before-tax of the Economic Growth and Tax Relief Reconcili- returns were wage earners who contributed to income and defer tax payments until the funds are ation Act of 2001 (EGTRRA) also are analyzed: 401(k)-type plans. Another 18 percent were wage withdrawn. With so-called Roth-style incentives, increases in contribution limits and an additional earners who participated in noncontributory workers contribute from after-tax income but pay incentive created to encourage lower-income tax- employment-based plans only. Participation rates no tax at the time of withdrawal. In either case, the payers to save for retirement that is known as the by age, income, and marital status for 401(k)-type resulting investment income is effectively earned “saver’s credit.” plans were similar to those for all tax-favored retire- tax-free. If the participant’s marginal tax rate is the ment plans. For employees who participated in same at the time of contribution as it is at the time noncontributory plans only, the rates were much of withdrawal, the tax benefits of traditional and Participation Rates and more uniform across all groupings. Participants in 401(k)-type plans contributed an average of Roth-style treatment are the same. A participant Contributions $4,350 in 2006. Average contributions were higher whose marginal tax rate is lower at the time funds In 2006, just over half (52 percent) of all workers are withdrawn would prefer traditional treatment; among older workers and those whose earnings fell who filed tax returns participated in some form of into higher income ranges. For example, average a participant whose marginal tax rate is higher at tax-favored retirement plan. The highest rates of withdrawal would prefer Roth-style treatment. contributions were $670 among participants participation (64 percent and above) were seen whose income was below $20,000 and $11,000 Among the retirement savings vehicles permitting among workers between the ages of 45 and 59; among those earning $160,000 or more. Contri- a choice between traditional and Roth-style those whose income was $40,000 or more; and butions also were higher among married workers incentives are individual retirement accounts those who were the primary (that is, the higher) who were either a sole or a primary earner than (IRAs) and (at the discretion of the employer) earner in a two-earner household. The lowest rates they were among unmarried workers or among 401(k)-type plans. Contributions to 401(k)-type (41 percent or less) were among workers under the secondary earners in two-earner couples. plans also can be made by employers, but such age of 30; those whose income was under $20,000; contributions can benefit only from the traditional and those who were unmarried. Participation was Slightly fewer workers contributed to traditional incentive. Similarly, employer contributions to concentrated in employment-based plans, with IRAs (3 percent) than to Roth IRAs (4 percent) plans to which employees do not contribute (non- 48 percent of all workers either contributing to or in 2006. Participation in each type of IRA was contributory plans) can benefit only from the being covered by such a plan (47 percent as wage strongly associated with income (except in the traditional incentive. earners and 1 percent as self-employed people). highest income range, in which workers were Only 7 percent of workers contributed to IRAs; ineligible to contribute to a Roth IRA). CBO
  • 10. INTRODUCTION USE OF TAX INCENTIVES FOR RETIREMENT SAVING IN 2006 2 Participation in traditional IRAs was more strongly be attributed to new saving and what represented correlated with age than was participation in Roth shifting between types of accounts. Comparison of Pre-EGTRRA and IRAs. Two-earner married couples who filed joint returns were more likely than other married cou- Current-Law Contribution Limits ples or single workers to contribute to any type of Effects of EGTRRA’s Increases in in 2006 IRA. Participation was lowest among unmarried Contribution Limits Under Under workers. Contributions to traditional IRAs were Tax law has always limited contributions to tax- Pre-EGTRRA Current Law larger ($2,840), on average, than contributions to favored retirement plans—both in dollar terms and Law (EGTRRA) Roth IRAs ($2,590). Average contributions to as a percentage of compensation. EGTRRA raised 401(k) Plan both types of IRAs generally increased with age most of those limits (see the table to the right). and income. Percentage of The percentage-of-compensation limits were Compensation 25 100 Overall participation in some form of tax-favored increased immediately by that act for 401(k)-type plans; they were already at 100 percent for IRAs. Dollar Amount retirement plan was nearly the same in 1997, 2000, Under age 50 12,000 a 15,000 2003, and 2006—within 1 percentage point of The dollar limits were increased according to a a Age 50 or older 12,000 20,000 51 percent. The 52 percent participation rate for schedule (over five years for 401(k)-type plans and 2006 represented an increase of 2 percentage over seven years for IRAs) and now are indexed for IRA (Dollars) points over the rate for 2003, and the change was inflation. Unlike most other aspects of EGTRRA, Traditional the higher contribution limits are not scheduled to Under age 50 2,000 4,000 fairly uniform across age groups and income ranges expire after 2012—they were made permanent by Age 50 or older 2,000 5,000 and according to marital or earner status. Between 2003 and 2006, participation in 401(k)-type plans the Pension Protection Act of 2006. Roth and IRAs did not change, and participation solely Under age 50 2,000 4,000 Contribution limits affect the extent to which in noncontributory plans increased by 1 percentage Age 50 or older 2,000 5,000 certain types of expansions in tax incentives for point. retirement savings increase private saving. Partici- Source: Congressional Budget Office. Average contributions to all types of plans pants whose contributions fall below a limit would not have any incentive to save more if the limit was Note: EGTRRA = Economic Growth and Tax Relief increased in real (inflation-adjusted) terms between Reconciliation Act of 2001; IRA = individual 2003 and 2006, reflecting mostly the scheduled raised: Under current law, they could receive a retirement account. increases in the maximum contribution under larger tax benefit by saving more, but they choose not to. In contrast, participants who contribute the a. The contribution limits under pre-EGTRRA law are EGTRRA. Changes in average contributions in estimated on the basis of inflation since 2001. excess of income growth might not indicate any maximum amount allowed under current law change in the overall saving rate; instead, the dif- would have an incentive to save more if the limit was raised, and they might choose to save more. the percentage of participants who might be ferences in average contributions might reflect the induced to save more if the limits were raised. shifting of assets between taxable and tax-favored Thus, the percentage of participants who already accounts. CBO did not attempt to identify what contribute the maximum amounts allowed (that is, Five percent of participants in 401(k)-type plans in proportion of higher average contributions should the percentage who are constrained by the current 2006 contributed up to the limits established by contribution limits) represents an upper bound on EGTRRA. Twelve percent contributed amounts CBO
  • 11. INTRODUCTION USE OF TAX INCENTIVES FOR RETIREMENT SAVING IN 2006 3 equal to or greater than the pre-EGTRRA limits The saver’s credit is nonrefundable, meaning that it and presumably would have made the maximum cannot exceed a taxpayer’s income tax liability. Saver’s Credit Rates and Income allowable contributions in the absence of Thus, workers without any income tax liability EGTRRA. Therefore, EGTRRA reduced the cannot claim the credit, even if they make qualify- Ranges, 2003 and 2006 proportion of participants who were constrained ing contributions. The saver’s credit originally was (Dollars) by the contribution limits for 401(k)-type plans by scheduled to expire after 2006, but it was made Rate of Credit Income Range 7 percentage points. For traditional IRAs, permanent (and the top threshold was indexed for Single or Married Filing Separately EGTRRA reduced the proportion of participants inflation) by the Pension Protection Act of 2006. 50 Percent 0 to 14,999 constrained by the contribution limits in 2006 20 Percent 15,000 to 16,249 from 73 percent to 52 percent, a decline of 21 per- In 2006, 25 percent of all workers who filed tax 10 Percent 16,250 to 24,999 centage points; for Roth IRAs, the corresponding returns were eligible to take the saver’s credit (down proportions were 62 percent and 39 percent, for a from 30 percent in 2003) on the basis of their Married Filing Jointly decline of 23 percentage points. income and tax liability. Only 20 percent of those 50 Percent 0 to 29,999 eligible actually contributed to a retirement 20 Percent 30,000 to 33,499 account (down slightly from 21 percent in 2003), 10 Percent 33,500 to 49,999 The Saver’s Credit and 65 percent of those who contributed claimed Filing as Head of Household The saver’s credit was introduced by EGTRRA the credit (up from 59 percent in 2003). 50 Percent 0 to 22,499 to encourage retirement saving by providing tax 20 Percent 22,500 to 24,374 Taxpayers whose income was low enough to qual- credits to qualifying taxpayers whose adjusted 10 Percent 24,375 to 37,499 ify for the top credit rate (50 percent) were the gross income falls below particular thresholds. least likely either to make qualifying contributions To qualify, a worker must contribute either to a Source: Congressional Budget Office. or to claim the credit if they did. Those whose 401(k)-type plan or to an IRA. The rate of the Note: The income ranges refer to adjusted gross income placed them in the lowest bracket (10 per- credit is determined by a worker’s adjusted gross income. cent) were the most likely to make qualifying income and filing status, and it is applied to the contributions and to claim the credit. The average first $2,000 of qualifying contributions (see the amount of the credit was $156. table to the right). CBO
  • 12. Participation Rates and Contributions CBO
  • 13. PARTICIPATION RATES AND CONTRIBUTIONS USE OF TAX INCENTIVES FOR RETIREMENT SAVING IN 2006 5 Exhibit 1. In 2006, 52 percent of U.S. workers partici- Participation in Tax-Favored Retirement Plans, 2003 and 2006 pated in some sort of tax-favored retirement plan. That rate was 2 percentage points higher 2003 2006 than the overall participation rate in 2003. In Number of Percentage Number of Percentage both 2003 and 2006, participation rates varied Workers Participating in Workers Participating in widely by age, income, and marital and earner (Millions) Any Plana (Millions) Any Plan a status. Age Group (Years) Under 30 38.9 32 41.8 33 Participation increased with age—but only to 30 to 44 48.8 56 49.6 57 age 60. In 2006, the participation rate among 45 to 59 39.8 63 44.7 64 workers under 30 was 33 percent. The rate was 60 or Older 13.3 _____ 44 13.5 _____ 45 57 percent among 30- to 44-year-olds and All Ages 140.8 50 149.6 52 64 percent among 45- to 59-year-olds. Only 45 percent of workers age 60 or older partici- b Income Range (2006 dollars) pated, probably because that group includes Under $20,000 38.8 17 41.5 17 workers who are semiretired and are receiving $20,000 to $39,999 30.6 46 31.9 47 benefits rather than saving for them. $40,000 to $79,999 37.2 63 38.6 65 $80,000 to $119,999 19.0 76 19.8 77 Participation was lowest among people whose $120,000 to $159,999 7.2 82 7.9 81 income was below $20,000—17 percent in $160,000 and Above 7.9 81 9.9 81 2006. In each successive income category, _____ _____ except the highest, participation was greater. In All Income Ranges 140.8 50 149.6 52 2006, participation was 81 percent in the highest income range, the same as in the next- Marital and Earner Status highest range. Unmarried Earners 69.8 40 74.8 41 Unmarried workers were less likely than Married Earners married workers to participate in some kind Sole 21.2 52 20.0 52 Primary 24.9 72 27.4 74 of tax-favored plan. Participation was lower Secondary 24.9 57 27.4 57 (41 percent in 2006) among unmarried people _____ _____ than among primary (higher) earners (74 per- All Earners 140.8 50 149.6 52 cent) or secondary (lower) earners (57 percent) Nonearning Spouses 21.2 6 20.0 7 in two-earner families or among sole earners in one-earner married couples (52 percent).  Source: Congressional Budget Office tabulations of a sample of 2003 and 2006 individual income tax returns and tax information returns. a. Participation consists of either enrolling in a noncontributory plan or contributing to an individual retirement account; a 401(k)-type plan; or a self-employment SEP (simplified employee pension), SIMPLE (Savings Incentive Match Plan for Employees), or other qualified plan. b. The income ranges refer to adjusted gross income plus excluded contributions to retirement plans minus CBO taxable distributions from individual retirement accounts.
  • 14. PARTICIPATION RATES AND CONTRIBUTIONS USE OF TAX INCENTIVES FOR RETIREMENT SAVING IN 2006 6 Exhibit 2. In 2006, 47 percent of workers participated in Participation of Wage Earners in Employment-Based employment-based retirement plans, account- ing for more than 90 percent of those who par- Retirement Plans, 2003 and 2006 ticipated in any tax-favored plan. The largest (Percentage of all workers) group (29 percent of all workers) contributed to a 401(k)-type plan; 18 percent of workers 2003 2006 Any Any were enrolled in a noncontributory plan only. 401(k)-Type Noncontributory Employment- 401(k)-Type Noncontributory Employment- The patterns of participation in 401(k)-type Plana Plan Onlyb Based Plan Plana Plan Onlyb Based Plan plans—by age, income, and marital and earner Age Group (Years) status—were similar to those for all tax- Under 30 14 16 30 16 15 31 favored retirement plans. Participation was 30 to 44 34 18 52 34 20 54 greater among workers between the ages of 30 45 to 59 38 19 57 39 19 58 and 59 and among workers with annual 60 or Older 22 15 37 23 15 38 income of $80,000 or more. Participation of All Ages 29 17 46 29 18 47 married people, regardless of earner status, Income Range (2006 dollars)c outstripped that of unmarried people. Under $20,000 4 10 15 5 11 16 Rates of participation in noncontributory $20,000 to $39,999 21 21 43 23 21 44 plans only were fairly uniform among the vari- $40,000 to $79,999 37 22 58 38 22 61 ous groups. Participation was highest among $80,000 to $119,999 51 19 70 50 21 71 30- to 44-year-old workers (20 percent), simi- $120,000 to $159,999 58 16 74 58 17 74 lar to that among 45- to 59-year-old workers $160,000 and Above 57 13 69 56 14 70 (19 percent). Participation peaked at 22 per- All Income cent among workers earning between $40,000 Ranges 29 17 46 29 18 47 and $79,999 per year, although the rate was Marital and Earner Status almost the same (21 percent) among workers Unmarried Earners 21 16 37 22 16 38 earning between $20,000 and $39,999 and Married Earners workers earning between $80,000 and Sole 30 17 46 30 17 47 $119,999. There were only small differences in Primary 47 20 67 48 20 69 participation among groups by marital and Secondary 31 19 50 31 20 51 earner status. All Earners 29 17 46 29 18 47 Because the available data sources do not Source: Congressional Budget Office tabulations of a sample of 2003 and 2006 individual income tax returns and contain enough information to identify people tax information returns. who participated in 401(k)-type and non- contributory plans simultaneously, such a. Participation consists of contributing to a 401(k)-type plan during the given year. participants were counted in the 401(k)-type b. Participation consists of being enrolled in a noncontributory plan during the given year, while not contributing group only. Results for workers who partici- to a 401(k)-type plan. pated in a noncontributory plan alone may not CBO c. The income ranges refer to adjusted gross income plus excluded contributions to retirement plans minus reflect the patterns for all participants in taxable distributions from individual retirement accounts. noncontributory plans. 
  • 15. PARTICIPATION RATES AND CONTRIBUTIONS USE OF TAX INCENTIVES FOR RETIREMENT SAVING IN 2006 7 Exhibit 3. Self-employed workers participating in Participation of the Self-Employed in Employment-Based employment-based retirement plans accounted for a much smaller share of participation in Retirement Plans, 2003 and 2006 tax-favored retirement plans in 2003 or 2006 than did wage earners participating in 2003 2006 employment-based plans or IRA contributors. Percentage of Percentage of Just 1 percent of all U.S. workers fell into the Percentage of Self-Employed Percentage of Self-Employed All Workersa Workersa All Workersa Workersa category of self-employed participants in either year. Among workers with self-employment Age Group (Years) income, the participation rate in employment- Under 30 <1 1 <1 1 based retirement plans in both 2003 and 2006 30 to 44 1 7 1 6 was 8 percent, far below the participation rate 45 to 59 2 12 2 11 among wage earners. 60 or Older 2 8 2 10 All Ages 1 8 1 8 Expressed as a percentage of self-employed Income Range (2006 dollars) b people, participation was lowest in the under- 30 age group (1 percent in 2006) and highest Under $20,000 <1 1 <1 1 among 45- to 59-year-old workers (11 per- $20,000 to $39,999 <1 2 <1 2 cent). Among workers over the age of 59, $40,000 to $79,999 1 6 <1 5 $80,000 to $119,999 1 13 1 11 however, the rate of participation dropped $120,000 to $159,999 3 24 2 19 back to 10 percent. Unmarried earners were $160,000 and Above 7 38 7 36 less likely (4 percent) than married workers to All Income Ranges 1 8 1 8 participate; within married couples, primary earners had the highest rate of participation Marital and Earner Status (13 percent).  Unmarried Earners <1 4 <1 4 Married Earners Sole 1 8 1 8 Primary 2 15 2 13 Secondary 1 10 1 9 All Earners 1 8 1 8 Source: Congressional Budget Office tabulations of a sample of 2003 and 2006 individual income tax returns and tax information returns. Note: Self-employed workers are those who file Schedule SE. a. Participation consists of reporting a contribution to a self-employment SEP (simplified employee pension), SIMPLE (Savings Incentive Match Plan for Employees), or other qualified plan. b. The income ranges refer to adjusted gross income plus excluded contributions to retirement plans minus taxable distributions from individual retirement accounts. CBO
  • 16. PARTICIPATION RATES AND CONTRIBUTIONS USE OF TAX INCENTIVES FOR RETIREMENT SAVING IN 2006 8 Exhibit 4. Rates of participation in employment-based Participation of the Self-Employed and Wage Earners in retirement plans among the self-employed in Employment-Based Retirement Plans, by Income Range, 2006 2006 differed markedly by participants’ annual income, from 1 percent in the under-$20,000 group to 36 percent in the group earning 1 Under $20,000 18 $160,000 or more. That pattern contrasts with participation among wage earners, for whom 2 $20,000 to $39,999 the rate was relatively flat in all income groups 46 above $80,000 and actually slightly lower in 5 the highest income group than in the second- $40,000 to $79,999 63 highest income group. 11 $80,000 to $119,999 74 Despite that difference in the pattern of partic- 19 ipation across income groups, participation $120,000 to $159,999 78 among wage earners was higher than among 36 self-employed people in every income group. $160,000 and Above Overall, half of all wage earners and 8 percent 76 8 of self-employed people participated in an All Income Ranges employment-based plan in 2006. (Unlike 50 Exhibit 2, this exhibit shows participation 0 10 20 30 40 50 60 70 80 90 rates for wage earners calculated as a percent- age of wage earners, not as a percentage of all Percentage of the Self-Employed Percentage of Wage Earners workers.)  Source: Congressional Budget Office tabulations of a sample of 2006 individual income tax returns and tax information returns. Notes: Figures for wage earners are not comparable to those in Exhibit 2 because that exhibit calculates participation as a percentage of all workers, not as a percentage of wage earners. The income ranges refer to adjusted gross income plus excluded contributions to retirement plans minus taxable distributions from individual retirement accounts. CBO
  • 17. PARTICIPATION RATES AND CONTRIBUTIONS USE OF TAX INCENTIVES FOR RETIREMENT SAVING IN 2006 9 Exhibit 5. Only 7 percent of workers contributed to an IRA Participation, 2003 and 2006 individual retirement account in 2003 or in 2006—a far lower percentage than partici- (Percentage of all workers) pated in employment-based retirement plans 2003 2006 in either year. Participation was 4 percent in Category Traditional IRA Roth IRA Any IRA Traditional IRA Roth IRA Any IRA 2003 and 3 percent in 2006 for traditional Age Group (Years) IRAs and 4 percent in both years for Roth Under 30 1 3 4 1 3 4 IRAs. (A small number of people contributed 30 to 44 3 4 7 3 4 7 to both types in the same year.) 45 to 59 6 5 10 6 5 10 In 2006, overall participation in IRAs was 60 to 70 9 3 11 8 3 11 highest (11 percent) among workers between 71 or Older n.a. 3 3 n.a. 2 2 All Ages 4 4 7 3 4 7 the ages of 60 and 70. People over the age of 70½ cannot contribute to traditional IRAs, so Income Range (2006 dollars) a the overall IRA participation rate among work- Under $20,000 1 1 2 1 1 2 ers who were 71 or older was only 2 percent $20,000 to $39,999 3 2 5 3 3 5 that year. Participation in traditional IRAs was $40,000 to $79,999 5 4 9 4 5 9 lowest among those under age 30 and highest $80,000 to $119,999 5 7 12 4 8 12 among people between the ages of 60 and 70. $120,000 to $159,999 6 10 15 6 10 15 Participation in Roth IRAs peaked at 5 percent $160,000 and Above 10 3 13 10 n.a. 10 among people between the ages of 45 and 59. All Income Ranges 4 4 7 3 4 7 Younger workers were more likely to partici- Marital and Earner Status pate in a Roth IRA (3 percent under the age of 30 did so) than in a traditional IRA (just Unmarried Earners 2 3 5 2 3 5 1 percent participated). In contrast, the partic- Married Earners ipation rate in traditional IRAs among people Sole 5 3 8 4 4 8 in the 60- to 70-year-old group was 8 percent, Primary 5 5 10 5 5 10 more than twice that for Roth IRAs Secondary 5 5 10 5 5 10 All Earners 4 4 7 3 4 7 (3 percent). Nonearning Spousesb 4 2 6 4 3 7 There was little difference in participation among groups by marital and earner status. Source: Congressional Budget Office tabulations of a sample of 2003 and 2006 individual income tax returns and Ten percent of members of two-earner house- tax information returns. holds contributed to IRAs—5 percent to each type—regardless of whether they were the Note: IRA = individual retirement account; n.a. = not applicable. primary or secondary earner.  a. The income ranges refer to adjusted gross income plus excluded contributions to retirement plans minus taxable distributions from IRAs. b. Participation is calculated as a percentage of all nonearning spouses, not as a percentage of all workers. CBO
  • 18. PARTICIPATION RATES AND CONTRIBUTIONS USE OF TAX INCENTIVES FOR RETIREMENT SAVING IN 2006 10 Exhibit 6. Participation in traditional and Roth IRAs IRA Participation, by Income Range, 2006 generally rose with income in 2006. However, the increase was somewhat greater for Roth (Percentage of all workers) than for traditional IRAs. 1 Under $20,000 1 At the lower end of the income scale, partici- pation in traditional and Roth IRAs was 3 $20,000 to $39,999 similar—1 percent for those with income 3 5 under $20,000 and 3 percent for people whose $40,000 to $79,999 income was between $20,000 and $39,999. At 4 8 higher income ranges, up to $160,000, how- $80,000 to $119,999 4 ever, participation was higher for Roth IRAs 10 than for traditional IRAs. In the $120,000-to- $120,000 to $159,999 6 $159,999 range, Roth participation reached a a peak of 10 percent; about 6 percent of people $160,000 and Above 10 in that group participated in a traditional IRA. 4 All Income Ranges Although people whose income is above 3 $160,000 cannot contribute to a Roth IRA, 0 2 4 6 8 10 12 there is no such restriction for traditional IRAs (although contributions may not be deduct- Roth IRA Traditional IRA ible). Ten percent of workers in that top income range made contributions (including Source: Congressional Budget Office tabulations of a sample of 2006 individual income tax returns and tax information returns. nondeductible contributions) to those accounts.  Notes: The income ranges refer to adjusted gross income plus excluded contributions to retirement plans minus taxable distributions from IRAs. IRA = individual retirement account. a. Contributions to Roth IRAs are not permitted in this income range. CBO
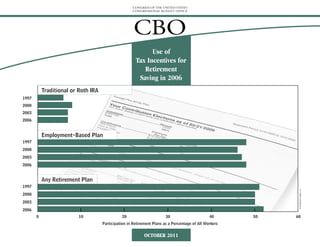
  • 19. PARTICIPATION RATES AND CONTRIBUTIONS USE OF TAX INCENTIVES FOR RETIREMENT SAVING IN 2006 11 Exhibit 7. In 1997, 2000, 2003, and 2006, overall partic- Retirement Plan Participation, 1997 to 2006 ipation in all types of tax-favored retirement plans ranged from 50 percent to 52 percent, (Percentage of all workers) with no discernable trend over time. Participa- Traditional or Roth IRA tion in employment-based plans for all work- 1997 6 ers—wage earners and the self-employed 2000 8 alike—ranged from 46 percent to 48 percent, 2003 7 and IRA participation (whether in a traditional 2006 7 plan or in a Roth plan) ranged from 6 percent to 8 percent.  Employment-Based Plan 1997 48 2000 46 2003 47 2006 48 Any Retirement Plan 1997 51 2000 50 2003 50 2006 52 0 10 20 30 40 50 60 Source: Congressional Budget Office tabulations of a sample of 1997, 2000, 2003, and 2006 individual income tax returns and tax information returns. Note: IRA = individual retirement account. CBO
  • 20. PARTICIPATION RATES AND CONTRIBUTIONS USE OF TAX INCENTIVES FOR RETIREMENT SAVING IN 2006 12 Exhibit 8. In 2006, workers under the age of 50 could Contributions by Wage Earners to 401(k)-Type Plans, contribute 100 percent of their compensation, 2003 and 2006 up to $15,000, to a 401(k) plan; the limit for people age 50 or older was $20,000. The aver- Annual age contribution among all groups was 2003 2006 Percentage $4,350, and 5 percent of all participants con- Average Percentage of Average Percentage of Change in tributed the maximum allowable amount. Number of Contribution Participants Number of Contribution Participants Average Participants (2006 Contributing Participants (2006 Contributing Contribution, The higher contribution limits for older work- Category (Millions) dollars) the Maximum (Millions) dollars) the Maximum 2003–2006a ers may be partly responsible for the fact that Age Group (Years) those groups contributed the most to 401(k)- Under 30 5.6 2,140 1 6.6 1,950 1 -3 type plans. But even workers between the ages 30 to 44 16.6 3,860 6 16.9 3,990 5 1 of 30 and 44 made substantially higher average 45 to 59 15.1 4,900 6 17.8 5,340 6 3 contributions ($3,990) than did workers 60 or Older 2.9 ____ 4,750 5 3.1 ____ 5,910 6 8 under the age of 30 ($1,950). The two groups All Ages 40.3 4,070 5 44.1 4,350 5 2 with members subject to higher limits made Income Range (2006 dollars) b the largest average contributions—$5,340 for people between the ages of 45 and 59, and Under $20,000 1.7 720 <1 2.1 670 <1 -2 $20,000 to $39,999 6.5 1,320 <1 7.4 1,290 <1 -1 $5,910 for people age 60 or older. Contribu- $40,000 to $79,999 13.7 2,820 1 14.7 2,810 1 >-1 tions also grew fastest among older workers; $80,000 to $119,999 9.7 4,570 3 9.4 4,720 2 1 average real (inflation-adjusted) contributions $120,000 to $159,999 4.2 6,700 8 4.6 7,050 7 2 from people in the 60-or-older group increased $160,000 and Above 4.5 ____ 9,550 28 5.6 ____ 11,000 27 5 by an average of 8 percent per year over the All Income three-year period. Ranges 40.3 4,070 5 44.1 4,350 5 2 The association between the average contribu- Marital and Earner Status tion and income also was strong. The average Unmarried Earners 14.5 3,170 3 16.4 3,210 3 <1 contribution in 2006 was $670 for people Married Earners whose income was below $20,000; people Sole 6.3 5,240 8 6.0 5,940 9 4 making more than $160,000 contributed an Primary 11.8 4,990 7 13.3 5,430 6 3 average of $11,000. Secondary 7.7 ____ 3,400 3 8.4 ____ 3,750 4 3 All Earners 40.3 4,070 5 44.1 4,350 5 2 In 2006, the average contribution of a working spouse in a one-earner family ($5,940) was the Source: Congressional Budget Office tabulations of a sample of 2003 and 2006 individual income tax returns and highest among the various groups by marital tax information returns. and earner status. Within two-earner couples, a. Average change, adjusted for inflation. the primary earner contributed an average of $5,430, and the secondary earner contributed b. The income ranges refer to adjusted gross income plus excluded contributions to retirement plans minus an average of $3,750. Unmarried workers taxable distributions from individual retirement accounts. contributed the least, averaging $3,210.  CBO
  • 21. PARTICIPATION RATES AND CONTRIBUTIONS USE OF TAX INCENTIVES FOR RETIREMENT SAVING IN 2006 13 Exhibit 9. In 2006, contributions by self-employed Contributions by the Self-Employed to Employment-Based people to employment-based plans were lim- Retirement Plans, 2003 and 2006 ited to $44,000. The average contribution was $16,370, and 12 percent of participants con- Annual tributed the statutory maximum amount. 2003 2006 Percentage Average Percentage of Average Percentage of Change in Average contributions by the self-employed Number of Contribution Participants Number of Contribution Participants Average generally increased with age and income. Participants (2006 Contributing Participants (2006 Contributing Contribution, Among contributors who were age 60 or older, Category (Millions) dollars) the Maximum (Millions) dollars) the Maximum 2003–2006a however, average contributions were about the Age Group (Years) same as they were for people between the ages Under 30 <0.1 8,200 5 <0.1 10,000 10 7 of 45 and 59. Average contributions varied 30 to 44 0.4 13,510 9 0.3 15,000 11 4 much more by marital and earner status than 45 to 59 0.7 16,040 12 0.7 17,010 13 2 was the case for other types of plans, ranging 60 or Older 0.2 ___ 15,340 9 0.3 ___ 17,020 11 4 from a low of $6,830 for secondary earners in All Ages 1.3 14,990 10 1.3 16,370 12 3 two-earner couples to a high of $23,340 for Income Range (2006 dollars)b sole earners in one-earner couples. Under $20,000 <0.1 3,390 4 <0.1 3,090 6 -3 Average real (inflation-adjusted) contributions $20,000 to $39,999 0.1 4,360 <1 0.1 4,260 1 -1 to employment-based plans by self-employed $40,000 to $79,999 0.2 6,150 4 0.2 6,150 3 <1 people increased by about 3 percent per year $80,000 to $119,999 0.2 8,800 1 0.2 8,220 3 -2 between 2003 and 2006. Although the limit $120,000 to $159,999 0.2 10,010 4 0.2 11,390 3 4 $160,000 and Above 0.6 23,680 20 0.7 24,090 20 1 on contributions was virtually unchanged in ___ ___ real terms over the period, the proportion of All Income workers constrained by the limit increased Ranges 1.3 14,990 10 1.3 16,370 12 3 from 10 percent to 12 percent.  Marital and Earner Status Unmarried Earners 0.3 15,890 11 0.3 15,740 10 >-1 Married Earners Sole 0.3 20,380 17 0.3 23,340 20 5 Primary 0.4 17,820 11 0.4 19,540 13 3 Secondary 0.3 ___ 6,070 4 0.3 ___ 6,830 5 4 All Earners 1.3 14,990 10 1.3 16,370 12 3 Source: Congressional Budget Office tabulations of a sample of 2003 and 2006 individual income tax returns and tax information returns. a. Average change, adjusted for inflation. b. The income ranges refer to adjusted gross income plus excluded contributions to retirement plans minus taxable distributions from individual retirement accounts. CBO
  • 22. PARTICIPATION RATES AND CONTRIBUTIONS USE OF TAX INCENTIVES FOR RETIREMENT SAVING IN 2006 14 Exhibit 10. In 2006, contributions to traditional IRAs Contributions to Traditional IRAs, 2003 and 2006 were limited to $4,000 for people under the age of 50 and $5,000 for people who were 50 Annual or older. For someone with an employment- 2003 2006 Percentage based plan (or whose spouse had access to such Average Percentage of Average Percentage of Change in a plan), the deductible amount depended on Number of Contribution Participants Number of Contribution Participants Average Participants (2006 Contributing Participants (2006 Contributing Contribution, income. This exhibit shows deductible and Category (Millions) dollars) the Maximum (Millions) dollars) the Maximum 2003–2006a nondeductible contributions combined. Age Group (Years) The average contribution to traditional IRAs Under 30 0.4 1,690 38 0.4 1,770 28 2 in 2006 was $2,840, and 52 percent of partici- 30 to 44 1.4 2,080 55 1.4 2,360 52 4 pants contributed the statutory maximum. 45 to 59 2.5 2,530 58 2.6 3,070 55 7 Although average real (inflation-adjusted) 60 to 70 0.8 2,796 57 0.8 3,570 57 8 contributions increased by approximately 71 or Older n.a. ___ n.a. n.a. n.a. ___ n.a. n.a. n.a. 6 percent per year from 2003 to 2006, the All Ages 5.2 2,370 55 5.2 2,840 52 6 maximum allowable contribution rose much Income Range (2006 dollars) b more, so the percentage contributing the maxi- Under $20,000 0.3 1,810 26 0.4 1,920 21 2 mum dropped from 55 percent to 52 percent. $20,000 to $39,999 1.0 1,990 33 0.8 2,180 25 3 $40,000 to $79,999 1.8 2,270 45 1.7 2,620 40 5 Because so many IRA contributors were con- $80,000 to $119,999 0.9 2,360 66 0.9 2,850 59 6 strained by the limits, there was much less $120,000 to $159,999 0.4 2,680 75 0.4 3,320 74 7 variation in average amounts by income range $160,000 and Above 0.8 ___ 3,180 92 1.0 ___ 3,920 92 7 than was the case for 401(k)-type plans. The All Income average in 2006 for the under-$20,000 range Ranges 5.2 2,370 55 5.2 2,840 52 6 ($1,920) was not quite half that ($3,920) con- Marital and Earner Status tributed by the group earning $160,000 or more. In contrast, the average contribution to Unmarried Earners 1.7 2,160 49 1.7 2,600 46 6 a 401(k)-type plan in the highest income range Married Earners Sole 1.0 2,630 60 0.9 3,140 58 6 exceeded the average contribution in the low- Primary 1.2 2,450 56 1.3 2,860 53 5 est by a factor of more than 16 (see Exhibit 8). Secondary 1.3 ___ 2,380 57 1.4 ___ 2,940 55 7 Average contributions varied much less accord- All Earners 5.2 2,370 55 5.2 2,840 52 6 ing to marital and earner status than they did Nonearning Spouses 0.9 2,720 66 0.8 3,290 64 7 for other characteristics or among contributors to 401(k)-type plans. Unmarried people con- Source: Congressional Budget Office tabulations of a sample of 2003 and 2006 individual income tax returns and tributed the least—about $2,600, on average, tax information returns. in 2006. Contributions from the sole earner in Note: IRA = individual retirement account; n.a. = not applicable. one-earner couples averaged $3,140; their a. Average change, adjusted for inflation. nonearning spouses contributed the most: $3,290, on average.  b. The income ranges refer to adjusted gross income plus excluded contributions to retirement plans minus CBO taxable distributions from IRAs.