Commercial Real Estate: Industrial Sector 2001-2009
•
1 gefällt mir•161 views

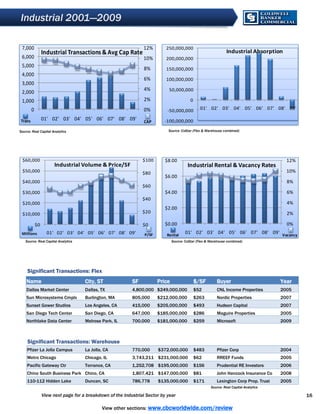
As part of Coldwell Banker Commercial's Review of Commercial Real Estate in the first decade of the 2000s, this part examines the Industrial Sector with key transactions, vacancy rates and happenings during each year.

Empfohlen
Empfohlen
Weitere ähnliche Inhalte
Mehr von Coldwell Banker Commercial
Mehr von Coldwell Banker Commercial (20)
Commercial Real Estate: Industrial Sector 2001-2009
- 1. Industrial 2001—2009 7,000 12% 250,000,000 Industrial Transactions & Avg Cap Rate Industrial Absorption 6,000 10% 200,000,000 5,000 8% 150,000,000 4,000 6% 100,000,000 3,000 4% 50,000,000 2,000 1,000 2% 0 0 0% 01' 02' 03' 04' 05' 06' 07' 08' 09' -50,000,000 Trans 01' 02' 03' 04' 05' 06' 07' 08' 09' CAP -100,000,000 Source: Real Capital Analytics Source: CoStar (Flex & Warehouse combined) $60,000 $100 $8.00 12% Industrial Volume & Price/SF Industrial Rental & Vacancy Rates $50,000 $80 10% $6.00 $40,000 8% $60 $30,000 $4.00 6% $40 $20,000 4% $2.00 $10,000 $20 2% $0 $0 $0.00 0% Millions 01' 02' 03' 04' 05' 06' 07' 08' 09' P/SF Rental 01' 02' 03' 04' 05' 06' 07' 08' 09' Vacancy Source: Real Capital Analytics Source: CoStar (Flex & Warehouse combined) Significant Transactions: Flex Name City, ST SF Price $/SF Buyer Year Dallas Market Center Dallas, TX 4,800,000 $249,000,000 $52 CNL Income Properties 2005 Sun Microsystems Cmplx Burlington, MA 805,000 $212,000,000 $263 Nordic Properties 2007 Sunset Gower Studios Los Angeles, CA 415,000 $205,000,000 $493 Hudson Capital 2007 San Diego Tech Center San Diego, CA 647,000 $185,000,000 $286 Maguire Properties 2005 Northlake Data Center Melrose Park, IL 700,000 $181,000,000 $259 Microsoft 2009 Significant Transactions: Warehouse Pfizer La Jolla Campus La Jolla, CA 770,000 $372,000,000 $483 Pfizer Corp 2004 Metro Chicago Chicago, IL 3,743,211 $231,000,000 $62 RREEF Funds 2005 Pacific Gateway Ctr Torrance, CA 1,252,708 $195,000,000 $156 Prudential RE Investors 2006 Chino South Business Park Chino, CA 1,807,421 $147,000,000 $81 John Hancock Insurance Co 2008 110-112 Hidden Lake Duncan, SC 786,778 $135,000,000 $171 Lexington Corp Prop. Trust 2005 Source: Real Capital Analytics View next page for a breakdown of the Industrial Sector by year 16 View other sections: www.cbcworldwide.com/review
- 2. Industrial Breakdown 17 View other sections: www.cbcworldwide.com/review