Volatility and Risk-Adjusted Returns of Real Estate

Investors can be fooled by comparing volatility or risk-adjusted returns of assets over the wrong investment horizon. Real estate returns are commonly reported quarterly, but most institutional and retirement investors (including endowments, foundations, and pension funds) have multi-year investment horizons. These graphs show volatility and risk-adjusted returns based on the reported returns for five different types of U.S. real estate investment: listed equity REITs, unlevered core properties, core funds, value-add funds, and opportunistic funds. Quarterly data makes it seem as though unlisted real estate is much less volatile than listed equity REITs, but that's only because unlisted real estate returns are measured very poorly, with substantial smoothing. For basically all assets, volatility over long investment horizons is less than over short horizons: that just means that volatility measures uncertainty about returns, and average returns over long periods aren't very uncertain. That effect shows up very strongly with listed assets, including listed equity REITs, but not very strongly with unlisted assets, including private real estate, because volatility has already been disguised through the appraisal process. Quarterly data makes it seem as though unlisted real estate has provided better risk-adjusted returns than listed equity REITs, but the truth is the opposite: listed U.S. equity REITs have provided dramatically better risk-adjusted returns than private U.S. real estate investments over historical periods extending back to the beginning of 1978.

Empfohlen
Empfohlen
Weitere ähnliche Inhalte
Mehr von Brad Case, PhD, CFA, CAIA
Mehr von Brad Case, PhD, CFA, CAIA (6)
Kürzlich hochgeladen
Kürzlich hochgeladen (20)
Volatility and Risk-Adjusted Returns of Real Estate
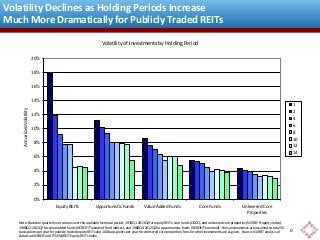
- 1. Volatility Declines as Holding Periods Increase Much More Dramatically for Publicly Traded REITs Volatility of Investments by Holding Period 20% 18% 16% Annualized Volatility 14% 1 2 4 6 8 10 12 14 12% 10% 8% 6% 4% 2% 0% Equity REITs Opportunistic Funds Value Added Funds Core Funds Unlevered Core Properties Note: Based on quarterly net returns over the available historical period: 1978Q1-2013Q2 for equity REITs, core funds (ODCE), and unlevered core properties (NCREIF Property Index); 1988Q2-2012Q2 for value added funds (NCREIF/Townsend Fund Indices); and 1988Q4-2012Q2 for opportunistic funds (NCREIF/Townsend). Fees and expenses are assumed to total 50 basis points per year for publicly traded equity REITs and 100 basis points per year for unlevered core properties; fees for other investments are as given. Source: NAREIT analysis of data from NCREIF and FTSE NAREIT Equity REITs Index. 0
- 2. Publicly Traded Equity REITs Provide Better Risk-Adjusted Net Returns than Private Equity Real Estate Funds Risk-Adjusted Returns of Investments by Holding Period 1.6 1.4 1.2 1 2 Sharpe Ratio 1.0 4 6 0.8 8 10 0.6 12 14 0.4 0.2 0.0 Equity REITs Opportunistic Funds Value Added Funds Core Funds Unlevered Core Properties Note: Based on quarterly net returns over the available historical period: 1978Q1-2013Q2 for equity REITs, core funds (ODCE), and unlevered core properties (NCREIF Property Index); 1983Q2-2013Q2 for value added funds (NCREIF/Townsend Fund Indices); and 1988Q4-2013Q2 for opportunistic funds (NCREIF/Townsend). Fees are assumed to total 50 basis points per year for publicly traded equity REITs and 100 basis points per year for unlevered core properties; fees for other investments are as given. Risk-adjusted rate is Citigroup 1-mo U.S. Treasury TR. Source: NAREIT analysis of data from NCREIF and FTSE NAREIT Equity REITs Index. 1