2. High-Value, Cost-Conscious Health Care Clinical Guideline
principles that can help clinicians and policymakers iden- Cost-effectiveness analysis compares the health bene-
tify and deliver high-value care (4). We emphasize 3 key fits and costs of 2 or more preventive, diagnostic, or treat-
concepts. First, it is essential to assess the benefits, harms, ment strategies. The analysis estimates a measure of the
and costs of an intervention to understand whether it pro- value of one intervention compared with another, called
vides good value. Second, an assessment of the cost of an the incremental cost-effectiveness ratio. This ratio measures
intervention should include not only the cost of the efficiency and estimates the additional expenditures re-
intervention itself but also any downstream costs that quired to gain additional health benefits when a more ef-
occur as a result of the intervention. Finally, the incre- fective and expensive strategy is undertaken. The incre-
mental cost-effectiveness ratio, which estimates how mental cost-effectiveness ratio is the change in costs
much additional cost is required to obtain additional divided by the change in health benefit when 2 strategies
health benefits, provides a key measure of the value of a are compared (see the Appendix for more detail).
health care intervention. Health benefit can be measured in many ways, includ-
ing conditions diagnosed or prevented or life-years or
quality-adjusted life-years (QALYs) gained. A QALY is an
RATIONALE FOR HIGH-VALUE CARE: HIGH COSTS AND important metric that is calculated by assessing how long a
UNSUSTAINABLE COST INCREASES person lives and how persons assess quality of life during
As the health care reform debate highlights, health care their lifetime (7). They are useful in measuring health ben-
costs are high and are increasing at a rate that could po- efits because they take into account the benefits from
tentially bankrupt the federal government and devastate longer life or better quality of life. They are also useful
family budgets. Thus, health care resources necessarily will because the benefits from cancer treatment, coronary artery
be limited. An important rationale for the delivery of high- bypass surgery, or screening for HIV can all be expressed
value health care is to preserve the delivery of interven- in terms of QALYs. Thus, we can compare the cost-
tions that do provide good value. Discussions of cost- effectiveness of interventions for treating cancer or heart
effectiveness analysis, especially in the political discourse disease or of preventive interventions.
surrounding health care reform, often devolved into discus- The cost-effectiveness ratio is expressed in dollars per
sions about rationing, along with statements (presented health outcome, such as dollars per life-year gained, per
without evidence) that using cost-effectiveness analyses infection prevented, or per condition diagnosed. For exam-
would promote rationing. However, the term rationing as ple, the cost-effectiveness of HIV screening could be ex-
used in these debates implicitly refers to restricting the use pressed as $15 000 per QALY gained. Therefore, imple-
of any intervention, regardless of its effectiveness or value. menting HIV screening in a setting in which it was not
If rationing is more appropriately defined as restricting done previously would cost $15 000 for each additional
the use of effective, high-value care, we believe that using QALY gained from screening patients for and treating pa-
cost-effectiveness analyses may help avoid rationing. That tients with HIV.
is, we believe that the best way to avoid inadvertent reduc- Cost-effectiveness analysis is a powerful tool but raises
tions in effective and efficient care is to identify and elim- challenges in the evaluation of interventions. Evidence
inate wasteful practices and to demonstrate which inter- about effectiveness and harms may be of low quality or
ventions provide high value. inconclusive. Costs can vary substantially among practice
settings and may be difficult to obtain. Clinicians may lack
data on how health outcomes affect patients, such as the
COMPARATIVE EFFECTIVENESS AND COST-EFFECTIVENESS quality of life of persons in specific health states. However,
Health care reform has focused attention on, and sub- a carefully performed analysis highlights such issues and
stantially increased funding for, comparative effectiveness provides important insights about an intervention despite
research (CER). The Institute of Medicine defines CER as shortcomings of the available data.
“the generation and synthesis of evidence that compares
the benefits and harms of alternative methods to prevent, Understanding Benefit and Harms: Will an Intervention
diagnose, treat, and monitor a clinical condition or to im- Help or Hurt?
prove the delivery of care” (5) that identifies “what works Understanding the benefits and harms of the interven-
best for which patients under what circumstances” (5). The tion is central to assessing whether an intervention can
purpose of CER is to help patients, providers, and policy- provide high-value health care (8 –11). Comparative effec-
makers make more informed decisions about health care. tiveness research provides the foundation for this assess-
As some observers have commented, consumers often ment. Comparing strategies or therapies is particularly im-
know more about the pros, cons, and costs of televisions, portant, and CER directly addresses this comparison. Is
cars, and appliances than they do about health care inter- one strategy to manage lipid levels better than another
ventions. If CER also assesses utilization and costs, it can (12)? Does medical therapy or revascularization provide
further help provide a foundation for cost-effectiveness better outcomes in patients with ischemic heart disease
analysis (6). (13)? Identifying the populations in whom an intervention
www.annals.org 1 February 2011 Annals of Internal Medicine Volume 154 • Number 3 175
3. Clinical Guideline High-Value, Cost-Conscious Health Care
is successful and whether effectiveness differs between par- evidence by reviewing all relevant studies. They provide the
ticular subgroups also is important. For example, are per- basis for clinical guidelines developed by the ACP (17).
cutaneous interventions better than coronary artery bypass Systems for grading the quality of evidence also are
surgery in patients with diabetes (14, 15)? evolving (8 –11, 18 –25), led by such organizations as the
Different types of evidence may inform different as- Grading of Recommendations Assessment, Development
pects of comparative effectiveness. Randomized clinical tri- and Evaluation (GRADE) Working Group; the U.S. Pre-
als in selected populations may provide an estimate of effi- ventive Services Task Force; and the Agency for Healthcare
cacy, defined as the impact of the intervention under ideal Research and Quality (18). These systems help clinicians,
circumstances. However, to estimate efficacy, adherence to patients, and policymakers understand how much confi-
the intervention in the trial should be optimized to the dence they can have in the estimates of harms and benefits
extent possible; substantial rates of nonadherence will re- from the available literature.
sult in an underestimate of the efficacy of an intervention.
Randomized trials performed in circumstances and popu- Understanding Costs: Can an Expensive Drug Cost Less
lations that reflect how an intervention will be used in Than an Inexpensive Drug?
practice provide an estimate of effectiveness, defined as the The key principle in assessing costs is that the cost of
impact of the intervention under typical, rather than ideal, an intervention should include not only the cost of the
circumstances. intervention itself but also any downstream costs, defined as
Randomized trials or observational studies may pro- costs that occur as a result of the intervention. Down-
vide data on harms. Nonadherence in a randomized trial stream costs are included in this evaluation because they
could result in an underestimate of harms, because fewer would not have occurred had the intervention not been
patients would be exposed to the intervention. Because done. For example, the cost of an HIV screening program
some harms occur only rarely, large observational studies includes the cost not only of HIV testing but also of treat-
may be the best source of evidence for such harms (11). ing HIV in patients in whom HIV is diagnosed through
Finally, in considering harms, both short-term harms (for the screening program (26 –30).
example, an immediate adverse reaction to a drug) and Downstream costs may be very substantial, and an
long-term harms (for example, cancer induced by radiation analyst may underestimate the cost of an intervention if
from imaging studies [16]) are important to evaluate. The downstream costs are not included in an assessment. In a
net benefit of an intervention is the extent to which the program to screen surgeons for HIV to prevent transmis-
benefits outweigh the harms. sion of HIV to patients, treatment costs for surgeons rep-
Systematic reviews are a mainstay of CER. Organiza- resented approximately 30% of the total cost of the
tions that have led notable systematic reviews include the program (31). Another example is implantation of an im-
Evidence-based Practice Centers funded by the Agency for plantable cardioverter-defibrillator (ICD), which initially
Healthcare Research and Quality (8), the Cochrane Col- costs at least $30 000 to $50 000. Use of an ICD also costs
laboration, and the United Kingdom’s National Institute approximately $6600 per year after implantation, as well as
for Health and Clinical Excellence. Systematic reviews and additional costs for periodic replacement of the generator
meta-analyses provide a comprehensive assessment of the every 5 to 8 years, which costs approximately $18 000 or
more (32). Routine imaging for low back pain is expensive
in part because it may lead to subsequent treatment costs
Table 1. Cost-Effectiveness Analysis of Implantable from invasive procedures, including surgery (2).
Cardioverter-Defibrillators
In addition to downstream costs, downstream sav-
ings also should be considered when assessing the costs
Variable Description
of an intervention. For example, consider patients with
Population group Patients with a previous myocardial infarction nonvalvular atrial fibrillation who are candidates for an-
and an ejection fraction Ͻ0.30
Benefit A 31% reduction in total mortality over ticoagulation. Although use of warfarin involves ongo-
20-mo follow-up ing monitoring costs, the cost-savings from reduction in
Harms Lead failure or infection requiring
intervention (approximately 2%)
strokes more than outweigh the costs of the drug and
Peri-implantation mortality monitoring; therefore, use of warfarin reduces total costs
Net benefit Positive, with a large reduction in total in appropriate high-risk patients (33, 34). Warfarin also
mortality that outweighs harms
Approximate costs
costs less than aspirin in high-risk patients because of its
Implantation $30 000 greater effectiveness. Thus, a drug that is more expen-
Long-term costs $6600 per year sive (warfarin) can have lower long-term costs than a
Generator replacement $18 000 every 5 to 8 y
Balancing net benefit The estimate of cost-effectiveness relative to
less-expensive drug (aspirin). This example demon-
with costs medical therapy is $54 100 per quality- strates that appropriate evaluation of the cost of an in-
adjusted life-year gained tervention includes downstream costs and savings
Indicates good value in this patient
population (32) caused by the intervention, regardless of when these
costs and savings occur.
176 1 February 2011 Annals of Internal Medicine Volume 154 • Number 3 www.annals.org
4. High-Value, Cost-Conscious Health Care Clinical Guideline
Table 2. Cost, Benefit, and Value of Medical Interventions*
Cost Net Benefit† Value Example Interventions Study, Year (Reference)
High High High or low; depends on the relationship High value: ICDs Sanders et al, 2005 (32)
of costs and benefits High value: ART for HIV Freedberg et al, 2001 (36)
Low High Usually high High value: HIV screening‡ Sanders et al, 2005 (26)
Paltiel et al, 2005 (27)
Paltiel et al, 2006 (28)
Sanders et al, 2008 (29)
Walensky et al, 2007 (30)
High value: H1N1 influenza Khazeni et al, 2009 (37)
vaccination
High Low Usually low Low value: routine MRI for low back Chou et al, 2007 (1)
pain
Low Low High or low; depends on the relationship Low value: annual Papanicolaou Brown and Garber, 1999 (35)
of costs and benefits smears§
Low value: screening surgeons for Owens et al, 1995 (31)
HIV to prevent transmission to
patients
Intermediate High, intermediate, High or low; depends on the relationship See a registry of cost-effectiveness The Center for the Evaluation of
or low of costs and benefits for examples Value and Risk in Health (38)
ART ϭ antiretroviral therapy; ICD ϭ implantable cardioverter-defibrillator; MRI ϭ magnetic resonance imaging.
* The table groups interventions into categories (high, low, and intermediate) for the purpose of illustration; in practice, costs, net benefit, and value vary along a continuum.
† The degree to which benefits outweigh harms.
‡ High benefit for patients in whom HIV was diagnosed.
§ Compared with Papanicolaou smears every 3 y.
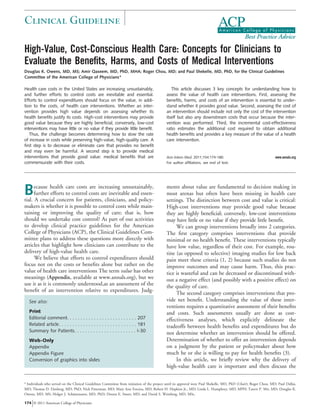
INTERPRETING COST-EFFECTIVENESS ANALYSIS: WHAT IS These concepts are demonstrated in the Figure, which
HIGH-VALUE CARE? shows 4 interventions represented by circles A through D.
The question of how to assess whether interventions Intervention A dominates intervention D because interven-
that provide more benefits than harms provide high value
occurs when one intervention is both more effective and
Figure. Costs and benefits of 4 hypothetical interventions.
more costly than an alternative intervention (29, 35–38).
For example, use of ICDs is more effective in preventing
sudden cardiac death than medical management in selected
patient populations (Tables 1 and 2). Whether the inter- $65 000/QALY C
vention is worth the additional expense is most commonly
answered by estimating the incremental cost-effectiveness B
ratio (39), which is a measure of value. The ratio denotes
$25 000/QALY
how much additional money is required to gain additional
health benefit when we move from a strategy that is less
QALYs
effective to a strategy that is more effective. Table 2 dem-
onstrates how cost, benefit, and value can vary among
interventions. A
If an analysis demonstrates that an intervention is both
better and less expensive than an alternative, we say that
D
the intervention dominates the alternative. As previously
noted, in patients who have nonvalvular atrial fibrillation
and are at high risk for stroke, warfarin dominates aspirin Cost, $
because it is more effective and has lower total costs than
aspirin (33, 34). Monitoring CD4 cell counts to manage As the line between interventions becomes more horizontal, the cost-
HIV in resource-limited settings, such as South Africa, im- effectiveness ratio becomes less favorable because costs are increasing
proves health outcomes and reduces long-term costs owing faster than benefits are. The slope of the line between 2 interventions
represents the reciprocal of the cost-effectiveness ratio. A lower incre-
to reduced hospitalization for opportunistic infection and mental cost-effectiveness ratio denotes more favorable cost-effectiveness.
therefore dominates antiretroviral management by clinical The lines between interventions A, B, and C are called the cost-
symptoms alone (40). In both examples, an intervention effectiveness frontier. Any intervention with costs and QALYs below and
to the right of the cost-effectiveness frontier would be dominated (such
with higher up-front costs reduces long-term costs because as intervention D), or less cost-effective than interventions on the fron-
of downstream savings related to the intervention. tier. QALY ϭ quality-adjusted life-year.
www.annals.org 1 February 2011 Annals of Internal Medicine Volume 154 • Number 3 177
5. Clinical Guideline High-Value, Cost-Conscious Health Care
tion A is both more effective and less expensive than inter- averse to the risk for mortality and morbidity would be
vention D. Therefore, we would not choose intervention D more willing to pay for health care and thus have a higher
if intervention A is a possibility. Intervention B is more cost-effectiveness threshold. Garber and Phelps’ analysis in-
effective than intervention A but is also more expensive; dicates that in a heterogeneous population (with varying
the incremental cost-effectiveness ratio of intervention B values about health, money, and risk), use of a single cost-
relative to intervention A is $25 000 per QALY gained. effectiveness threshold would cause some persons to receive
Thus, moving from intervention A to intervention B more health care than they would choose and others to
would cause additional health benefit, and each additional receive less.
QALY gained would require $25 000 in additional expen- The literature often cites a cost-effectiveness threshold
ditures. Intervention C is more effective and more expen- of $50 000 per QALY gained (44). This value, which has
sive than intervention B and costs $65 000 per QALY neither theoretical nor empirical justification, was intro-
gained compared with intervention B. duced in 1982 (45) and, if adjusted to current dollars,
would be more than $120 000 per QALY gained. A recent
The Cost-Effectiveness Threshold: How Much Is analysis that evaluated the cost and benefits of modern
Health Worth? health care in the United States found that people have
Which intervention to choose in the Figure depends been willing to pay for health care that costs approximately
on the decision maker’s cost-effectiveness threshold. That $109 000 per QALY or more (44), which is substantially
is, is the decision maker willing to pay $50 000, $100 000, higher than the $50 000 threshold. Whether this is a true
or more for an additional QALY? The choice of a cost- reflection of societal preferences given the multiple factors
effectiveness threshold is itself a value judgment by the that determine health care spending is not clear (46).
decision maker and depends on several factors (3, 41), in- In general, most decision makers in the United States
cluding who the decision maker is. Different decision mak- will conclude that interventions that cost less than $50 000
ers may have different cost-effectiveness thresholds. A con- to $60 000 per QALY gained provide high value. How-
sumer who is trying to decide whether to pay for a more ever, the often-cited threshold of $50 000 per QALY
expensive drug may be more or less willing to pay for the gained may be lower than what many decision makers
drug than an insurance company, another payer, or the would choose. Our goal is not to specify a particular
government would be. threshold, but to recognize that decision makers will need
If the government is the decision maker, the cost- to choose a threshold that is consistent with their values
effectiveness threshold would reflect the consensus prefer- and resources.
ences of the citizens. In the United States, no such consen-
sus exists. In the United Kingdom, the National Health Best Practice Advice for Providing High-Value
Service decides whether to pay for health interventions; Health Care
cost-effectiveness analyses performed by the National Insti- A first step toward providing high-value health care is
tute for Health and Clinical Excellence also often inform to decrease or discontinue the use of interventions that
these decisions. The cost-effectiveness threshold reflected provide no benefit, such as routine rather than selective
in these assessments is often between £20 000 and £30 000 imaging in patients with low back pain (1, 2). While de-
(approximately $30 000 to $50 000) per QALY gained veloping guidelines for the ACP, we will highlight inter-
(42). The World Health Organization suggests that inter- ventions that provide little or no benefit and, thus, are
ventions that cost less than 3 times the per capita gross likely to be of low value.
domestic product per disability-adjusted life-year gained A second step is to ensure that we provide interven-
are cost-effective and that interventions that cost less than tions that are both effective and decrease costs, such as the
the per capita gross domestic product are very cost-effective use of warfarin in high-risk patients with nonvalvular atrial
(43). fibrillation. In the United Kingdom, the National Institute
The choice of a particular decision maker’s cost- for Health and Clinical Excellence has identified numerous
effectiveness threshold depends on the decision maker’s guidance recommendations that may decrease costs, such
willingness to pay for better health outcomes, which in as better selection of antihypertensive drugs (47). A registry
turn depends on how he or she values heath outcomes and of cost-effectiveness analyses also contains interventions
money (3, 41). As evidenced by consumers’ choices of dif- that are cost-saving (38).
ferently priced health insurance plans, people value health For interventions that provide additional benefit at ad-
differently. Garber and Phelps (41) used economic princi- ditional cost, we recommend assessing their value to pa-
ples to demonstrate that, on the basis of plausible assump- tients and society by using cost-effectiveness analyses. Such
tions about values and risk attitudes, a cost-effectiveness analyses require specialized expertise and training, are often
threshold in the range of twice a person’s annual income is expensive, and thus are typically performed by investiga-
reasonable. Another important determinant of a person’s tors. The ACP has previously recommended the inclusion
choice of a cost-effectiveness threshold is his or her attitude of cost-effectiveness analysis in CER (48), and we reiterate
about risk (41). All else being equal, a person who is more the importance of the development of such evidence:
178 1 February 2011 Annals of Internal Medicine Volume 154 • Number 3 www.annals.org
6. High-Value, Cost-Conscious Health Care Clinical Guideline
Evaluation of the cost-effectiveness of interventions pro- agnosis and treatment of low back pain: a joint clinical practice guideline from the
American College of Physicians and the American Pain Society. Ann Intern Med.
vides important additional information for patients and 2007;147:478-91. [PMID: 17909209]
clinicians. 2. Chou R, Qaseem A, Owens DK, Shekelle P; Clinical Guidelines Committee
We emphasize that the cost-effectiveness of an in- of the American College of Physicians. Diagnostic imaging for low back pain:
tervention should not solely determine its use. There advice for high-value health care from the American College of Physicians. Ann
Intern Med. 2011;154:181-9.
may be ethical or justice-related reasons to provide in- 3. Owens DK. Interpretation of cost-effectiveness analyses [Editorial]. J Gen
terventions that do not achieve generally accepted levels of Intern Med. 1998;13:716-7. [PMID: 9798822]
cost-effectiveness; such considerations may outweigh eco- 4. Fuchs VR. New priorities for future biomedical innovations. N Engl J Med.
nomic concerns. However, we argue that cost-effectiveness 2010;363:704-6. [PMID: 20818873]
5. Institute of Medicine. Initial National Priorities for Comparative Effectiveness
should be one factor among others that receives consider- Research. Accessed at www.iom.edu/Reports/2009/ComparativeEffectiveness
ation. Higher-cost care does not always mean greater ben- ResearchPriorities.aspx on 4 May 2010.
efit for patients; therefore, we should focus on the value 6. Garber AM, Sox HC. The role of costs in comparative effectiveness research.
that care provides. Health Aff (Millwood). 2010;29:1805-11. [PMID: 20921479]
7. Gold M, Siegel JE, Russell LB, Weinstein MC. Cost-Effectiveness in Health
and Medicine. New York: Oxford Univ Pr; 1996.
CONCLUSION 8. Slutsky J, Atkins D, Chang S, Sharp BA. AHRQ series paper 1: comparing
medical interventions: AHRQ and the effective health-care program. J Clin Epi-
The unsustainable increase in health care costs will demiol. 2010;63:481-3. [PMID: 18834715]
continue to cause profound changes in health care delivery. 9. Helfand M, Balshem H. AHRQ series paper 2: principles for developing
To preserve quality, we recommend careful assessment of guidance: AHRQ and the effective health-care program. J Clin Epidemiol. 2010;
both benefits and costs of interventions rather than focus- 63:484-90. [PMID: 19716268]
10. Whitlock EP, Lopez SA, Chang S, Helfand M, Eder M, Floyd N. AHRQ
ing on either aspect alone. Evaluation of the effectiveness series paper 3: identifying, selecting, and refining topics for comparative effective-
of interventions should include an analysis of both benefits ness systematic reviews: AHRQ and the effective health-care program. J Clin
and harms and use the best available evidence for each. Epidemiol. 2010;63:491-501. [PMID: 19540721]
In assessing the costs of an intervention, we should 11. Chou R, Aronson N, Atkins D, Ismaila AS, Santaguida P, Smith DH, et al.
AHRQ series paper 4: assessing harms when comparing medical interventions:
consider its downstream costs and savings. For interven- AHRQ and the effective health-care program. J Clin Epidemiol. 2010;63:502-
tions that are better but cost more, we should evaluate their 12. [PMID: 18823754]
cost-effectiveness, an important approach to assessment of 12. Sharma M, Ansari MT, Soares-Weiser K, Abousetta AM, Ooi TC, Sears
value. Considerations of equity or ethics may primarily M, et al; Agency for Healthcare Research and Quality. Comparative Effective-
ness of Lipid-Modifying Agents. Comparative Effectiveness Review No. 16. Pub-
determine an intervention’s use in certain situations, but lished September 2009. Accessed at www.effectivehealthcare.ahrq.gov/reports
value will be highly relevant for many interventions. The /final.cfm on 9 December 2010.
successful delivery of high-value care will depend greatly on 13. Boden WE, O’Rourke RA, Teo KK, Hartigan PM, Maron DJ, Kostuk WJ,
developing evidence to help understand which services pro- et al; COURAGE Trial Research Group. Optimal medical therapy with or
without PCI for stable coronary disease. N Engl J Med. 2007;356:1503-16.
vide good value and on engaging clinicians (49), policy- [PMID: 17387127]
makers, and patients in efforts to promote high-value care. 14. Bravata DM, Gienger AL, McDonald KM, Sundaram V, Perez MV,
Varghese R, et al. Systematic review: the comparative effectiveness of percutane-
From Veterans Affairs Palo Alto Health Care System, Palo Alto, Califor- ous coronary interventions and coronary artery bypass graft surgery. Ann Intern
nia; Stanford University, Stanford, California; American College of Phy- Med. 2007;147:703-16. [PMID: 17938385]
sicians, Philadelphia, Pennsylvania; Oregon Health & Science Univer- 15. Hlatky MA, Boothroyd DB, Bravata DM, Boersma E, Booth J, Brooks
MM, et al. Coronary artery bypass surgery compared with percutaneous coronary
sity, Portland, Oregon; and West Los Angeles Medical Center, Los
interventions for multivessel disease: a collaborative analysis of individual patient
Angeles, California.
data from ten randomised trials. Lancet. 2009;373:1190-7. [PMID: 19303634]
16. Smith-Bindman R, Lipson J, Marcus R, Kim KP, Mahesh M, Gould R,
Disclaimer: The views expressed in this article are those of the authors et al. Radiation dose associated with common computed tomography examina-
and do not necessarily reflect the position or policy of the Department of tions and the associated lifetime attributable risk of cancer. Arch Intern Med.
Veterans Affairs or the U.S. government. 2009;169:2078-86. [PMID: 20008690]
17. Qaseem A, Snow V, Owens DK, Shekelle P; Clinical Guidelines Commit-
Potential Conflicts of Interest: Disclosures can be viewed at www.acponline tee of the American College of Physicians. The development of clinical practice
.org/authors/icmje/ConflictOfInterestForms.do?msNumϭM10-1694. guidelines and guidance statements of the American College of Physicians: sum-
mary of methods. Ann Intern Med. 2010;153:194-9. [PMID: 20679562]
18. Owens DK, Lohr KN, Atkins D, Treadwell JR, Reston JT, Bass EB, et al.
Requests for Single Reprints: Amir Qaseem, MD, PhD, MHA, Amer- AHRQ series paper 5: grading the strength of a body of evidence when compar-
ican College of Physicians, 190 N. Independence Mall West, Philadel- ing medical interventions—agency for healthcare research and quality and the
phia, PA 19106; e-mail, aqaseem@acponline.org. effective health-care program. J Clin Epidemiol. 2010;63:513-23. [PMID:
19595577]
Current author addresses and author contributions are available at www 19. Brozek JL, Akl EA, Jaeschke R, Lang DM, Bossuyt P, Glasziou P, et al;
.annals.org. GRADE Working Group. Grading quality of evidence and strength of recom-
mendations in clinical practice guidelines: Part 2 of 3. The GRADE approach to
grading quality of evidence about diagnostic tests and strategies. Allergy. 2009;
64:1109-16. [PMID: 19489757]
References 20. Brozek JL, Akl EA, Alonso-Coello P, Lang D, Jaeschke R, Williams JW,
1. Chou R, Qaseem A, Snow V, Casey D, Cross JT Jr, Shekelle P, et al; Clinical et al; GRADE Working Group. Grading quality of evidence and strength of
Efficacy Assessment Subcommittee of the American College of Physicians. Di- recommendations in clinical practice guidelines. Part 1 of 3. An overview of the
www.annals.org 1 February 2011 Annals of Internal Medicine Volume 154 • Number 3 179
7. Clinical Guideline High-Value, Cost-Conscious Health Care
GRADE approach and grading quality of evidence about interventions. Allergy. 34. Eckman MH, Rosand J, Greenberg SM, Gage BF. Cost-effectiveness of
2009;64:669-77. [PMID: 19210357] using pharmacogenetic information in warfarin dosing for patients with nonval-
21. Guyatt GH, Oxman AD, Kunz R, Jaeschke R, Helfand M, Liberati A, et al; vular atrial fibrillation. Ann Intern Med. 2009;150:73-83. [PMID: 19153410]
GRADE Working Group. Incorporating considerations of resources use into 35. Brown AD, Garber AM. Cost-effectiveness of 3 methods to enhance the
grading recommendations. BMJ. 2008;336:1170-3. [PMID: 18497416] sensitivity of Papanicolaou testing. JAMA. 1999;281:347-53. [PMID: 9929088]
22. Schunemann HJ, Schunemann AH, Oxman AD, Brozek J, Glasziou P,
¨ ¨ 36. Freedberg KA, Losina E, Weinstein MC, Paltiel AD, Cohen CJ, Seage GR,
Jaeschke R, et al; GRADE Working Group. Grading quality of evidence and et al. The cost effectiveness of combination antiretroviral therapy for HIV disease.
strength of recommendations for diagnostic tests and strategies. BMJ. 2008;336: N Engl J Med. 2001;344:824-31. [PMID: 11248160]
1106-10. [PMID: 18483053] 37. Khazeni N, Hutton DW, Garber AM, Hupert N, Owens DK. Effectiveness
23. Guyatt GH, Oxman AD, Kunz R, Falck-Ytter Y, Vist GE, Liberati A, et al; and cost-effectiveness of vaccination against pandemic influenza (H1N1) 2009.
GRADE Working Group. Going from evidence to recommendations. BMJ. Ann Intern Med. 2009;151:829-39. [PMID: 20008759]
2008;336:1049-51. [PMID: 18467413] 38. The Center for the Evaluation of Value and Risk in Health. Cost-
24. Guyatt GH, Oxman AD, Kunz R, Vist GE, Falck-Ytter Y, Schunemann ¨ Effectiveness Analysis (CEA) Registry. Accessed at https://research.tufts-nemc.org
HJ; GRADE Working Group. What is “quality of evidence” and why is it /cear/default.aspx on 22 September 2010.
important to clinicians? BMJ. 2008;336:995-8. [PMID: 18456631] 39. Detsky AS, Naglie IG. A clinician’s guide to cost-effectiveness analysis. Ann
25. Guyatt GH, Oxman AD, Vist GE, Kunz R, Falck-Ytter Y, Alonso-Coello Intern Med. 1990;113:147-54. [PMID: 2113784]
P, et al; GRADE Working Group. GRADE: an emerging consensus on rating 40. Bendavid E, Young SD, Katzenstein DA, Bayoumi AM, Sanders GD,
quality of evidence and strength of recommendations. BMJ. 2008;336:924-6. Owens DK. Cost-effectiveness of HIV monitoring strategies in resource-limited
[PMID: 18436948] settings: a southern African analysis. Arch Intern Med. 2008;168:1910-8.
26. Sanders GD, Bayoumi AM, Sundaram V, Bilir SP, Neukermans CP, Ry- [PMID: 18809819]
dzak CE, et al. Cost-effectiveness of screening for HIV in the era of highly active 41. Garber AM, Phelps CE. Economic foundations of cost-effectiveness analysis.
antiretroviral therapy. N Engl J Med. 2005;352:570-85. [PMID: 15703422] J Health Econ. 1997;16:1-31. [PMID: 10167341]
27. Paltiel AD, Weinstein MC, Kimmel AD, Seage GR 3rd, Losina E, Zhang 42. National Institute for Health and Clinical Excellence. Guide to the Methods
H, et al. Expanded screening for HIV in the United States—an analysis of of Technology Appraisal. Published June 2008. Accessed at www.nice.org.uk
cost-effectiveness. N Engl J Med. 2005;352:586-95. [PMID: 15703423] /media/B52/A7/TAMethodsGuideUpdatedJune2008.pdf on 9 December 2010.
28. Paltiel AD, Walensky RP, Schackman BR, Seage GR 3rd, Mercincavage 43. Hutubessy R, Chisholm D, Edejer TT. Generalized cost-effectiveness anal-
LM, Weinstein MC, et al. Expanded HIV screening in the United States: effect ysis for national-level priority-setting in the health sector. Cost Eff Resour Alloc.
on clinical outcomes, HIV transmission, and costs. Ann Intern Med. 2006;145: 2003;1:8. [PMID: 14687420]
797-806. [PMID: 17146064] 44. Braithwaite RS, Meltzer DO, King JT Jr, Leslie D, Roberts MS. What does
29. Sanders GD, Bayoumi AM, Holodniy M, Owens DK. Cost-effectiveness of the value of modern medicine say about the $50,000 per quality-adjusted life-year
HIV screening in patients older than 55 years of age. Ann Intern Med. 2008; decision rule? Med Care. 2008;46:349-56. [PMID: 18362813]
148:889-903. [PMID: 18559840] 45. Ubel PA, Hirth RA, Chernew ME, Fendrick AM. What is the price of life
30. Walensky RP, Freedberg KA, Weinstein MC, Paltiel AD. Cost-effectiveness and why doesn’t it increase at the rate of inflation? Arch Intern Med. 2003;163:
of HIV testing and treatment in the United States. Clin Infect Dis. 2007;45 1637-41. [PMID: 12885677]
Suppl 4:S248-54. [PMID: 18190295] 46. Weinstein MC. How much are Americans willing to pay for a quality-
31. Owens DK, Harris RA, Scott PM, Nease RF Jr. Screening surgeons for HIV adjusted life year? [Editorial]. Med Care. 2008;46:343-5. [PMID: 18362811]
infection. A cost-effectiveness analysis. Ann Intern Med. 1995;122:641-52. 47. National Institute for Health and Clinical Excellence. Cost saving guid-
[PMID: 7702225] ance. Accessed at www.nice.org.uk/usingguidance/benefitsofimplementation
32. Sanders GD, Hlatky MA, Owens DK. Cost-effectiveness of implantable /costsavingguidance.jsp on 22 September 2010.
cardioverter-defibrillators. N Engl J Med. 2005;353:1471-80. [PMID: 48. American College of Physicians. Information on cost-effectiveness: an essen-
16207849] tial product of a national comparative effectiveness program. Ann Intern Med.
33. Gage BF, Cardinalli AB, Albers GW, Owens DK. Cost-effectiveness of 2008;148:956-61. [PMID: 18483128]
warfarin and aspirin for prophylaxis of stroke in patients with nonvalvular atrial 49. Fuchs VR. Eliminating “waste” in health care. JAMA. 2009;302:2481-2.
fibrillation. JAMA. 1995;274:1839-45. [PMID: 7500532] [PMID: 19996406]
180 1 February 2011 Annals of Internal Medicine Volume 154 • Number 3 www.annals.org
8. Annals of Internal Medicine
Current Author Addresses: Dr. Owens: Stanford University, 117 En-
cina Commons, Stanford, CA 94305. Appendix Figure. Extended dominance.
Dr. Qaseem: American College of Physicians, 190 N. Independence
Mall West, Philadelphia, PA 19106.
Dr. Chou: Oregon Health & Science University, 3181 SW Sam Jackson
Park Road, Mail Code BICC, Portland, OR 97239. $65 000/QALY C
Dr. Shekelle: West Los Angeles Veterans Affairs Medical Center, 11301
Wilshire Boulevard, Los Angeles, CA 90073. B
Author Contributions: Conception and design: D.K. Owens, $25 000/QALY
A. Qaseem, P. Shekelle.
QALYs
$15 000/QALY
Analysis and interpretation of the data: D.K. Owens, A. Qaseem.
Drafting of the article: D.K. Owens, A. Qaseem.
Critical revision for important intellectual content: D.K. Owens, E
A. Qaseem, R. Chou, P. Shekelle. A
Final approval of the article: D.K. Owens, A. Qaseem, R. Chou, $35 000/QALY
P. Shekelle.
D
Statistical expertise: D.K. Owens, A. Qaseem.
Obtaining of funding: A. Qaseem.
Administrative, technical, or logistic support: A. Qaseem.
Cost, $
APPENDIX The cost-effectiveness ratios of interventions are shown on the lines be-
Value tween the interventions. Intervention E costs $35 000 per QALY gained
We use value to reflect an assessment of whether the benefits relative to intervention A. Intervention B costs $15 000 per QALY
gained relative to intervention E. Intervention D is dominated. Interven-
of an intervention justify its costs. Value is sometimes used in the tion E can be eliminated through extended dominance. QALY ϭ
decision-making and quality-of-life literature to refer to the im- quality-adjusted life-year.
portance that patients (or society) place on a health state.
resources required to adopt a strategy and should not be used for
Cost–Benefit Analysis decision making.
Cost– benefit analysis differs from cost-effectiveness analysis
in that health outcomes are also expressed in dollars rather than Dominance and Extended Dominance
in units of health. Thus, both the costs and the benefits of an The Figure demonstrates the concept of dominance. A
intervention are expressed in dollars, and determining whether dominated intervention is more expensive and less effective than
the benefits outweigh the costs is clear. Alternative methods are another intervention. The Appendix Figure denotes another pos-
available for assessing health benefits in terms of dollars; however, sible situation in which we show interventions A, B, C, and D as
because of the challenges inherent in assigning a monetary value in the Figure, but we now also include intervention E, which is
to health outcomes, cost– benefit analysis has been used less fre- to the right and below the cost-effectiveness frontier.
quently than cost-effectiveness analysis in health care settings. In the Appendix Figure, intervention E is better than inter-
vention A and more expensive but not as good or costly as
Incremental Cost-Effectiveness Ratio intervention B. Unlike intervention D, which is dominated, no
The incremental cost-effectiveness ratio is defined as the dif- intervention is both better and less expensive than intervention E.
ference in costs divided by the difference in health benefit when In general, we would never choose intervention E; if our cost-
2 strategies are compared. For example, an analysis evaluating the effectiveness threshold were more than $35 000 per QALY
cost-effectiveness of ICDs compared with medical therapy would gained, which would be necessary to choose intervention E over
use the following formula to determine the incremental cost- intervention A, we would always choose intervention B, which is
effectiveness ratio: better than intervention E and more cost effective ($25 000 per
Costs With ICD Ϫ Costs With Medical Therapy QALY gained rather than $35 000 per QALY gained). In this
situation, we say that intervention E should not be chosen
Benefit (QALYs) With ICD Ϫ Benefit (QALYs)
because we can eliminate it through extended dominance. In
With Medical Therapy
summary, we would not choose intervention D because inter-
It is important to distinguish the incremental cost-effectiveness vention A is better and less expensive (strict dominance), and
ratio from the average cost-effectiveness ratio; the latter is simply we would not choose intervention E because intervention B is
the cost of an intervention divided by the benefit. The average better and has a more favorable cost-effectiveness ratio (ex-
cost-effectiveness ratio can provide misleading estimates of the tended dominance).
W-58 1 February 2011 Annals of Internal Medicine Volume 154 • Number 3 www.annals.org