New 2024 Cannabis Edibles Investor Pitch Deck Template
Impact Of Foreclosures On Home Prices
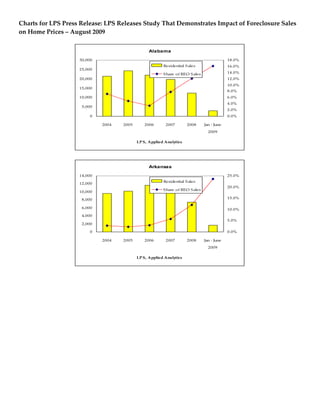
1. Charts for LPS Press Release: LPS Releases Study That Demonstrates Impact of Foreclosure Sales
on Home Prices – August 2009
Alabama
30,000 18.0%
Residential S ales 16.0%
25,000
S hare o f REO S ales 14.0%
20,000 12.0%
10.0%
15,000
8.0%
10,000 6.0%
4.0%
5,000
2.0%
0 0.0%
2004 2005 2006 2007 2008 Jan - June
2009
LP S, Applied Analytics
Arkansas
14,000 25.0%
Residential S ales
12,000
20.0%
S hare o f REO S ales
10,000
8,000 15.0%
6,000 10.0%
4,000
5.0%
2,000
0 0.0%
2004 2005 2006 2007 2008 Jan - June
2009
LP S, Applied Analytics
2. Arizona
250,000 60.0%
Residential S ales
50.0%
200,000
S hare o f REO S ales
40.0%
150,000
30.0%
100,000
20.0%
50,000
10.0%
0 0.0%
2004 2005 2006 2007 2008 Jan - June
2009
LP S, Applied Analytics
California
800,000 60.0%
700,000 Residential S ales
50.0%
600,000 S hare o f REO S ales
40.0%
500,000
400,000 30.0%
300,000
20.0%
200,000
10.0%
100,000
0 0.0%
2004 2005 2006 2007 2008 Jan - June
2009
LP S, Applied Analytics
3. District of Columbia
8,000 20.0%
7,000 Residential S ales
6,000 S hare o f REO S ales 15.0%
5,000
4,000 10.0%
3,000
2,000 5.0%
1,000
0 0.0%
2004 2005 2006 2007 2008 Jan - June
2009
LP S, Applied Analytics
Connecticut
60,000 16.0%
Residential S ales 14.0%
50,000
S hare o f REO S ales 12.0%
40,000
10.0%
30,000 8.0%
6.0%
20,000
4.0%
10,000
2.0%
0 0.0%
2004 2005 2006 2007 2008 Jan - June
2009
LP S, Applied Analytics
4. Colorado
140,000 35.0%
Residential S ales
120,000 30.0%
S hare o f REO S ales
100,000 25.0%
80,000 20.0%
60,000 15.0%
40,000 10.0%
20,000 5.0%
0 0.0%
2004 2005 2006 2007 2008 Jan - June
2009
LP S, Applied Analytics
Delaware
14,000 12.0%
Residential S ales
12,000 10.0%
S hare o f REO S ales
10,000
8.0%
8,000
6.0%
6,000
4.0%
4,000
2,000 2.0%
0 0.0%
2004 2005 2006 2007 2008 Jan - June
2009
LP S, Applied Analytics
5. Georgia
160,000 25.0%
140,000 Residential S ales
20.0%
120,000 S hare o f REO S ales
100,000 15.0%
80,000
60,000 10.0%
40,000
5.0%
20,000
0 0.0%
2004 2005 2006 2007 2008 Jan - June
2009
LP S, Applied Analytics
Florida
700,000 40.0%
Residential S ales 35.0%
600,000
S hare o f REO S ales 30.0%
500,000
25.0%
400,000
20.0%
300,000
15.0%
200,000
10.0%
100,000 5.0%
0 0.0%
2004 2005 2006 2007 2008 Jan - June
2009
LP S, Applied Analytics
6. Hawaii
30,000 10.0%
Residential S ales
25,000
8.0%
S hare o f REO S ales
20,000
6.0%
15,000
4.0%
10,000
2.0%
5,000
0 0.0%
2004 2005 2006 2007 2008 Jan - June
2009
LP S, Applied Analytics
Iowa
16,000 9.0%
14,000 Residential S ales 8.0%
12,000 S hare o f REO S ales 7.0%
6.0%
10,000
5.0%
8,000
4.0%
6,000
3.0%
4,000 2.0%
2,000 1.0%
0 0.0%
2004 2005 2006 2007 2008 Jan - June
2009
LP S, Applied Analytics
7. Illinois
200,000 35.0%
Residential S ales
30.0%
150,000 S hare o f REO S ales
25.0%
20.0%
100,000
15.0%
10.0%
50,000
5.0%
0 0.0%
2004 2005 2006 2007 2008 Jan - June
2009
LP S, Applied Analytics
Kentucky
20,000 35.0%
Residential S ales
30.0%
15,000 S hare o f REO S ales
25.0%
20.0%
10,000
15.0%
10.0%
5,000
5.0%
0 0.0%
2004 2005 2006 2007 2008 Jan - June
2009
LP S, Applied Analytics
8. Massachusetts
100,000 16.0%
Residential S ales 14.0%
80,000
S hare o f REO S ales 12.0%
60,000 10.0%
8.0%
40,000 6.0%
4.0%
20,000
2.0%
0 0.0%
2004 2005 2006 2007 2008 Jan - June
2009
LP S, Applied Analytics
Maryland
180,000 16.0%
160,000 Residential S ales 14.0%
140,000 S hare o f REO S ales 12.0%
120,000
10.0%
100,000
8.0%
80,000
6.0%
60,000
40,000 4.0%
20,000 2.0%
0 0.0%
2004 2005 2006 2007 2008 Jan - June
2009
LP S, Applied Analytics
9. Michigan
160,000 70.0%
140,000 Residential S ales
60.0%
120,000 S hare o f REO S ales
50.0%
100,000
40.0%
80,000
30.0%
60,000
20.0%
40,000
20,000 10.0%
0 0.0%
2004 2005 2006 2007 2008 Jan - June
2009
LP S, Applied Analytics
Minnesota
80,000 50.0%
70,000 Residential S ales
40.0%
60,000 S hare o f REO S ales
50,000 30.0%
40,000
30,000 20.0%
20,000
10.0%
10,000
0 0.0%
2004 2005 2006 2007 2008 Jan - June
2009
LP S, Applied Analytics
10. North Carolina
160,000 16.0%
140,000 Residential S ales 14.0%
120,000 S hare o f REO S ales 12.0%
100,000 10.0%
80,000 8.0%
60,000 6.0%
40,000 4.0%
20,000 2.0%
0 0.0%
2004 2005 2006 2007 2008 Jan - June
2009
LP S, Applied Analytics
Nebraska
10,000 9.0%
Residential S ales 8.0%
8,000 7.0%
S hare o f REO S ales
6.0%
6,000
5.0%
4.0%
4,000
3.0%
2,000 2.0%
1.0%
0 0.0%
2004 2005 2006 2007 2008 Jan - June
2009
LP S, Applied Analytics
11. New Hampshire
9,000 16.0%
8,000 Residential S ales 14.0%
7,000 S hare o f REO S ales 12.0%
6,000
10.0%
5,000
8.0%
4,000
6.0%
3,000
2,000 4.0%
1,000 2.0%
0 0.0%
2004 2005 2006 2007 2008 Jan - June
2009
LP S, Applied Analytics
New Jersey
180,000 12.0%
160,000 Residential S ales
10.0%
140,000 S hare o f REO S ales
120,000 8.0%
100,000
6.0%
80,000
60,000 4.0%
40,000
2.0%
20,000
0 0.0%
2004 2005 2006 2007 2008 Jan - June
2009
LP S, Applied Analytics
12. Nevada
120,000 70.0%
Residential S ales
100,000 60.0%
S hare o f REO S ales
50.0%
80,000
40.0%
60,000
30.0%
40,000
20.0%
20,000 10.0%
0 0.0%
2004 2005 2006 2007 2008 Jan - June
2009
LP S, Applied Analytics
New York
160,000 8.0%
140,000 Residential S ales 7.0%
120,000 S hare o f REO S ales 6.0%
100,000 5.0%
80,000 4.0%
60,000 3.0%
40,000 2.0%
20,000 1.0%
0 0.0%
2004 2005 2006 2007 2008 Jan - June
2009
LP S, Applied Analytics
13. Ohio
200,000 40.0%
Residential S ales 35.0%
150,000 S hare o f REO S ales 30.0%
25.0%
100,000 20.0%
15.0%
50,000 10.0%
5.0%
0 0.0%
2004 2005 2006 2007 2008 Jan - June
2009
LP S, Applied Analytics
Oklahoma
25,000 16.0%
Residential S ales 14.0%
20,000
S hare o f REO S ales 12.0%
15,000 10.0%
8.0%
10,000 6.0%
4.0%
5,000
2.0%
0 0.0%
2004 2005 2006 2007 2008 Jan - June
2009
LP S, Applied Analytics
14. Oregon
80,000 25.0%
70,000 Residential S ales
20.0%
60,000 S hare o f REO S ales
50,000 15.0%
40,000
30,000 10.0%
20,000
5.0%
10,000
0 0.0%
2004 2005 2006 2007 2008 Jan - June
2009
LP S, Applied Analytics
Pennsylvania
140,000 12.0%
Residential S ales
120,000 10.0%
S hare o f REO S ales
100,000
8.0%
80,000
6.0%
60,000
4.0%
40,000
20,000 2.0%
0 0.0%
2004 2005 2006 2007 2008 Jan - June
2009
LP S, Applied Analytics
15. Rhode Island
16,000 35.0%
14,000 Residential S ales
30.0%
12,000 S hare o f REO S ales
25.0%
10,000
20.0%
8,000
15.0%
6,000
10.0%
4,000
2,000 5.0%
0 0.0%
2004 2005 2006 2007 2008 Jan - June
2009
LP S, Applied Analytics
South Carolina
90,000 25.0%
80,000 Residential S ales
70,000 20.0%
S hare o f REO S ales
60,000
15.0%
50,000
40,000
10.0%
30,000
20,000 5.0%
10,000
0 0.0%
2004 2005 2006 2007 2008 Jan - June
2009
LP S, Applied Analytics
16. Tennessee
120,000 30.0%
Residential S ales
100,000 25.0%
S hare o f REO S ales
80,000 20.0%
60,000 15.0%
40,000 10.0%
20,000 5.0%
0 0.0%
2004 2005 2006 2007 2008 Jan - June
2009
LP S, Applied Analytics
Virginia
140,000 30.0%
Residential S ales
120,000 25.0%
S hare o f REO S ales
100,000
20.0%
80,000
15.0%
60,000
10.0%
40,000
20,000 5.0%
0 0.0%
2004 2005 2006 2007 2008 Jan - June
2009
LP S, Applied Analytics
17. Vermont
4,000 8.0%
3,500 Residential S ales 7.0%
3,000 S hare o f REO S ales 6.0%
2,500 5.0%
2,000 4.0%
1,500 3.0%
1,000 2.0%
500 1.0%
0 0.0%
2004 2005 2006 2007 2008 Jan - June
2009
LP S, Applied Analytics
Washington
140,000 18.0%
Residential S ales 16.0%
120,000
S hare o f REO S ales 14.0%
100,000
12.0%
80,000 10.0%
60,000 8.0%
6.0%
40,000
4.0%
20,000 2.0%
0 0.0%
2004 2005 2006 2007 2008 Jan - June
2009
LP S, Applied Analytics
18. Wisconsin
30,000 20.0%
Residential S ales
25,000
S hare o f REO S ales 15.0%
20,000
15,000 10.0%
10,000
5.0%
5,000
0 0.0%
2004 2005 2006 2007 2008 Jan - June
2009
LP S, Applied Analytics