Brent Woyat, portfolio manager at OceanForest Investment Partners, provides a quarterly commentary summarizing market performance in 2013 and outlining his investment strategy and outlook. US and global stock markets saw strong returns despite economic and political uncertainty. Woyat recommends sticking to investment plans and maintaining balanced portfolios with stock and bond allocations within established parameters. He advocates rebalancing to bring overweight equity positions back within guidelines and increasing geographic diversification outside of Canada.
Cheap Rate Call Girls In Noida Sector 62 Metro 959961乂3876
Brent woyat q3 2013 pimg commentary nov2013
1. OceanForest Investment Partners
Portfolio Managers Commentary – Q2 2012
Q3 2013
Sticking to the Plan!
“For every complex problem, there is an answer that is clear, simple, and wrong.”
– H.L. Mencken, 20th century American journalist
“Everyone has a plan until they get punched in the face.”
– Mike Tyson, former heavyweight champion of the world
As we enter the last quarter of 2013, I’m writing to summarize market performance since
the start of the year and to share my thoughts on positioning portfolios for the period
Brent Woyat, CIM, CMT
Portfolio Manager
ahead. This note addresses some concerns that clients have raised about the outlook for
Raymond James Ltd.
Suite 102 – 2168 Marine Dr.
West Vancouver, BC
V7V 1K3
to solid performance in the past, and that are at the core of my approach.
Tel: 604-921-9222
positive returns of 2012, with the exception of soft performance in emerging markets. Note
brent.woyat@raymondjames.ca
that while Canada showed positive returns, for the third year in a row it is significantly
www.ofip.ca
bonds, and whether stocks are overvalued. And I share two core principles that have led
First though, a quick recap of stock market performance in 2013 to date. Despite
turbulence from economic and political events, U.S. and global stock markets built on the
underperforming most major markets.
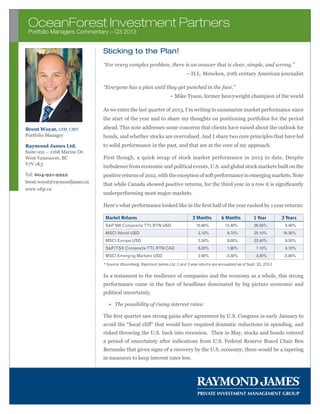
Here’s what performance looked like in the first half of the year ranked by 1 year returns:
Market Returns
3 Months
6 Months
1 Year
3 Years
10.90%
12.40%
26.50%
5.40%
MSCI World USD
3.10%
9.70%
25.10%
16.30%
MSCI Europe USD
5.50%
9.00%
23.40%
9.50%
S&P/TSX Composite TTL RTN CAD
6.20%
1.90%
7.10%
4.10%
MSCI Emerging Markets USD
2.90%
-3.30%
3.20%
-2.80%
S&P 500 Composite TTL RTN USD
* Source: Bloomberg, Raymond James Ltd. 1 and 3 year returns are annualized as of Sept. 30, 2013
In a testament to the resilience of companies and the economy as a whole, this strong
performance came in the face of headlines dominated by big picture economic and
political uncertainty.
• The possibility of rising interest rates:
The first quarter saw strong gains after agreement by U.S. Congress in early January to
avoid the “fiscal cliff” that would have required dramatic reductions in spending, and
risked throwing the U.S. back into recession. Then in May, stocks and bonds entered
a period of uncertainty after indications from U.S. Federal Reserve Board Chair Ben
Bernanke that given signs of a recovery by the U.S. economy, there would be a tapering
in measures to keep interest rates low.
2. OceanForest Investment Partners
Portfolio Managers Commentary – Q2 2012
Q3 2013
• Challenges for Europe and emerging markets:
While there were signs of improvement in Europe, the pace of that recovery continues to be disappointing. And as the
International Monetary Fund continued to reduce forecasts for global growth, stocks in emerging markets underperformed,
and countries such as India saw their currency under downward pressure.
• Renewed conflict in Washington:
In early October, we once again saw a stalemate in Washington, with uncertainty about raising the ceiling on U.S.
Government debt resulting in furloughs of non-essential government workers, and the risk that the U.S. will go into
technical default on its debt.
The Elements Of An Effective Plan
At the start of every relationship with my clients, we create a long-term plan that will look past short-term issues such
as we’ve seen this year. In developing that plan, my first step is to establish portfolio parameters based on each client’s
return requirements and risk appetite. In doing that, I’m guided in part by a 1963 talk by Benjamin Graham, the Columbia
University professor whose students included Warren Buffett and who is considered the father of value investing. Here’s
what Graham had to say about portfolio construction:
“An investor should maintain at all times some division of his funds between bonds and stocks. My suggestion is that
the minimum position of this portfolio held in common stocks should be 25% and the maximum should be 75%. Any
variation should be clearly based on value considerations, which would lead him to own more common stocks when
the market seems low in relation to value and less common stocks when the market seems high.”
That 25% to 75% range sets very broad parameters and yet today, some investors resist owning any bonds, while others
are out of stocks due to concerns about them being overvalued. Let’s review the issues around bond and stock valuations.
Are Bonds Too Risky?
Some investors have read descriptions of bonds as today’s riskiest asset class, and want to eliminate them from their
portfolio as a result. And certainly a significant increase in interest rates would create challenges for bond investors.
Despite that, I follow Benjamin Graham’s advice, and advise my clients to keep a bond component in their portfolios:
• As we saw in 2008, bonds can provide insurance against severe volatility in stock prices.
• Given low rates on short-term government bonds, investors can find better yielding alternatives on longer maturities,
in high quality corporate credits, and among some foreign governments with solid finances (although I am very
selective in those cases).
3. OceanForest Investment Partners
Portfolio Managers Commentary – Q2 2012
Q3 2013
• The concern about the impact on bonds if interest rates rise may be exaggerated, as there is growing sentiment that
weak economic growth will result in low interest rates for many years to come. One such view comes from Bill Gross
of Pacific Investment Management, today’s best known bond manager, who in a recent commentary, predicted that
today’s low rates will be with us until 2035.
To be clear, we should not overweight bonds in portfolios. I believe that for long-term investors stocks provide better
prospects, but I do recommend that clients adhere to the minimum bond allocation that was set out in their investment plan.
Are Stocks Set To Fall?
The flip side of anxiety about rising interest rates for bonds is fear that the run-up in stock prices makes them vulnerable
to a severe correction. Some of these concerns are based on work by Yale’s Robert Shiller, a highly respected voice who
looks at stocks based on a multiple of 10 year earnings. On that basis, U.S. stocks currently look expensive (although not
at nearly the levels in 2000, and well below what we saw in 2007 and 2008.)
While there could certainly be a short term correction in stock prices, I continue to recommend that clients have a healthy
stock allocation in their portfolios:
• Nobody has demonstrated the ability to predict short-term movements in stock prices, it is just as likely that
stocks will rise by 20% as decline by 20%.
• A recent article by Wharton’s Jeremy Siegel, considered today’s leading stock market historian, suggests that
accounting write-offs by American companies have distorted reported earnings, and that if another measure of
profits is used, Schiller’s model shows that stocks are fairly valued historically.
• Siegel further points out that when interest rates are as low as they are today, multiples of earnings have been higher
than average.
• Finally, for investors concerned about valuations on U.S. stocks, there are high quality companies in Europe and
Asia that sell for a significant discount to their U.S. equivalents.
Sticking To Your Plan
Most investors might nod their heads to facts such as the ones above, and can agree to a plan for their portfolio, identifying
the parameters within which their investments will be managed. Of course, agreeing to your plan is the easy part, the
challenge is sticking to it. As former heavyweight champion Mike Tyson pointed out, it’s easy to keep to your plan when
things are going well; it’s when investors get bloodied from market setbacks that sticking to their plan becomes a challenge.
That’s why when markets become choppy, some investors look for bold advice and dramatic shifts in their portfolio, going
all to cash or all to stocks. Unfortunately, the track record of those dramatic shifts is not a happy one:
4. OceanForest Investment Partners
Portfolio Managers Commentary – Q2 2012
Q3 2013
• During the tech mania of the late 1990s, many investors abandoned the principles of sound diversification and
over-weighted their portfolios with technology stocks.
• Ten years ago, U.S. investors began skewing their portfolios to banks and other beneficiaries of the real estate
boom, and in some cases extended themselves to buy bigger houses, vacation homes, and investment properties.
In Canada, demand from emerging markets caused a spike in commodity prices, and many investors dramatically
increased their allocations to resource stocks as a result.
• While most investors initially agree to geographic diversification of their equity investments, many find it difficult
to stick to that commitment. After a period of strong performance such as Canada saw in the last decade or the
U.S. sees today, the instinctive response is often to heavy up what’s been doing well and to abandon what’s been
underperforming, when investors should do exactly the opposite.
Recently, deviating from investment plans has taken a new form. Immediately after 2008, a search for safety led to large
flows out of stocks and into bonds, meaning that some investors missed the recovery since the market bottom. And to
the extent that investors were buying stocks, many only had an appetite for stocks that pay high dividends and are viewed
as an alternative to the secure income from bonds.
In the words of the opening quote for this letter, each of these examples was seen as a clear and simple answer to the
complex problem of where to find the best returns in an uncertain environment. In the search for that clear answer,
many investors abandoned the plans that they’d agreed to in calmer times.
That’s why I see my role as an emotional anchor, keeping my clients’ highs from being too high and their lows from
being too low. For many clients, helping them adhere to their plan, sometimes against their instincts, is how I provide
the greatest value. There are occasions when sticking within the parameters of your plan may feel boring, but history
shows that the key to successful investing is having a sensible plan, and then sticking to it.
Portfolio Strategy
As we’ve mentioned in most of our previous commentaries, one of the key indicators we use for guiding our long-term
positioning in the markets is our Tactical Asset Allocation model. The model has a pretty good track record of helping
us position our portfolios to be either on the defensive or be more aggressive with our equity allocations.
Each month we update our model and the current reading at the end of September continued to call for a bullish stance
on both the U.S. and Canadian markets. Although Canada has underperformed the U.S. for many months now, our
model is telling us nevertheless to stay invested in the current environment near the upper end of the allocation range
as outlined in the Investment Policy Statement.
5. OceanForest Investment Partners
Portfolio Managers Commentary – Q2 2012
Q3 2013
In the past few weeks we’ve witnessed a significant breakout above the 13,000 level in the S&P/TSX Composite Index.
This is the highest level in two years and suggests that the Canadian market is about to play catch-up to the U.S. markets
with the potential to generate strong gains into 2014.
While our tactical indicator does not try to predict the future it does provide us with an objective signal based on market
action only. It helps to reduce much of the subjectivity and emotion in the decision making process.
What This Means For Your Portfolio
In my commentary at the end of last year, I outlined some guiding principles in my approach to building client portfolios,
two of which I repeat here. I’d be pleased to discuss these guidelines at our next meeting.
1. Rebalancing Your Portfolio
In light of stock valuations and the risk in bonds, early last year we recommended that clients increase equity weights to
the upper end of their range. Given strong stock performance since the mid-point of last year, that has worked out well
and we continue to advise that clients hold their maximum equity weight.
But strong performance by stocks means that today some clients are above the top of their equity allocation. In those
cases, we have been recommending reducing equity weighting to bring portfolios back within their guidelines. Regardless
of what happens to markets in the short term, barring a significant change in your circumstances, you should stick to
your investment parameters.
2. Diversifying Portfolios
When building equity portfolios, I’ve always advocated strong diversification outside Canada. This helped my clients
through most of the 1990s, then hurt them in the decade after 2000, then helped them again in the past three years.
Going forward, I have no idea whether the Canadian market will do better or worse than global markets, but I do know
that we represent fewer than 5% of investing opportunities around the world. In addition, because of our resource focus,
Canada’s market will tend to be more volatile over time than those of the U.S. and yes, even Europe. For those reasons
I will be looking at adding some new positions to our portfolios with a focus outside of Canada in order to broaden our
geographic diversification.
6. OceanForest Investment Partners
Portfolio Managers Commentary – Q2 2012
Q3 2013
How Are We Doing?
The all equity Global Market Leaders (USD) portfolio posted the strongest return with a gain of 11.00%.
The next best performer was our more conservative Global Leaders – Balanced (USD) portfolio, gaining 7.22% the
past year. Next up was our all-equity Dividend Growth and Income portfolio which returned 6.94% year over year.
Our Global Growth & Income balanced portfolio gained 4.72% in the past twelve months followed by our most
conservative Enhanced Income portfolio returning 2.13% in the past twelve months. Note that the returns are net
of all fees and expenses.
Portfolio Models
3 Months
6 Months
1 Year
3 Years
Global Market Leaders (USD)
2.63%
1.40%
11.00%
7.87%
Global Leaders - Balanced (USD)
2.12%
-0.22%
7.22%
6.95%
Global Growth & Income
4.70%
2.73%
6.94%
5.43%
Dividend Growth
2.78%
-0.33%
4.72%
4.25%
Enhanced Income
1.73%
-0.83%
2.13%
4.03%
* Source: Dataphile, Raymond James Ltd. Total Returns. 1 and 3 year returns are annualized as of Sept. 30, 2013
I recognize that today seems like a particularly uncertain time, and hope you found this overview helpful. Should you have
questions about this note or about any other issue, please feel free to give me or one of the members of my team a call.
And as always, thank you for the opportunity to serve as your financial advisor.
Brent Woyat, CIM, CMT
Portfolio Manager
OceanForest Investment Partners
P.S. - I don’t often ask for referrals, but during these unsettling times you might have a friend, relative, or co-worker who is in need of levelheaded counsel on investing. Give me a call if you think I can help.
The model account performance reflects returns, net of fees, and it is historical, including compounding and reinvestment of distributions. The performance calculation for the
models may be different than that of the index/markets used as a reference point for comparison. Individual client account performance is likely not to be exactly the same as the
model account due to several factors, including timing of contributions, date invested in the model and redemptions, etc. Performance data represents past performance and is
not necessarily indicative of future performance; that there is no guarantee of performance. The index rates of return do not take into account sales, redemptions, distributions
or optional charges or income taxes payable; whereas the model performance takes into account the respective charges and fees. Investors should read the available disclosure
documents before investing.
The information contained in this report was obtained from sources believed to be reliable, however, we cannot represent that it is accurate or complete. This report is provided as
a general source of information and should not be considered personal investment advice or solicitation to buy or sell securities. The views expressed are those of the author and
not necessarily those of Raymond James Ltd. The performance numbers are based on the underlying “model” client account in Dataphile, and that the source of the performance
is Dataphile, which generates on “dollar weighted” returns. Raymond James Ltd. is a Member-Canadian Investor Protection Fund.
Market indices return data in this table is from sources believed to be reliable, but accuracy cannot be guaranteed.
Privacy legislation requires that anyone you are referring consents to having his/her information provided to me.