Logistics Market Snapshot July 2012

Attached you will find the July edition of the monthly Logistics Market Snapshot. As you may already know, we pull this material from over 300 different sources that we review and compile every month. The Snapshot is intended to be just that, an easily digested glimpse into some of the facts and figures that fuel our industry. However, many of the sources go into MUCH greater detail and are worth looking at if you are interested to learn more. So this month, in addition to the sources listed in the pages of the Snapshot, I thought I would point out a few interesting reports and resources that caught our eye: 1) CNBC Released their 2012 Top States for Business Rankings. Transportation in Georgia takes #3 in the Nation, GA workforce ranked #1. Read the report and the see all the ranking categories here: http://www.cnbc.com/id/46415063 2) The USDA released a new Ocean Shipping Container Availability Report (OSCAR) provides a weekly snapshot of container availability for westbound transpacific trade lanes at different intermodal locations around the country. Get the weekly updated report here: www.ams.usda.gov/OSCAR 3) New Georgia Export Price Index… Tomorrow, the Bureau of Labor Statistics (BLS) will release a new quarterly report highlighting export price indexes for industries that are important to the economy in the state of Georgia. The output will be released quarterly and represent the first time a release has focused on key exports for a specific state. Other states will follow in the future. http://www.bls.gov/mxp/ 4) Finally, check out our brand new website which we launched earlier this week. It has a wide range of logistics tools and hundreds of reports like the ones mentioned above searchable in the Resource Library on www.GeorgiaLogistics.com.

Empfohlen
Weitere ähnliche Inhalte
Kürzlich hochgeladen
Kürzlich hochgeladen (20)
Empfohlen
Empfohlen (20)
Logistics Market Snapshot July 2012
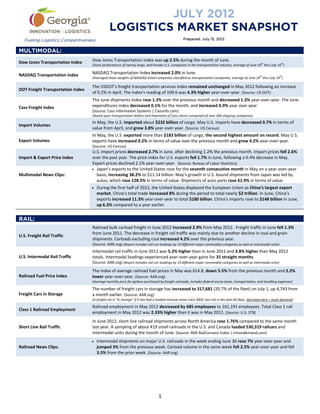
- 1. JULY 2012 LOGISTICS MARKET SNAPSHOT Fueling Logistics Competitiveness Prepared: July 15, 2012 MULTIMODAL: Dow Jones Transportation Index Dow Jones Transportation index was up 2.5% during the month of June. th th (Stock performance of twenty large, well-known U.S. companies in the transportation industry, average of June 10 thru July 10 ) NASDAQ Transportation Index NASDAQ Transportation Index increased 2.0% in June. th th (Averaged share weights of NASDAQ-listed companies classified as transportation companies, average of June 10 thru July 10 ) The USDOT's freight transportation services index remained unchanged in May 2012 following an increase DOT Freight Transportation Index of 0.2% in April. The index’s reading of 109.6 was 4.3% higher year-over-year. (Source: US DOT) The June shipments index rose 1.3% over the previous month and decreased 1.3% year-over-year. The June Cass Freight Index expenditures index decreased 0.1% for the month, and increased 0.9% year over year. (Source: Cass Information Systems | Cassinfo.com) (Based upon transportation dollars and shipments of Cass clients comprised of over 400 shipping companies) In May, the U.S. imported about $232 billion of cargo. May U.S. imports have decreased 0.7% in terms of Import Volumes value from April, and grew 3.8% year-over-year. (Source: US Census) In May, the U.S. exported more than $183 billion of cargo, the second highest amount on record. May U.S. Export Volumes exports have increased 0.2% in terms of value over the previous month and grew 4.2% year-over-year. (Source: US Census) U.S. import prices decreased 2.7% in June, after declining 1.2% the previous month. Import prices fell 2.6% Import & Export Price Index over the past year. The price index for U.S. exports fell 1.7% in June, following a 0.4% decrease in May. Export prices declined 2.1% year-over-year. (Source: Bureau of Labor Statistics) Japan’s exports to the United States rose for the seventh consecutive month in May on a year-over-year Multimodal News Clips: basis, increasing 38.2% to $11.14 billion. May’s growth in U.S. bound shipments from Japan was led by autos, which rose 128.5% in terms of value. Shipments of auto parts rose 61.9% in terms of value. During the first half of 2012, the United States displaced the European Union as China’s largest export market. China’s total trade increased 8% during the period to total nearly $2 trillion. In June, China’s exports increased 11.3% year-over-year to total $180 billion. China’s imports rose to $148 billion in June, up 6.3% compared to a year earlier. RAIL: Railroad bulk carload freight in June 2012 increased 2.9% from May 2012. Freight traffic in June fell 1.3% from June 2011. The decrease in freight rail traffic was mainly due to another decline in coal and grain U.S. Freight Rail Traffic shipments. Carloads excluding coal increased 4.2% over the previous year. (Source: AAR.org) (Report includes rail car-loadings by 19 different major commodity categories as well as intermodal units) Intermodal rail traffic in June 2012 was 5.2% higher than in June 2011 and 3.8% higher than May 2012 U.S. Intermodal Rail Traffic totals. Intermodal loadings experienced year-over-year gains for 31 straight months. (Source: AAR.org) (Report includes rail car-loadings by 19 different major commodity categories as well as intermodal units) The index of average railroad fuel prices in May was 614.8, down 5.5% from the previous month and 2.2% Railroad Fuel Price Index lower year-over-year. (Source: AAR.org) (Average monthly price for gallons purchased by freight railroads; Includes federal excise taxes, transportation, and handling expenses) The number of freight cars in storage has increased to 317,681 (20.7% of the fleet) on July 1, up 4,743 from Freight Cars in Storage a month earlier. (Source: AAR.org) (A freight car is "in storage" if it has had a loaded revenue move since 2005, but not in the past 60 days. Decrease here = more demand) Railroad employment in May 2012 decreased by 685 employees to 161,191 employees. Total Class 1 rail Class 1 Railroad Employment employment in May 2012 was 2.33% higher than it was in May 2011. (Source: U.S. STB) In June 2012, short line railroad shipments across North America rose 1.76% compared to the same month Short Line Rail Traffic last year. A sampling of about 419 small railroads in the U.S. and Canada loaded 530,319 railcars and intermodal units during the month of June. (Source: RMI RailConnect Index | rmiondemand.com) Intermodal shipments on major U.S. railroads in the week ending June 30 rose 7% year-over-year and Railroad News Clips: jumped 3% from the previous week. Carload volume in the same week fell 2.5% year-over-year and fell 3.5% from the prior week. (Source: AAR.org) 1
- 2. JULY 2012 LOGISTICS MARKET SNAPSHOT Fueling Logistics Competitiveness Prepared: July 15, 2012 TRUCKING: Over-the-Road Trucked Shipments rose 0.8% in May following a 0.1% increase in April and a 0.3% increase in Over-the-Road Trucked Shipments March. Overall trucked shipments decreased 0.6% on a year-over-year basis. (Source: Ceridianindex.com) (From the Ceridian-UCLA Pulse of Commerce Index which is based on real-time fuel consumption data for over the road trucking) The ATA’s seasonally adjusted cargo index fell 0.7% in May after falling 1.1% in April. The for-hire truck Trucking Volume tonnage index rose 4.1% year-over-year. (Source: American Trucking Association | Trucking.org) The spot market for truckload freight in June rose 1.3% compared to the previous month, and was 13% Truckload Freight higher year-over-year. Truck capacity fell 3.5% for the month, but was up 17% year-over-year. (Source: TransCore Freight Index | www.transcorefreightsolutions.com) U.S. average diesel prices rose last week to $3.41 per gallon. Last week’s average diesel price was 5.5¢ lower Diesel Prices than the previous week, and was 23¢ lower than the same week last year. The average price of diesel in the lower Atlantic states was $3.25 per gallon. (Source: U.S. DOE) (Reflects the costs and profits of the entire production and distribution chain.) The trucking industry added 2,000 jobs in June. The trucking workforce increased 0.15% over the previous Trucking Employment month and rose 3.1% over the previous year. (Source: U.S. DOL) Orders for heavy-duty Class 8 trucks in North America are expected to total 16,195 units in June 2012, the Truck Orders lowest month for orders since September 2010. June orders were 8% lower than the previous month, and 23% lower than the same month last year. (Source: FTR Associates | ftrassociates.com) Surface transport-related trade between the U.S. and its NAFTA partners, Canada and Mexico, was up 8.2% th NAFTA Trade in April compared to the same month in 2011, reaching $79.8 billion. April was the 29 consecutive month of year-over-year increases. (Source: US DOT) Saia, a multiregional less-than-truckload carrier, purchased Robart Companies, a truck freight broker and logistics services provider. The $1 billion Georgia-based LTL trucking company purchased the brokerage Trucking News Clips: firm for $7.8 million. Saia revenue increased 11% in the 1Q to $269 million, while net income rose to $5.5 million from $700,000 during the same quarter last year. In 2011, the trucking industry accounted for 67% of tonnage and 81% of revenue in the freight transportation industry. Overall total freight tonnage is expected to grow by 21% by 2023, and revenue for the freight transportation industry is projected to rise 59% in that same timeframe. Trucking’s share of the tonnage market will rise over two percentage points to 69.6% by 2023, while the industry’s share of freight revenues will increase to 81.7% from 80.9%. (Source: American Trucking Association) AIR FREIGHT: Air Cargo Traffic Global air freight traffic in May fell 0.4% from one year ago and was down 1.9% from the previous month. North American air freight in May fell 1.9% year-over-year. (Source: IATA.org) (Global air freight covers international and domestic scheduled air traffic. North American traffic includes only domestic freight traffic.) In May, Hartsfield-Jackson Atlanta International Airport transported 55,325 metric tons of cargo, a 5% Atlanta Air Cargo Traffic increase from the previous month and a 2.35% decrease year-over-year. (Source: HJIA) In April, average international air cargo prices dipped 0.8% from the previous month. Average air freight Air Freight Price Index rates were down 3.6% year-over-year. (Source: Bureau of Labor Statistics) (The Drewry Air Freight Price Index is based on the average of rates ($US per kg) for cargoes of 100+kg to 1,000+kg cargoes from Shanghai to London, Moscow, Prague, New York, and Los Angeles.) Jet Fuel Prices As of July 6, 2012, the global average jet fuel price was $117.40 per barrel; up 1.6% from the previous month, and 10.9% lower year-over-year. (Source: IATA.org, platts.com) (The weekly index and price data shows the global average price paid at the refinery for aviation jet fuel) Global semiconductor sales are boosting the air cargo industry. Sales of semiconductors totaled $25.2 Air Freight News Clips: billion in May, rising 1.4% from the previous month. Semiconductor manufacturers gain roughly 82% of their revenues from exports and typically ship the product via air. Japan’s All Nippon Airways (ANA) and Japan Airlines (JAL) saw growth in international cargo volumes for the fourth consecutive month. The volume of international cargo ANA carried in May totaled 43,591 tons, up 7.1% year-over-year. JAL’s international cargo in May totaled 19,826 tons, an increase of 4.3% year- over-year. 2
- 3. JULY 2012 LOGISTICS MARKET SNAPSHOT Fueling Logistics Competitiveness Prepared: July 15, 2012 OCEAN FREIGHT: Import shipment volume, in TEUs, at U.S. ports decreased 3.7% in June from the previous month and rose Import Volumes 4.4% over the previous year. YTD, June had the second highest number of TEU imports, with over 1.54 million TEUs imported. (Source: Zepol Corporation | zepol.com) th The July 6 SCFI comprehensive reading was $1,421.94 per FEU; down 2.6% from the previous week, and Shanghai Containerized 38% higher year-over-year. The spot rate for shipments to the U.S. East Coast was $3,728 per FEU, up 28.9% Freight Index from the previous year. (Source: Shanghai Shipping Exchange | www1.chineseshipping.com.cn/en) (The Shanghai Containerized Freight Index is a weekly reported average export spot rate from Shanghai for 15 different trade lanes.) The Baltic Dry Index increased 11.4% in June, ending at 1,004. The BDI has increased 14% during the first Ocean Bulk Freight Rates half of July. (Source: www.bloomberg.com/quote/BDIY:IND) (The Baltic Dry Index is an index that tracks and averages worldwide international shipping prices of various dry bulk cargoes.) Between July 1 and September 30, 2012, the bunker fuel surcharge will total $580 per FEU for shipments to TSA Bunker Surcharges the West coast ocean ports and $1,119 per FEU for shipments to the East coast and Gulf ports. (Source: Transpacific Stabilization Agreement) (The Transpacific Stabilization Agreement is a research and discussion forum of major ocean container shipping lines that carry cargo from Asia to ports in the U.S.) In May, the Port of Savannah handled 256,530 TEUs. May’s shipment total represented a 0.86% increase Port of Savannah over May 2011, and was 3.1% higher than April’s shipments. (Source: GPA) The Georgia Ports Authority marked a record month in April for Autos and the fourth busiest month in the Authority’s history for total tonnage. In April, the Port of Brunswick handled 59,926 auto and machinery Port of Brunswick units, an increase of 57.7% over the previous year. The Brunswick facility is the nation’s fifth busiest port for total import-export Ro/Ro cargo, and the third busiest port for the export of U.S.-made vehicles and machinery. (Source: GPA) The first section of new locks at the Panama Canal has been completed. The monolith is the first of 46 such structures to be completed in the upper chamber of the Pacific locks. Construction of this first Ocean Freight Business News: monolith required 232 tons of reinforced steel and 91,995 cubic feet of concrete. The new set of locks is slated to be completed in 2014 but will not be open for commercial traffic until 2015. Taiwanese carrier Evergreen has agreed to charter 10 new 13,800 TEU vessels this month. Greek ship management company Enesel SA placed the $1.2 billion order for the ships through South Korea’s Hyundai Heavy Industries. The vessels will be leased to Evergreen for an initial five years with deliveries due in the second half of 2013. The world’s top 20 ocean carriers boosted their container ship fleets by 844,000 TEUs in the past year. The two largest lines, Maersk and MSC accounted for more than half the extra capacity, adding 232,000 TEUs and 218,000 TEUs respectively since July 2011. The world fleet reached 16.53 million TEUs by July 1, with total capacity growth of 6.5%. OOCL reported positive volume and profit results for the 2Q 2012. The Hong Kong-based carrier’s total volume was 6.7% higher year-over-year for the second quarter. Revenue increased 10.6% year-over-year to $1.560 billion. 3
- 4. JULY 2012 LOGISTICS MARKET SNAPSHOT Fueling Logistics Competitiveness Prepared: July 15, 2012 WAREHOUSING & DISTRIBUTION: The U.S. average industrial vacancy rate was 9.1% during Q2 2012, remaining the same as the previous Industrial Vacancy quarter. Overall vacancy was 10.8% in the South and 14% in Atlanta during the second quarter. (Source: Cassidy Turley) In Q2 2012, warehouse and distribution rental rates in the US averaged $5.05 per square foot. Rental rates Warehouse Rent Rates for warehouse space averaged $4.48/square foot in the South and $3.46/square foot in Atlanta. (Source: Cassidy Turley) Net absorption in the US during Q2 2012 totaled +19.8 million square feet. Absorption during the 2Q totaled nearly +7.3 million square feet in the South. Atlanta led cities in the South and was third highest overall in Industrial Absorption the U.S. with over +1.75 million square feet absorbed in the 2Q. (Source: Cassidy Turley) (Absorption is the net change in occupied space between two points in time. Positive absorption means that previously unoccupied space is being occupied.) The National PMI fell 3.8 points to 49.7 in June 2012, the index’s first time under 50 since July 2009. New Purchasing Managers Index orders decreased 12.3 points to 47.8 and production fell 4.6 points to 51.0. (Source: Institute for Supply Management) (The PMI combines data on new orders, inventory, production, supplier deliveries, and employment. A reading above 50 indicates that the manufacturing economy is generally expanding.) Georgia’s PMI fell 6.9 points to 55.0 in June. New orders in Georgia decreased 11.8 points to 53.6 and Purchasing Managers Index production was down 10 points to 55.4. Georgia’s PMI of 55.0 outperformed the national PMI by 5.3 in Georgia points and has remained above 50 for the sixth consecutive month. (Source: Kennesaw State University) (The PMI combines data on new orders, inventory, production, supplier deliveries, and employment. A reading above 50 indicates that the manufacturing economy is generally expanding.) Tractor Supply Co. announced plans to build a $50 million distribution center in Bibb County, Georgia. The W&D Business News: new 650,000 square foot facility could open by the fall of 2013. The company selected the location due to its proximity to the Port of Savannah and several major interstates. Academy Sports + Outdoors will expand its existing operation in Twiggs County, Georgia, creating 250 new jobs and expanding its distribution center by more than 500,000 square feet. The Texas-based company first moved to its current 1.1 million square foot facility in 2007, and currently employs 625 associates. In 2011, Academy Sports + Outdoors added an e-commerce center at its facility, which serves as the fulfillment center for its online retail business. UPS intends to expand its Atlanta distribution center capacity by 30%, bringing the total area to 794,300 square feet of space. The company’s expansion is based on significant growth in distribution for health care, aerospace, retail, and high-tech businesses. Georgia Cold Storage will open a refrigerated storage facility in a Pooler, Georgia industrial park. The Pooler facility will be the company’s seventh and largest facility, totaling 176,000 square feet. Georgia Cold Storage is the second refrigerated warehouse operator to announce plans for a Savannah-based facility in recent months. Nordic, one of the nation’s largest cold-storage warehouse companies, broke ground on a new 400,000 square foot building in June. Halstead New England will open a distribution center near Port Wentworth, Georgia. The 112,000 square foot warehouse will open in September. The Connecticut-based company imports flooring and granite building products for distribution to Home Depot and other retailers. Halstead chose the Savannah area due to access to the port, the available skilled labor pool, and lower operational costs. Porsche Cars North America Inc. paid $34.4 million for the land on which it plans to build its U.S. headquarters in Atlanta, Georgia. Porsche acquired 56.2 acres, including 26 acres for its $100 million headquarters project. The site is a redevelopment of the former Ford Motor Co. assembly plant. U.S. MARKET: The U.S. GDP increased 1.9% in the first quarter of 2012 according to the third estimate released by the Gross Domestic Product Bureau of Economic Analysis. (Source: US BEA) The U.S. trade deficit decreased by 3.8% in May to $48.7 billion. Exports increased 0.2 to $183.1 billion and U.S. Trade Deficit imports decreased 0.7% to $231.8 billion. U.S. exports in May were the second highest on record. (Source: US DOC & Census Bureau) The Consumer Confidence Index decreased to 62.0 in June 2012 from 64.4 in May 2012. Consumer Confidence (Source: The Conference Board) (The consumer confidence index is based on a monthly survey of 5,000 U.S. households. It is designed to gauge the financial health, spending power, and confidence of the average U.S. consumer.) 4
- 5. JULY 2012 LOGISTICS MARKET SNAPSHOT Fueling Logistics Competitiveness Prepared: July 15, 2012 The unemployment rate in America remained at 8.2% in June 2012. Approximately 80,000 net new jobs Unemployment Rate were created in June, up from the 77,000 new jobs created in May. (Source: US DOL) The Leading Economic Index for the U.S. increased 0.3% in May to 95.8 (2004=100), following a 0.1% decrease Leading Economic Index in April and a 0.2% increase in March. (Source: Conference Board) (The LEI is a composite of 10 economic indicators that together create an analytic system designed to signal peaks and troughs in the business cycle. The LEI reveals patterns in economic data in a clearer and more convincing manner than any individual component alone.) Retail and food service sales fell in June to $401.5 billion, down 0.5% from the previous month, but up 3.8% Retail Sales above June 2011. Non-store retailer sales were up 10.9% from last year. (Source: US Census) Total combined sales and manufacturing shipments totaled nearly $1.245 Trillion in May 2012, down 0.1% Manufacturing & Trade Sales from April and up 5.1% from the previous year. (Source: US Census) Total value of inventory on hand is estimated at $1.578 Trillion in May 2012, up 0.3% from April and up 5.2% Manufacturing & Trade Inventory from May 2011. (Source: US Census) In May, housing starts decreased 4.8% to an annual rate of 708,000 units. Building permits (an indicator of Housing Starts future housing starts) rose 7.9% to an annual rate of 780,000. (Source: U.S. DOC) The consumer price index for all urban consumers was unchanged in June from the previous month. Over the last 12 months, the all items index increased 1.7%. The producer price index for finished goods Consumer & Producer Price Index increased 0.1% in June from the previous month. Prices for finished goods rose 0.7% over the previous year. (Source: US Bureau of Labor Statistics) To sign-up to receive these free monthly snapshots, visit: www.GeorgiaLogistics.com For more information about the Logistics Market Snapshot or the many other resources and activities of the Georgia Center of Innovation for Logistics please contact: Page Siplon, Executive Director – psiplon@georgia.org – 912.966.7867 5