
Empfohlen
Weitere ähnliche Inhalte
Was ist angesagt?
Was ist angesagt? (20)
Andere mochten auch
Ähnlich wie Allocator November 2010
Ähnlich wie Allocator November 2010 (20)
Kürzlich hochgeladen
Kürzlich hochgeladen (20)
Allocator November 2010
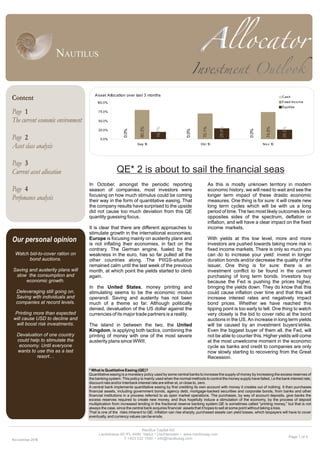
- 1. Page 1 of 4 Page The current economic environment Page Asset class analysis Page Current asset allocation Page Perfomance analysis Our personal opinion Watch bid-to-cover ration on bond auctions. Saving and austerity plans will slow the consumption and economic growth. Deleveraging still going on. Saving with individuals and companies at record levels. Printing more than expected will cause USD to decline and will boost risk investments. Devaluation of one country could help to stimulate the economy. Until everyone wants to use this as a last resort… In October, amongst the periodic reporting season of companies, most investors were focusing on how much stimulus could be coming their way in the form of quantitative easing. That the company results have surprised to the upside did not cause too much deviation from this QE quantity guessing focus. It is clear that there are different approaches to stimulate growth in the international economies. Europe is focusing mainly on austerity plans and is not inflating their economies, in fact on the contrary. The German engine, fueled by the weakness in the euro, has so far pulled all the other countries along. The PIIGS-situation remained calm until the last week of the previous month, at which point the yields started to climb again. In the United States, money printing and stimulating seems to be the economic modus operandi. Saving and austerity has not been much of a theme so far. Although politically denied, devaluation of the US dollar against the currencies of its major trade partners is a reality. The island in between the two, the United Kingdom, is applying both tactics, combining the printing of money with one of the most severe austerity plans since WWII. As this is mostly unknown territory in modern economic history, we will need to wait and see the longer term impact of these drastic economic measures. One thing is for sure: it will create new long term cycles which will be with us a long period of time. The two most likely outcomes lie on opposites sides of the spectrum, deflation or inflation, and will have a clear impact on the fixed income markets. With yields at this low level, more and more investors are pushed towards taking more risk in fixed income markets. There is only so much you can do to increase your yield: invest in longer duration bonds and/or decrease the quality of the issuer. One thing is for sure: there is an investment conflict to be found in the current purchasing of long term bonds. Investors buy because the Fed is pushing the prices higher, bringing the yields down. They do know that this could cause inflation over time and that this will increase interest rates and negatively impact bond prices. Whether we have reached this tipping point is too early to tell. One thing to watch very closely is the bid to cover ratio at the bond auctions in the US. An increase in long term yields will be caused by an investment buyers'strike. Even the biggest buyer of them all, the Fed, will not be able to counter this. Higher yields will come at the most unwelcome moment in the economic cycle as banks and credit to companies are only now slowly starting to recovering from the Great Recession. QE* 2 is about to sail the financial seas Nautilus Capital AG Landstrasse 60 •FL-9490 Vaduz • Liechtenstein • www.nautilusag.com T +423 232 1540 • info@nautilusag.com Asset Allocation over last 3 months 0.0% 0.0% 0.0% 80.3% 70.1% 74.5% 19.7% 29.9% 25.5% 0.0% 25.0% 50.0% 75.0% 100.0% Sep 10 Okt 10 No v 10 Cash Fixed Inco me Equities November-2010 Content 1 2 3 4 * What is Quatitative Easing (QE)? Quantitative easing is a monetary policy used by some central banks to increase the supply of money by increasing the excess reserves of the banking system. This policy is mainly used when the normal methods to control the money supply have failed, i.e the bank interest rate, discount rate and/or interbank interest rate are either at, or close to, zero. A central bank implements quantitative easing by first crediting its own account with money it creates out of nothing. It then purchases financial assets, including government bonds, agency debt, mortgage-backed securities and corporate bonds, from banks and other financial institutions in a process referred to as open market operations. The purchases, by way of account deposits, give banks the excess reserves required to create new money, and thus hopefully induce a stimulation of the economy, by the process of deposit multiplication from increased lending in the fractional reserve banking system.QE is sometimes called “printing money,” but that is not always the case, since the central bank acquires financial assets that it hopes to sell at some point without taking a loss. That is one of the risks inherent to QE: inflation can rise sharply, purchased assets can yield losses, which taxpayers will have to cover eventually, and currency values can be erode.
- 2. Page 2 of 4 General Market Returns AssetAllocation Cash (0%, no change): the return on cash is still close to zero and with some inflationary pressure on the horizon, it is still more effective to look at the yield curve and keep the flexibility on your side. The short term interest rates will not be increased before the central banks stop the liquidity flows. Bonds (74%, +4%): a bit of profit taking on the equities meant an increase in the fixed income part. At this stage of the economic recovery and with potential inflation this asset class is a very challenging one, but offers many opportunities at the same time. The main challenge is to be at the right side of the duration. As long as quantitative easing is continuing there will be price increases. The main challenge the government has is to keep its credibility. This is a highly diplomatic exercise towards financial markets. Buying too many bonds will increase inflation, buying too little might cause normalization of the yields. At one stage there will be profit taking and increases on the yield. It will hurt the longest duration bonds most. The most important in the allocation of fixed income is the duration allocation. Compared to previous month there is a big decrease in the 20+ year bonds (-34%) in favor of the corporate bonds (+4%) and the 7-10 year (+30%). The above graph shows that the 30-year yield is increasing. This seems to be a trend change from the previous months. In previous months there was always a parallel shift from the yield curve. This needs to be monitored closely as the QE purchases will have an impact on the complete yield curve. In the nearby future the bond auctions will show how investors think about it. Equity (26%, -4%): the international equity markets made a big jump in September and continued on this momentum in October. Most economists agree on what is different about this crisis compared to previous ones: developed economies need to deleverage, and this process is likely to produce sub-par growth for a long time. But there is more to it. The post-crisis environment is marked by another characteristic which compensates for the deleveraging: the absence of broad corporate restructuring. In most other post-recession periods, the consumer was relied on to be the engine of recovery, while ailing companies nursed themselves back to health more slowly. But the Global Financial Crisis hit at a time when most non-financial companies were in excellent shape, after years of post-internet bubble reform in which they evolved into profit machines of extraordinary efficiency and adaptability. Today, corporate profit margins are reaching outstanding levels. This is especially so in America -only a few months after the economic trough, and Ebitda margins are at their highest in years. Usually, the economy needs two to three years before corporate profitability re-emerges. Not this time: corporate prosperity has never been so apparent. In a period of intense debate about fiscal and monetary policy, it is therefore useful to remember that: the true source of sustainable economic growth-the corporate sector-has never been as solid as it is now. This is more visible in some sectors, mainly the ones that didn't use a lot of leverage. SectorAllocation These sectors are also the ones that kept their dividends stable or revised it upwards. The other ones are using their cash for repurchasing shares or for focused take-overs. We like the overweight in Technology for this reason. Most IT firms start to use their cash for dividend increases (Microsoft,..), repurchasing shares (IBM,...) or plan take-overs (Apple,...). The biggest overweight we have is in the basic materials. There is a large wave of consolidation taking place in the sector. The consumer growth inAsia is starting to take its toll in the resource area. The Chinese are long term planning and start to integrate their production industries vertically, from the resource over production to distribution. Consumer services are the third biggest weight in the portfolio, although the retail sector has been reduced versus last month. GeographicalAllocation The model reduced its allocation in Asia-Pacific almost completely, together with Latin-America being reduced. Capital flows in Latin- America are being restricted in order to avoid inflationary pressures. This will cool down the equity markets as well. The allocation is increased in the underperforming countries, which have the capability of increasing Quantitative Easing, England and Japan. Using their cheaper currencies will stimulate their economies. NorthAmerican exposure comes from the sector allocation. Nautilus Capital AG Landstrasse 60 •FL-9490 Vaduz • Liechtenstein • www.nautilusag.com T +423 232 1540 • info@nautilusag.comNovember-2010 Market Month-to-date Year-to-date Performance Performance 3M Treasury Bill 0.0% 0.1% Barclays US Agg. Bd Index 0.4% 8.3% Barclays US Treasury 1-3Y Index 0.2% 2.8% Barclays US Treasury 7-10Y Index -0.1% 14.2% Barclays US Treasury 20+Y Index -4.6% 15.0% Barclays Corp.Inv.Grade Index 0.1% 10.9% Dow Jones World Index 3.7% 7.4%
- 3. Page 3 of 4 Current Asset Allocation Nautilus Capital AG Landstrasse 60 •FL-9490 Vaduz • Liechtenstein • www.nautilusag.com T +423 232 1540 • info@nautilusag.com Asset Allocation 0.0% 74.5% 25.5% 0.0% 20.0% 40.0% 60.0% 80.0% Asset Classes Cash Fixed Income Equity Historical Asset Allocations (Last 5 years) 0.0% 25.0% 50.0% 75.0% 100.0% Nov 05 Nov 06 Nov 07 Nov 08 Nov 09 Nov 10 Cash Fixed Income Equity Fixed Income Allocation: Sector 0.0% 52.5% 12.0% 10.0% 0.0% 10.0% 20.0% 30.0% 40.0% 50.0% 60.0% UST 1-3 Year UST 7-10 Year UST 20+Year US Corp.Inv Equity Allocation: Regions 2.6% 12.0% 0.0% 3.9% 0.0% 4.7% 2.4% 0% 4% 8% 12% 16% United Kingdom North America Latin America Japan Europe, Ex-UK (Eme) Europe, Ex-UK (Dev) Asia/Pacific, Ex-Japan Equity Allocation: Industries 11.3% 1.7% 5.9% 0.1% 0.0% 0.1% 0.0% 6.1% 0.4% 0.0% 0% 2% 4% 6% 8% 10% 12% Basic M aterials Cons. Goods Cons. Services Financials Health Care Industrials Oil & Gas Technology Telcos Utilities Equity Allocation: Under/Over Industries -34.8% 0.0% 78.7% -26.4% -23.9% -21.0% -26.8% 23.6% -12.1% 88.4% -50% -25% 0% 25% 50% 75% 100% Utilities Telcos Technology Oil & Gas Industrials Health Care Financials Consumer Services Consumer Goods Basic M aterials Fixed Income Allocation: Duration 0.0% 62.5% 12.0% 0.0% 10.0% 20.0% 30.0% 40.0% 50.0% 60.0% 70.0% <3 Years 7-10 Years 10-20 Years Equity Allocation: Under/Over Regions -6.6% 11.8% -22.1% 26.6% 13.2% 4.7% -12.6% -50% -25% 0% 25% 50% Asia/Pacific, Ex-Japan Japan Latin America United Kingdom United States Europe, Ex-UK (Dev) Europe, Ex-UK (Eme) November-2010
- 4. Page 4 of 4 Performance Analysis This publication is for your information only and is not intended as an offer, or a solicitation of an offer, to buy or sell any Investment or other specific product.Although all information and opinions expressed in this document were obtained from sources believed to be reliable and in good faith, no representation or warranty, express or implied, is made as to its accuracy or completeness. All information and opinions as well as any prices indicated are subject to change without notice. At any time Nautilus Capital ("Nautilus") (or employees thereof) may have a long or short position, in relevant securities. Some investments may not be readily realisable at times of illiquid market circumstances. Therefore valuing the investment and identifying the risk to which you are exposed may be difficult to quantify. Futures and options trading is considered risky and past performance of an investment is not a guide to its future performance. Some investments may be subject to a decline in value and on realisation you may receive back less than you invested. Changes in FX rates may have an adverse effect on the price, value or income of an investment. Each investment needs to be seen in the context of your particular investment objectives, financial situation and needs and we would recommend that you take financial advice as to the tax implications of investing in any of the products mentioned herein. Nautilus Capital AG Landstrasse 60 •FL-9490 Vaduz • Liechtenstein • www.nautilusag.com T +423 232 1540 • info@nautilusag.com Cummulative Outperformance -25% 0% 25% 50% 75% 100% Dez 01 Dez 02 Dez 03 Dez 04 Dez 05 Dez 06 Dez 07 Dez 08 Dez 09 Current Month Performance Attribution vs. Benchmark -5.0% -2.5% 0.0% 2.5% 5.0% Asset Allocation Sector Rotation Total Value Added -5.0% -2.5% 0.0% 2.5% 5.0% Cash Fixed Income Equities Total DRM US 3M US Aggregate Benchmark** Dow Jones Treasury Bond Index Agg. World Return Currency USD USD USD USD USD Month Return (Oct-10) -0.6% 0.0% 0.4% 1.7% 3.7% Year-to-date Return 3.9% 0.1% 8.3% 3.0% 7.4% Last 12 Months Return 5.0% 0.1% 8.0% 4.6% 14.0% Last 24 Months Return 3.5% 0.2% 10.9% 4.5% 17.3% Total Annual Return * 9.1% 2.1% 5.9% 5.5% 5.2% Standard Deviation (Volatility) * 7.6% 0.5% 3.8% 8.4% 16.9% Semi-Standard Deviation (<0) * 7.2% NM 3.8% 10.0% 19.4% Sharpe Ratio * ( rf = 2.09% ) 0.93 NM 1.00 0.40 0.18 Sortino Ratio * ( rf = 2.09% ) 0.97 NM 0.98 0.34 0.16 Positive Months * 67.9% 99.1% 69.8% 65.1% 59.4% Average Monthly Return * 0.7% 0.2% 0.5% 0.4% 0.4% All figures are annualized measures of returns. * Period: Jan-02 to Oct-10. ** Benchmark = 5% UST 3M + 22.5% UST 1-3Y + 9% UST 7-10Y + 5.4% UST 20+Y + 8.1% US Corp. Inv. Grade Bonds + 50% Dow Jones Aggr. World Equity Index. Cummulative Performance 50 100 150 200 250 Dez 01 Dez 02 Dez 03 Dez 04 Dez 05 Dez 06 Dez 07 Dez 08 Dez 09 DRM Benchmark Rew ard to Risk Analysis of Returns DRM 3M -Treasury BenchmarkUS Ag Bd Index Dow Jones Agg. World Index 0.0% 2.5% 5.0% 7.5% 10.0% 12.5% 0% 5% 10% 15% 20% 25% Incurred Volatility (Risk) RealizedReturn (Reward) November-2010