Optimising oyster culture in Ghana
•
2 gefällt mir•242 views

A presentation on the procurement of wild seed (spat) of the mangrove oyster, Crassostrea tulipa, in coastal water bodies along the coast of Ghana, West Africa. The slide covers spatial and temporal variations in spatfall in the Densu Delta, Narkwa Lagoon, Benya Lagoon and Whin Estuary from November 2017 to October 2018. A comparison of the effectiveness of locally available spat collectors is also presented. The slide contains information on typical fouling organisms in oyster farming in the tropics. Growth rates of oysters are also compared among the different water bodies and on different collectors.

Empfohlen
Weitere ähnliche Inhalte
Was ist angesagt?
Was ist angesagt? (20)
Ähnlich wie Optimising oyster culture in Ghana
Ähnlich wie Optimising oyster culture in Ghana (20)
Kürzlich hochgeladen
Kürzlich hochgeladen (20)
Optimising oyster culture in Ghana
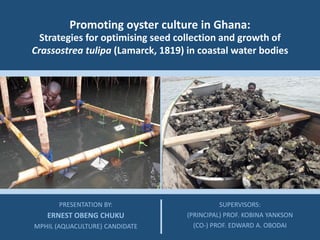
- 1. Promoting oyster culture in Ghana: PRESENTATION BY: ERNEST OBENG CHUKU MPHIL (AQUACULTURE) CANDIDATE Strategies for optimising seed collection and growth of Crassostrea tulipa (Lamarck, 1819) in coastal water bodies SUPERVISORS: (PRINCIPAL) PROF. KOBINA YANKSON (CO-) PROF. EDWARD A. OBODAI
- 2. INTRODUCTION MATERIALS AND METHODS RESULTS AND DISCUSSION CONCLUSIONS RECOMMENDATIONS PRESENTATION OUTLINE REFERENCES ACKNOWLEDGEMENT 2
- 3. PRESENTATION OUTLINE MATERIALS AND METHODS RESULTS AND DISCUSSION CONCLUSION RECOMMENDATIONS INTRODUCTION 3
- 4. Introduction: Background to the study • Aquaculture is of major and increasing importance to global food security, particularly in low income, protein deficient countries, where it also serves as a significant contribution to poverty alleviation (FAO, 2018) 53 % Share in global food fish consumption. FAO (2018) 13 % 57,415 Share in Ghana’s total fish production 95 % Nile tilapia Majority of Ghana’s aquaculture production from the Volta Lake Need for resilient aquaculture sector through diversified culture species 4
- 5. Introduction: Statement of the problem PHOTO: Women and children harvesting oysters at low tide 5
- 6. Introduction: Statement of the problem The mangrove oyster fishery remains unregulated and its large- scale culture has not been attempted due to paucity of relevant scientific information. For a successful extensive aquaculture of marine bivalve molluscs; Mann (1983) prescribes proper methods for obtaining seed are required. Initial tests for spatial and temporal distribution of the seed and optimum spatfall (Cendejas et al., 1985) are essential information gaps that first need to be addressed. Previous works (Yankson, 1974; Obodai & Yankson, 2000) 6
- 7. Introduction: Research Objectives 1. Test the effectiveness of collectors prepared from locally available materials for collecting C. tulipa spat, 2. Assess the influence of collector orientation on C. tulipa spatfall, 3. Estimate mean spatfall at different depths and different locations to establish spatial and temporal distribution and abundance of C. tulipa spat, 4. Determine the growth of C. tulipa spat cultured on selected collector materials and at different depths, 5. Assess some physical and chemical hydrographic conditions of the coastal water bodies and their possible effects on C. tulipa spatfall regimes and growth, 6. Identify fouling organisms and determine their seasonal and spatial occurrences, and 7. Map out suitable oyster spat collection areas and bathymetry of the selected water bodies. 7
- 8. Introduction: Research Objectives 1. Test the effectiveness of collectors prepared from locally available materials for collecting C. tulipa spat, 2. Assess the influence of collector orientation on C. tulipa spatfall, 3. Estimate mean spatfall at different depths and different locations to establish spatial and temporal distribution and abundance of C. tulipa spat, 4. Determine the growth of C. tulipa spat cultured on selected collector materials and at different depths, 5. Assess some physical and chemical hydrographic conditions of the coastal water bodies and their possible effects on C. tulipa spatfall regimes and growth, 6. Identify fouling organisms and determine their seasonal and spatial occurrences, and 7. Map out suitable oyster spat collection areas and bathymetry of the selected water bodies. The study sought to identify strategies for optimising Crassostrea tulipa seed harvests and growth to support its mass production in coastal water bodies in Ghana 8
- 9. Introduction: Significance of the study • The significance of this study is deeply rooted in the values of sustainable development and social and economic empowerment, especially of women and children. • potential to enhance the nutrition and health of coastal inhabitants 9
- 10. PRESENTATION OUTLINE MATERIALS AND METHODS RESULTS AND DISCUSSION CONCLUSION RECOMMENDATIONS INTRODUCTION MATERIALS AND METHODS 10
- 11. Materials and Methods: Study sites Figure 1: Study areas: (A) Densu Delta (B) Narkwa Lagoon (C) Benya Lagoon (D) Whin Estuary 11
- 12. Materials and Methods: Preparing experimental spat collectors and mounting of racks Figure 2: Oyster spat collector materials tested for effectiveness (a) coconut shell, (b) fine mesh nylon net (mosquito net), (c) oyster shell (recycled), (d) PVC slats and (e) ceramic tiles Figure 3: Installation of racks and setting of collectors: Researcher (in life jacket) being assisted to set up experimental rack at (a) ST3 of Benya Lagoon at low tide; (b) diving is required at stations with deep waters (ST2 of Densu Delta), and (c) collectors being fitted to racks. Surface area determined for each cultch Ceramic tile = 10 cm × 10 cm = 100 cm2 PVC = 106 cm2 Coconut and Oyster shells = Irregular; Varied Total number of cultches 540 + 540 + 180 = 1,260 (and more) 12
- 13. Materials and Methods: Experimental Design and Setup Figure 4: Collectors arranged in vertical series in 0° deg position on rack (not to scale) Cultch/Collector type: 5 4 Coconut shell Nylon mesh Oyster shell PVC Ceramic tile Water body: 4 Densu Delta Narkwa Lagoon Benya Lagoon Whin Estuary Station: 12 11 1, 2, 3 (×4) = 12 (-1) Depth: 3 Top Middle Bottom Month: 12 November 2017 to October 2018 Spatfall Experiment Growth Experiment Fouling 13
- 14. Materials and Methods: Field Sampling and Data Collection In-situ measurements of hydrographic factors (YSI multiparameter instrument) Laboratory activities Spat counts Spat measurement; SH (0.50 mm) Removal and replacement of spat collectors Field sampling Shell measurements growth exp.; Shell height (SH), Shell length (SL) Depth profiling of water bodies Identifying foulers Estimating fouling (Scale: 0 – 4) + 1 - 25 % ++ 26 - 50 % +++ 51 – 75 % ++++ 76 – 100 % Coverage on collector Adult C. tulipa showing shell dimensions C. tulipa spat showing shell height 14
- 15. Materials and Methods: Field Sampling and Data Collection In-situ measurements of hydrographic factors (YSI multiparameter instrument) Laboratory activities Spat counts Spat measurement; SH (0.50 mm) Removal and replacement of spat collectors Field sampling Shell measurements growth exp.; Shell height (SH), Shell length (SL) Depth profiling of water bodies Identifying foulers Estimating fouling (Scale: 0 – 4) + 1 - 25 % ++ 26 - 50 % +++ 51 – 75 % ++++ 76 – 100 % Coverage on collector Adult C. tulipa showing shell dimensions C. tulipa spat showing shell height Researcher measures C. tulipa spat in the laboratory 15
- 16. Materials and Methods: Field Sampling and Data Collection In-situ measurements of hydrographic factors (YSI multiparameter instrument) Laboratory activities Spat counts Spat measurement; SH (0.50 mm) Removal and replacement of spat collectors Field sampling Shell measurements growth exp.; Shell height (SH), Shell length (SL) Depth profiling of water bodies Identifying foulers Estimating fouling (Scale: 0 – 4) + 1 - 25 % ++ 26 - 50 % +++ 51 – 75 % ++++ 76 – 100 % Coverage on collector Adult C. tulipa showing shell dimensions C. tulipa spat showing shell height Researcher measures C. tulipa spat in the laboratory Magnifying small spat and using a divider for measurements 16
- 17. Materials and Methods: Data Analysis Two-sample t-test and Analysis of Variance (ANOVA; One-Way, Two-Way, Multi-Way using Minitab 17 Statistical Software) Tukey’s Pairwise and Simultaneous Comparisons Honestly (Highest) Significant Unit (Hsu) Multiple Comparison with Best (MCB) “Station” was nested into “Water body” Homogeneity was confirmed with Bartlett's test and the appropriate data transformation to Log10 (x + 1) applied before ANOVA, where necessary. Linear regression model was used for determining hydrographic predictors of spatfall and shell growth Absolute growth rate AGR = 𝐹𝐹𝐹𝐹 𝐹𝐹 𝐹𝐹𝐹𝐹 𝑆𝑆𝑆𝑆 – 𝐼𝐼𝐼𝐼𝐼𝐼𝐼𝐼𝐼𝐼𝐼𝐼𝐼𝐼 𝑆𝑆𝑆𝑆 𝑁𝑁𝑁𝑁𝑁𝑁𝑁𝑁𝑁𝑁𝑁𝑁 𝑜𝑜𝑜𝑜 𝑑𝑑𝑑𝑑𝑑𝑑𝑑𝑑 … . . (Equation 1) ArcGIS ArcMap ver. 10.3 Estimating spatfall �𝑿𝑿 Sf = 𝒏𝒏−𝟏𝟏 . � 𝒊𝒊=1 𝒏𝒏 Sfi 17
- 18. PRESENTATION OUTLINE MATERIALS AND METHODS RESULTS AND DISCUSSION CONCLUSION RECOMMENDATIONS INTRODUCTION RESULTS AND DISCUSSION 18
- 19. Results and Discussion: Collector effectiveness and orientation for optimising C. tulipa spat collection Figure 5: Mean (±S.E.) spatfall on experimental spat collectors in each of the four water bodies. Arabic alphabets show ANOVA comparison between collectors within the same water body only. Means with different alphabets are significantly different (One-way ANOVA: P < 0.05). Whin EstuaryBenya LagoonNarkwa LagoonDensu Delta 4000 3500 3000 2500 2000 1500 1000 500 0 Meanspatfall(spat/m) Coconut shell Oyster shell PVC Ceramic tile Collector 2 b I a a a I I I b a ab a b a a a b ab a a I I I I II II II II III III III III Water body wall tiles (Yankson, 1974), oyster shells (Yankson, 1974; Obodai, 1990) and coconut shells (Obodai, 1990; Obodai, 1997; Asare, 2017) Differences in spatfall probably due to: Surface contour (Taylor et al., 1998a) Hard nature of surfaces Water absorption capacity of coconut shells (Rao, Swaroop, Rao, & Bharath, 2015) Stability in water column (Ceramic tile = 200 g; others < 50 g each) Considerations for selection: Economic (labour, durability, cost, etc.) Purpose of spat collection 1 19
- 20. Results and Discussion: Collector effectiveness and orientation for optimising C. tulipa spat collection Figure 6: Mean (±S.E.) spat settlement on upper- ( ) and under- ( ) horizontal surfaces of experimental collectors (all 12 months pooled) in two positional orientations ("Face down" and "Face up") in Densu Delta and Narkwa Lagoon. CTPVCOSCS 100 80 60 40 20 0 CTPVCOSCS CTPVCOSCS CTPVCOSCS Percentmeanspatfall 50 1238 2461 2880 2651 2168 3165 3112 3451 710 1220 1393 1769 134 276 346 373 Mean spatfall values: Collector material Densu Delta Narkwa Lagoon Benya Lagoon Whin Estuary * * * * * * * * * * * * * * * * (Hopkins, 1937; Schaefer, 1937; Cole & Knight-Jones, 1939; Taylor et al., 1998a) 1 20
- 21. Results and Discussion: Collector effectiveness and orientation for optimising C. tulipa spat collection Figure 6: Mean (±S.E.) spat settlement on upper- ( ) and under- ( ) horizontal surfaces of experimental collectors (all 12 months pooled) in two positional orientations ("Face down" and "Face up") in Densu Delta and Narkwa Lagoon. CTPVCOSCS 100 80 60 40 20 0 CTPVCOSCS CTPVCOSCS CTPVCOSCS Percentmeanspatfall 50 1238 2461 2880 2651 2168 3165 3112 3451 710 1220 1393 1769 134 276 346 373 Mean spatfall values: Collector material Densu Delta Narkwa Lagoon Benya Lagoon Whin Estuary * * * * * * * * * * * * * * * * (Hopkins, 1937; Schaefer, 1937; Cole & Knight-Jones, 1939; Taylor et al., 1998a) 1 21
- 22. Narkwa LagoonDensu Estuary Face upFace downFace upFace down 3500 3000 2500 2000 1500 1000 500 0 Numberofsettledspat/m Upper-horizontal Under-horizontal Collector Surface 2 Figure 7: Mean (±S.E.) spat settlement on upper- ( ) and under- ( ) horizontal surfaces of experimental collectors (all 4 collectors pooled) in two positional orientations ("Face down" and "Face up") in Densu Delta and Narkwa Lagoon. UPPER UNDER Results and Discussion: Collector effectiveness and orientation for optimising C. tulipa spat collection1 22
- 23. Narkwa LagoonDensu Estuary Face upFace downFace upFace down 3500 3000 2500 2000 1500 1000 500 0 Numberofsettledspat/m Upper-horizontal Under-horizontal Collector Surface 2 Figure 7: Mean (±S.E.) spat settlement on upper- ( ) and under- ( ) horizontal surfaces of experimental collectors (all 4 collectors pooled) in two positional orientations ("Face down" and "Face up") in Densu Delta and Narkwa Lagoon. UPPER UNDER Results and Discussion: Collector effectiveness and orientation for optimising C. tulipa spat collection Phototaxis (light) Ostrea edulis attach in daylight (Cole and Knight- Jones, 1939); C. virginica attachment encouraged by dark and partially inhibited by light (Shaw, Arnold and Stallworthy, (1970) Ajana (1979) - C. gasar (=tulipa) settlement on shaded collectors. Geotaxis (gravity) Geosensory statocysts (Baker, 1997) Swimming posture of pediveliger Upward movement with foot and velum uppermost (Cole & Knight-Jones, 1939; Galtsoff, 1964; Cranfield, 1974) 1 Probable reasons for this observation 23
- 24. Results and Discussion: Spatial and temporal abundance of C. tulipa spat in coastal water bodies in Ghana Source of variation df Adj SS Adj MS F P Month 11 2905.7 264.2 817.18 0.000 Waterbody 3 2129.3 709.8 2195.78 0.000 Station (waterbody) 7 98.4 14.1 43.49 0.000 Depth 2 716.6 358.3 1108.46 0.000 Month × waterbody 33 1636.5 49.6 153.41 0.000 Month × station(Waterbody) 77 720.7 9.4 28.95 0.000 Month × depth 22 70.1 3.2 9.86 0.000 Waterbody × depth 6 146.5 24.4 75.52 0.000 Month × waterbody × depth 66 351.6 5.3 16.48 0.000 Station × depth (waterbody) 14 250.8 17.9 55.42 0.000 Month × station × depth (waterbody) 154 287.4 1.9 5.77 0.000 Error 4356 1408.1 0.3 Total 4751 10466 Table 1 – Results of a Four-Way Nested ANOVA for Effects of Spatial (Water Body, Station [Water Body] and Depth) and Temporal (Month) Factors on Settlement of C. tulipa Spat Significant spatial and temporal differences in C. tulipa spatfall (p < 0.05) 2 24
- 25. Results and Discussion: Spatial and temporal abundance of C. tulipa spat in coastal water bodies in Ghana Figure 8: Mean (±S.E.) spatfall on experimental spat collectors in each of the four water bodies. Boldface Roman numerals show ANOVA comparison between water bodies for each type of collector. Means with different numerals are significantly different (One-way ANOVA: P < 0.05). Whin EstuaryBenya LagoonNarkwa LagoonDensu Delta 4000 3500 3000 2500 2000 1500 1000 500 0 Meanspatfall(spat/m) Coconut shell Oyster shell PVC Ceramic tile Collector 2 b I a a a I I I b a ab a b a a a b ab a a I I I I II II II II III III III III Water body Narkwa Lagoon Densu Delta Benya Lagoon Whin Estuary 1.3 × 2.5 × 9.8 × Bottom Sediment Mangrove Roots Probably due to: Differences in hydrography (e.g. DO, Salinity) Genetic variations in reproductive capacities Adult Oysters Differences in spatfall among water bodies 2 25
- 26. DENSU DELTA Figure 9: Map showing depth profile at low tide (June 2018), oyster presence and availability of C. tulipa spat in the estuarine section of Densu Delta. Differences in spatfall among stations and depthsDifferences in spatfall at stations and depths Results and Discussion: Spatial and temporal abundance of C. tulipa spat in coastal water bodies in Ghana2 26
- 27. DENSU DELTA Figure 9: Map showing depth profile at low tide (June 2018), oyster presence and availability of C. tulipa spat in the estuarine section of Densu Delta. Differences in spatfall among stations and depthsDifferences in spatfall at stations and depths Results and Discussion: Spatial and temporal abundance of C. tulipa spat in coastal water bodies in Ghana2 10000 5000 0 Densu Delta OctSepAugJulJunMayAprMarFebJanDecNov 0 2017 2018 Meannumberofspat/m2 ST1 ST2 Figure 10: Mean (±S.E.) monthly spatfall (spat m-2) at stations (ST) in the Densu Delta pooled from all collectors and different depths. Monthly variations in spatfall at stations 27
- 28. DENSU DELTA Figure 9: Map showing depth profile at low tide (June 2018), oyster presence and availability of C. tulipa spat in the estuarine section of Densu Delta. Differences in spatfall among stations and depthsDifferences in spatfall at stations and depths Results and Discussion: Spatial and temporal abundance of C. tulipa spat in coastal water bodies in Ghana2 28
- 29. DENSU DELTA Figure 9: Map showing depth profile at low tide (June 2018), oyster presence and availability of C. tulipa spat in the estuarine section of Densu Delta. Differences in spatfall among stations and depthsDifferences in spatfall at stations and depths Results and Discussion: Spatial and temporal abundance of C. tulipa spat in coastal water bodies in Ghana2 10000 5000 0 Densu Delta OctSepAugJulJunMayAprMarFebJanDecNov 0 2017 2018 Meannumberofspat/m2 ST1 ST2 Figure 10: Mean (±S.E.) monthly spatfall (spat m-2) at stations (ST) in the Densu Delta pooled from all collectors and different depths. Monthly variations in spatfall at stations 29
- 30. NARKWA LAGOON Figure 11: Map showing depth profile at low tide (June 2018), oyster presence and availability of C. tulipa spat in the Narkwa Lagoon. Differences in spatfall at stations and depths Results and Discussion: Spatial and temporal abundance of C. tulipa spat in coastal water bodies in Ghana2 30
- 31. NARKWA LAGOON Figure 11: Map showing depth profile at low tide (June 2018), oyster presence and availability of C. tulipa spat in the Narkwa Lagoon. Differences in spatfall at stations and depths Results and Discussion: Spatial and temporal abundance of C. tulipa spat in coastal water bodies in Ghana2 10000 5000 0 Narkwa Lagoon OctSepAugJulJunMayAprMarFebJanDecNov 0 2017 2018 Meannumberofspat/m2 ST1 ST2 ST3 Figure 12: Mean (±S.E.) monthly spatfall (spat m-2) at stations (ST) in the Narkwa Lagoon pooled from all collectors and different depths. Monthly variations in spatfall at stations 31
- 32. Results and Discussion: Spatial and temporal abundance of C. tulipa spat in coastal water bodies in Ghana BENYA LAGOON Figure 13: Map showing depth profile at low tide (June 2018), oyster presence and availability of C. tulipa spat in the Benya Lagoon. Differences in spatfall at stations and depths 2 32
- 33. Results and Discussion: Spatial and temporal abundance of C. tulipa spat in coastal water bodies in Ghana BENYA LAGOON Figure 13: Map showing depth profile at low tide (June 2018), oyster presence and availability of C. tulipa spat in the Benya Lagoon. Differences in spatfall at stations and depths 2 10000 5000 0 Benya Lagoon Meannumberofspat/m2 OctSepAugJulJunMayAprMarFebJanDecNov 0 2017 2018 ST1 ST2 ST3 Figure 14: Mean (±S.E.) monthly spatfall (spat m-2) at stations (ST) in the Benya Lagoon pooled from all collectors and different depths. Monthly variations in spatfall at stations 33
- 34. WHIN ESTUARY Figure 15: Map showing depth profile at low tide (June 2018), oyster presence and availability of C. tulipa spat in the Whin Estuary. Differences in spatfall at stations and depths Results and Discussion: Spatial and temporal abundance of C. tulipa spat in coastal water bodies in Ghana2 34
- 35. WHIN ESTUARY Figure 15: Map showing depth profile at low tide (June 2018), oyster presence and availability of C. tulipa spat in the Whin Estuary. Differences in spatfall at stations and depths Results and Discussion: Spatial and temporal abundance of C. tulipa spat in coastal water bodies in Ghana2 OctSepAugJulJunMayAprMarFebJanDecNov 10000 5000 0 ST1 ST2 ST3 2017 2018 Whin Estuary Meannumberofspat/m2 Figure 16: Mean (±S.E.) monthly spatfall (spat m-2) at stations (ST) in the Whin Estuary pooled from all collectors and different depths. Monthly variations in spatfall at stations 35
- 36. Results and Discussion: Spatial and temporal abundance of C. tulipa spat in coastal water bodies in Ghana Water body Dry season (Nov-17 - Apr-18) Wet season (May-18 - Oct-18) Spat m-2 (± SE) Month-Yr Spat m-2 (± SE) Month-Yr Densu Estuary Mean 3058 ± 171 1689 ± 188 Minimum 826 ± 104 Nov-17 0 ± 0.00 Jul, Sep, Oct - 18 Maximum 5255 ± 374 Feb-18 7918 ± 727 May-18 Narkwa Lagoon Mean 5724 ± 209 413.7 ± 25.4 Minimum 1932 ± 159 Mar-18 160.9 ± 28.4 Sep-18 Maximum 8245 ± 508 Feb-18 792.3 ± 75.4 May-18 Benya Lagoon Mean 658.1 ± 25.3 1919 ± 108 Minimum 73.65 ± 9.51 Mar-18 133.6 ± 14.7 Sep-18 Maximum 1030.8 ± 73.6 Apr-18 5393 ± 367 May-18 Whin Estuary Mean 231.6 ± 26.5 393.2 ± 46.6 Minimum 31.62 ± 6.09 Nov-17 0 ± 0.00 Sep, Oct - 18 Maximum 854 ± 137 Jan-18 2005 ± 217 May-18 All water bodies Mean 2359.6 ± 80.6 1050.4 ± 49.6 (pooled) Minimum 760.6 ± 61.6 Mar-18 80.31 ± 9.47 Sep-18 Maximum 3404 ± 233 Feb-18 3673 ± 222 May-18 Table 2 - Spat Settlement m-2 (mean ± S.E., minimum, maximum) in the Dry and Wet Seasons in the Different Water Bodies 2 36
- 37. Results and Discussion: Relationship between hydrographic conditions, spatfall and spat growth 33 32 31 30 29 28 27 26 25 24 Temperature(°C) 12 10 8 6 4 2 0 Dissolvedoxygen(mg/L) Desnsu Delta Narkwa Lagoon Benya Lagoon Whin Estuary 70 60 50 40 30 20 10 0 Turbidity(NTU) OctSepAugJulJunMayAprMarFebJanDecNov 10 9 8 7 6 pH 2017 2018 40 30 20 10 0 Salinity(ppt) OctSepAugJulJunMayAprMarFebJanDecNov 6 2017 2018 Temperature DO Salinity Turbidity pH 2 Figure 17: Monthly mean (± SE) values for hydrographic parameters in the Densu Delta, Narkwa Lagoon, Benya Lagoon and Whin Estuary from November 2017 to October 2018 37
- 38. Results and Discussion: Relationship between hydrographic conditions, spatfall and spat growth Table 3 – Coefficients and Contributions of the Linear Regression Model for Spatfall and Growth (Shell Height) (Factors) and the Measured Hydrographic Parameters (Predictors) 2 Term Coef SE Coef Contribution 95% CI P-Value Spatfall Constant -0.550 5.290 (-11.03, 9.92) 0.917 Temperature -1.840 3.030 3.08 % (-7.83, 4.16) 0.545 DO 1.789 0.452 18.36 % (0.895, 2.683) 0.000 Salinity 0.997 0.251 9.22 % (0.500, 1.494) 0.000 Turbidity 0.331 0.406 0.29 % (-0.472, 1.134) 0.416 pH 3.430 4.010 0.40 % (-4.50, 11.36) 0.394 DF Adj SS Adj MS F-Value P-Value Regression 5 57.240 11.448 11.510 0.000 R2 31.36% Term Coef SE Coef Contribution 95% CI P-Value Growth (Shell Height) Constant -0.570 1.090 (-2.73, 1.59) 0.603 Temperature 1.153 0.607 11.89 % (-0.050, 2.357) 0.060 DO 0.260 0.092 8.51 % ( 0.0779, 0.4420) 0.006 Salinity -0.099 0.070 0.00 % (-0.2370, 0.0395) 0.160 Turbidity -0.223 0.093 3.92 % (-0.4078, -0.0378) 0.019 pH -0.198 0.811 0.04 % (-1.805, 1.409) 0.807 DF Adj SS Adj MS F-Value P-Value Regression 5 1.287 0.257 7.020 0.000 R2 24.36% 38
- 39. Results and Discussion: Growth of Cultured C. tulipa Whin EstuaryNarkwa LagoonDensu Estuary BotMidTopBotMidTopBotMidTop 70 60 50 40 30 20 10 0 Shellheight(mm) B A B a a b c c d e c Densu Delta = 0.26b Narkwa Lagoon = 0.33a Whin Estuary = 0.24b P < 0.05 Figure 18: Shell height of oysters on fouled collectors after 6 months Comparing growth of C. tulipa in the different water bodies Comparing growth of C. tulipa at different depths 3 Comparable to Asare (2017) Density independent growth in oysters (Obodai, 2000; Asare, 2017; Urban, 2000; Manley et al., 2008) Market-sized oysters (Asare, 2017) 30 spat per cultch Top < (Middle = Bottom) P < 0.05 39
- 40. Results and Discussion: Growth of Cultured C. tulipa 60 45 30 15 0 60 45 30 15 0 JulJunMayAprMarFebJanDecNovOct 60 45 30 15 0 Meanshellheight(mm) Coconut shell Oyster shell PVC slat Ceramic tile 2017 2018 Densu Delta Narkwa Lagoon Whin Estuary Comparing growth of C. tulipa on the different collectors 3 Figure 19: Monthly mean (± SE) shell heights of C. tulipa cultured on the different collectors over 9 months at the Densu Delta, Narkwa Lagoon and Whin Estuary Similar growth on collectors Highest mean SH on Ceramic tile in all water bodies Possibly an effect of xenomorphism (Quayle & Newkirk, 1989) 40
- 41. Results and Discussion: Fouling and Associated Epibiotic Organisms Figure 20: Biofoulers and mud associated with C. tulipa spat collection and culture: Serpulid worms (A) Ficopomatus spp. and (B) Spirobis sp, (C) Fistubalanus pallidus, (D) mud, (E) Chaetomorpha antennina, (F) Chondria bernardii, (G) small-sized crab (<15 mm), (H) Armases sp, (I) Sesarma sp., (J) Littorina angulifera, (K) sea anemones, (L) Brachidontes sp., (M) Membranipora arborescens, and (N) ascidians. 4 41
- 42. Results and Discussion: Fouling and Associated Epibiotic Organisms Month-Yr Densu Delta Narkwa Lagoon Benya Lagoon Whin Estuary ST 1 ST2 ST 1 ST2 ST 3 ST 1 ST2 ST 3 ST 1 ST2 ST 3 Nov-2017 CE+ C+ 0 CE++ CE+ 0 0 0 0 A++ A++ Dec-17 0 0 0 CE++ CE++ D++ D+ E+ CE+ A++ A++ Jan-2018 ACEL+ C+ 0 CDM++ C++ D+ D+ D+ CEF+ A+ AEM+ Feb-18 ACEL+ C+ 0 C+ CM+ 0 0 0 CDEF++ AM+ A+ Mar-18 ACEL+ AC+ 0 EKN+++ C+ E+ E+ E+ ACEM+ ACJM++ AC++ Apr-18 ACE+ AC+ 0 AC+ A++ D+ D+ D+ CE+ ACJ+ A+ May-18 AC+ AC+ 0 0 0 0 0 0 CE+ A++ A+ Jun-18 AC++ ACE+ D++ 0 0 0 0 0 ACE+ AJ+ A+ Jul-18 AGE+ AE+ 0 C++ C+ 0 D+ 0 E+ A+ A+++ Aug-18 CE+ A+ C+ C++++ C++ CE++ C+ C+ C+ ACI+ A+ Sep-18 0 ACE+ C+ C+++ C++ 0 C+ C+ EC+ ACI+ A+ Oct-18 0 0 0 CG+ C+ 0 B+ 0 H+ IJ+ AI+ Table 4 – Monthly Occurrence of Fouling and Epibiotic Organisms Associated with C. tulipa Spat Collection and Culture at the Different Stations in the Four Water Bodies + Degree of fouling (all foulers) for the month: ‘0’none, + low, ++ moderate, +++ heavy, ++++ extreme (A) Ficopomatus sp., (B) Spirobis sp, (C) Fistubalanus pallidus, (D) mud, (E) Chaetomorpha antennina, (F) Chondria bernardii, (G) small-sized crabs (<15 mm), (H) Armases sp, (I) Sesarma sp., (J) Littorina angulifera, (K) sea anemones, (L) Brachidontes sp., (M) Membranipora arborescens, and (N) ascidians. 42
- 43. PRESENTATION OUTLINE MATERIALS AND METHODS RESULTS AND DISCUSSION CONCLUSION RECOMMENDATIONS INTRODUCTION CONCLUSIONS 43
- 44. Conclusions Ceramic tiles, PVC and recycled oyster shells were more effective for collecting C. tulipa spat than coconut shell. 1 C. tulipa spat settled profusely on the undersides of horizontally placed collectors. 2 There were both spatial and temporal variation in the distribution of C. tulipa spat among and within the water bodies studied (Narkwa Lagoon > Densu Delta > Benya Lagoon > Whin Estuary) - Stations 2 and 3 of Narkwa best 3 ‘Market-size’ C. tulipa (59.86 ± 0.64 mm Shell Height) were produced in six months. 4 Dissolved oxygen and salinity were the most significant predictors for spatfall of C. tulipa whereas growth of the spat was most significantly affected by dissolved oxygen and turbidity. 5 Except for Ficopomatus sp., there was no marked evidence of deleterious effects of biofouling on growth of spat in this study. Fistubalanus pallidus was the ubiquitous fouling organism. 6 44
- 45. PRESENTATION OUTLINE MATERIALS AND METHODS RESULTS AND DISCUSSION CONCLUSION RECOMMENDATIONS INTRODUCTION RECOMMENDATIONS 45
- 46. Recommendations Ceramic tiles, PVC slats and Oyster shells should be selected over coconut shells. However, for commercial scale, the PVC would be ideal, as its use would facilitate easy removal of spat for cultchless culture. 1 Collectors should be placed in mid-water or close to the bottom for optimum C. tulipa spat collection and growth. 2 Spat collection in Densu Delta should be done at the southernmost section close to Faana and at the eastern section of Narkwa Lagoon. In both water bodies, this should be done from November to May. 3 46
- 47. Recommendations for further studies Assess the genetic variability of C. tulipa populations in coastal water bodies1 Determine the nutrient load and critical constituents of the diet of C. tulipa in the different water bodies 2 Elucidate the potential or otherwise of high stocking density for the intensification of C. tulipa aquaculture 3 Conduct further and extended studies of C. tulipa spatfall to have a better idea of the seasonal spatfall regimes. 4 47
- 48. References • Asare, B. (2017). Aquaculture potential of the West African mangrove oyster (Crassostrea tulipa): a case study of the species in the Narkwa lagoon of Ghana. University of Cape Coast. • Cendejas, J. M., Carvallo, G. M., & Juarez, L. (1985). Experimental spat collection and early growth of the pen shell, Pinna rugosa (pelecypoda, Pinnidae), from the Gulf of Carlifornia. Aquaculture, 48, 331-336. • Cole, H. A., & Knight-Jones, E. W. (1939). Some Observations and Experiments on the Setting Behaviour of Larvae of Ostrea edulis. ICES Journal of Marine Science, 14(1), 86–105. https://doi.org/https://doi.org/10.1093/icesjms/14.1.86 • Cranfield, H. J. (1974). Observations on the morphology of the mantle folds of the pediveliger of Ostrea edulis L. and their function during settlement. Journal of the Marine Biological Association of the United Kingdom, 54(1), 1–12. https://doi.org/10.1017/s0025315400022062 • FAO. (2018b). The State of World Fisheries and Aquaculture 2018 - Meeting the sustainable development goals. Aquaculture. Rome: FAO. • Galtsoff, P. S. (1964). The American Oyster Crassostrea virginica Gamelin: Larval development and metamorphosis. In Fishery Bulletin of the Fish and Wildlife Service (Vol. 64, pp. 355–380). Washington DC: U.S. Government Printing Office. • Hopkins, A. E. (1937). Experimental observations on spawining, larval development, and setting in the Olympia oyster Ostrea lurida. Bulletin. U.S. Bureau of Fisheries, 48(23), 439–503. • Obodai, E. A., & Yankson, K. (2000). Effect of fouling organisms on cultured oysters, Crassostrea tulipa, in three Ghanaian lagoons. Journal of Ghana Science Association, 2(2), 36–53. • Obodai, E. A. (1990). Aspects of ecology and biology of the West African Mangrove Oyster, Lamarck, occurring in some coastal waters of Ghana, West Africa. University of Cape Coast. • Obodai, E. A. (1997). Studies on the culturing of the Mangrove oyster Crassostrea tulipa in Ghana. University of Cape Coast. • Mann, R. (1983). Bivalve mollusc hatcheries: A critical appraisal of their development and a review of their potential value in enhancing the fisheries of developing nations. Mems Asoc. Latinoam. Acuicult., 5(2), 97–105. • Schaefer, M. B. (1937). Attachment of the Larvae of Ostrea gigas, the Japanese Oyster, to Plane Surfaces. Ecology, 18(4), 523–527. https://doi.org/10.2307/1930578 • Shaw, R., Arnold, D. C., & Stallworthy, W. B. (1970). Effects of Light on Spat Settlernent of the Arnerican Oyster (Crossostrea virginica). J. Fish. Res. Bd., 27, 743–748. • Rao, K. V., Swaroop, A. H. L., Rao, K. R., & Bharath, N. (2015). Study on Strength Properties of Coconut Shell Concrete. International Journal of Civil Engineering and Technology, 6(3), 42–61. • Taylor, J. J., Southgate, P. C., & Rose, R. A. (1998a). Assessment of artificial substrates for collection of hatchery-reared silver-lip pearl oyster (Pinctada maxima, Jameson) spat. Aquaculture, 162(3–4), 219–230. 48
- 49. Acknowledgement RESEARCH FUNDED BY DEPARTMENT OF FISHERIES AND AQUATIC SCIENCES POSTGRADUATE RESEARCH GRANT Supervisors - Prof. Kobina Yankson and Prof. Edward A. Obodai Project Manager (USAID/UCC Fisheries and Coastal Management Project Head of Department Members of DFAS Colleagues Field assistants 49
- 50. 50