Automating Google Workspace (GWS) & more with Apps Script
Mln presesntation very final
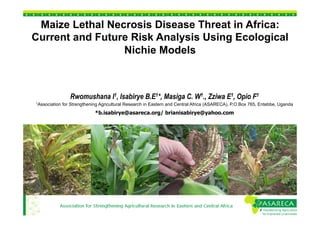
1. Maize Lethal Necrosis Disease Threat in Africa:
Current and Future Risk Analysis Using Ecological
Nichie Models
Rwomushana I1, Isabirye B.E1*, Masiga C. W1., Zziwa E1, Opio F1
1Association
for Strengthening Agricultural Research in Eastern and Central Africa (ASARECA), P.O.Box 765, Entebbe, Uganda
*b.isabirye@asareca.org/ brianisabirye@yahoo.com
2. Introduction
• Most important cereal crop: Staple food (>1.2
billion) & 34% global cereal production
• Africa grows 29 M ha & consumes 30% global
maize produce. E.A average per capita
consumption is 100 kg/ year
• Due to several constraints, Africa does not exploit
her over 80M Ha potential land for maize
production, hence imports 28% to fill the
consumption deficit.
• Maize Lethal Necrosis Disease (MLND), caused by
synergistic effect of maize chlorotic mottle virus
(MCMV) and any potyvirus: MDMV, SCMV, WSMV
has been causing maize losses lately!
• Maize production to drop by >15% by 2020 in much
of sub-Saharan Africa. Estimated loss to Africa at
$2 billion a year. Prices increase by 35% for maize
3. MLND Prevalence
• Incidence dates back to 1973 in Peru,
and in Kansas, 1976 (Castillo & Hebert,
1974; Niblett & Claflin, 1978).
• China in 2010, and by 2011 in Argentina
& Mexico (Nelson et al., 2011)
• In Africa: in Kenya in 2011 Bomet
County (Wangai, 2012), Tanzania
(Miano et al. 2013), and Uganda (CABI,
2013), Rwanda (RAB, 2013).
• Losses range btn 30-100% (FAO, 2012;
CABI, 2013). Over 15,732 ha of maize
infected, affecting over 300,000 farmers
in Kenya by mid 2012 (FSNWG, 2012).
4. Climate Change Impact on Agriculture
• Variable and uncertain weather the greatest challenges to smallscale farmers whose livelihoods
we aim to transform in ECA
• New technologies and knowledge
- hardier crops and better ways to
manage resources
• Need to address both mitigation
of and adaptation to climate
change.
4
5. The Study: Current and future Risk Analysis
• The spatiotemporal variation of MLN suitability and emergence
remains poorly understood, making it difficult to design responsive
mitigation and adaptation measures.
§ Describe the geographic distribution and ecological niche
(Grinnell, 1917) of MLN in Africa to identify potential risk areas
using a landscape epidemiology approach.
• Important first attempt in identifying the geographic areas in Africa
having the ecological conditions suitable for MLND in the
environment.
• Premise: Knowing the suitable environmental conditions for specific
vectors, hosts and pathogens in nature, one can use the landscape
to identify the spatial and temporal distribution of disease risk
(Meade & Earickson 2000; NASA 2006).
6. Landscape epidemiology with ENM
• In many cases, the details of ecologic
parameters associated with occurrences of
diseases may be unclear because of small
sample sizes, biased reporting, or simply lack of
detailed geographic or ecologic analysis.
• ENM has a suite of tools that relate known
occurrences of these phenomena to raster
geographic information system layers that
summarize variation in several environmental
dimensions.
• The result is an objective, quantitative picture of
how what is known about a species or
phenomenon relates to environmental variation
across a landscape.
7. Disease ENM: Proof of Concept
Characterization of ecologic features of
outbreaks of hemorrhagic fever caused by
Ebola and Marburg viruses
8. Methods for ENM of MLND
Geographic Space
Ecological Space
occurrence points on current distribution
Current
Current range prediction
Future range prediction
Model of niche in ecological
dimensions
precipitation
ecological niche modeling
Projection back onto geography
Variable
Bio1
Bio2
Bio3
Bio4
Bio5
Bio6
Bio7
Bio8
Bio9
Bio10
Bio11
Bio12
Bio13
Bio14
Bio15
Bio16
Bio17
Bio18
Bio19
!
temperature
Variable type
Annual mean temperature
Mean diurnal range: mean of monthly)
Isothermality: (P2/P7) × 100
Temperature seasonality (SD × 100)
Maximum temperature of warmest month
Minimum temperature of coldest month
Temperature annual range (P5 – P6)
Mean temperature of wettest quarter
Mean temperature of driest quarter
Mean temperature of warmest quarter
Mean temperature of coldest quarter
Annual precipitation
Precipitation of wettest month
Precipitation of driest month
Precipitation seasonality
Precipitation of wettest quarter
Precipitation of driest quarter
Precipitation of warmest quarter
Precipitation of coldest quarter
9. Methods for ENM of MLND…
1. Extensive Survey by Several Partners and laboratory confirmation with PCR, FERA-UK
2. Literature review for reported detections in region
3. GARP: Genetic algorithm that uses a set of phenomena point
localities and a set of geographic layers representing the limiting
environmental parameters.
4. Both current (1950-2000) and future (2020 and 2050)
Scenarios were used (IPCC).
10. Results
1. Current Risk: Potential distribution and Hotspots
MLN Records in Africa
Current Potential Risk Areas
Hot Spots distribution
Eastern and Central Africa, and Southern and Mid-West Africa show suitability of MLN, with majority of
hotspots located in the humid and sub-humid central and eastern Africa
11. Results…
2. Future Risk: 2020 Potential distribution & Hotspots
2020 Period Potential Risk Areas
2020 Hotspots distribution
Shrinkages in MLN suitability predicted, with much of West Africa, Madagascar and Southern Africa
becoming less suitable, but Eastern Africa will remain hotspots.
12. Results…
3. Future Risk: 2050 Potential distribution & Hotspots
2050 Period Potential Risk Areas
2050 Hotspots distribution
Shrinkages in MLN suitability predicted, with much of West Africa, Madagascar and
Southern Africa becoming less suitable, but Eastern Africa will remain hotspots.
13. Results…Limiting Factors
Temperature (isothermality, annual range and mean temperature of coldest quarter) and precipitation
(precipitation of the wettest month and quarter) had the greatest effect on the models
14. Conclusions
• MLND Risk in Africa is high! Predictive tests based on independent
distributional data indicate that model predictions are robust (ROC and
Kappa values ranging between 85 and 99%), while field observations
confirm relationships between incidence and model predictions.
• There is need for better allocation of resources in the management of MLN,
with special emphasis in the Eastern and Central African region which will
remain a hotspot up to 2050.
• Landscape based epidemiology can resolve spatial resolution of geographic
risk for current and emerging diseases. Propose inclusion in regional and
national Early Warning Initiatives.
15. Thanks!!!
WORKSHOP TO DEVELOP A STRATEGIC PLAN FOR MAIZE LETHAL NECROSIS
DISEASE FOR ECA, JACARANDA HOTEL, NAIROBI, KENYA, 21-23 AUGUST 2013.