SlideShare ist ein Scribd-Unternehmen logo
1 von 1
Downloaden Sie, um offline zu lesen
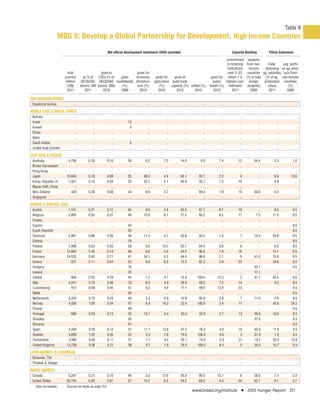
Table 9
                         MDG 8: Develop a Global Partnership for Development, High Income Countries
                                                               Net official development assistance (ODA) provided                                     Capacity Building          Policy Coherence

                                                                                                                                                 commitment       students
                                                                                                                                                  to fostering   from low-      trade-    avg. tariffs
                                                                                                                                                 institutions,     income    distorting on ag. prod-
                              total                  given to            given for                                                                rank (1-23,     countries ag. subsidies ucts from
                            (current     as % of    LDCs (% of  given    economic               given for    given to                  given for where 1 is      (% of total (% of ag. low-income
                             million   OECD/DAC OECD/DAC multilaterally infrastruc-            agriculture build trade                  public highest com-        foreign   production countries
                              US$)     donors' GNI donors' GNI)  (%)      ture (%)                 (%)     capacity (%) untied (%)    health (%) mittment)        students)     value)       (%)
                              2011        2011        2010      2009        2010                  2010        2010        2010           2010         2011          2009         2011       2008

SUB-SAHARAN AFRICA
     Equatorial Guinea            ..            ..               ..          ..           ..           ..             ..         ..           ..           ..            ..           ..           ..

MIDDLE EAST & NORTH AFRICA
     Bahrain                      ..            ..               ..          ..           ..           ..             ..         ..           ..           ..            ..           ..           ..
     Israel                       ..            ..               ..         14            ..           ..             ..         ..           ..           ..            ..           ..           ..
     Kuwait                       ..            ..               ..          0            ..           ..             ..         ..           ..           ..            ..           ..           ..
     Oman                         ..            ..               ..          ..           ..           ..             ..         ..           ..           ..            ..           ..           ..
     Qatar                        ..            ..               ..          ..           ..           ..             ..         ..           ..           ..            ..           ..           ..
     Saudi Arabia                 ..            ..               ..          3            ..           ..             ..         ..           ..           ..            ..           ..           ..
     United Arab Emirtes          ..            ..               ..          ..           ..           ..             ..         ..           ..           ..            ..           ..           ..

EAST ASIA & PACIFIC
     Australia                4,799          0.35          0.10             36          6.2          7.0           14.0        0.0          7.4          12           64.4          3.3          1.0
     Brunei Darussalam            ..            ..            ..             ..           ..           ..             ..         ..           ..          ..             ..           ..           ..
     Hong Kong                    ..            ..            ..             ..           ..           ..             ..         ..           ..          ..             ..           ..           ..
     Japan                   10,604          0.18          0.08             25         48.0          4.4           63.1       93.7          2.2           4              ..         6.0         10.6
     Korea, Republic of       1,321          0.12          0.04             33         33.7          5.1           40.9       35.7          7.3          10              ..         4.9            ..
     Macao SAR, China             ..            ..            ..             ..           ..           ..             ..         ..           ..          ..             ..           ..           ..
     New Zealand                429          0.28          0.08             34          6.6          2.7              ..      89.4          7.9          18           30.6          0.2            ..
     Singapore                    ..            ..            ..             ..           ..           ..             ..         ..           ..          ..             ..           ..           ..

EUROPE & CENTRAL ASIA
     Austria                  1,107          0.27          0.12             65          9.9          2.4           23.5       67.7          8.1          19              ..         9.3          9.5
     Belgium                  2,800          0.53          0.31             48         10.8          8.1           37.2       93.2          8.5          17            7.5         17.0          9.5
     Croatia                      ..            ..            ..             ..           ..           ..             ..         ..           ..          ..             ..           ..           ..
     Cyprus                       ..            ..            ..            44            ..           ..             ..         ..           ..          ..             ..           ..         9.5
     Czech Republic               ..            ..            ..            55            ..           ..             ..         ..           ..          ..             ..           ..         9.5
     Denmark                  2,981          0.86          0.36             36         11.4          4.7           30.6       93.5          1.3           1           14.4         26.9          9.5
     Estonia                      ..            ..            ..            79            ..           ..             ..         ..           ..          ..             ..           ..         9.5
     Finland                  1,409          0.52          0.20             56          8.0         13.3           33.7       84.3          3.8           6              ..         6.5          9.5
     France                  12,994          0.46          0.14             46          8.8          3.9           24.2       96.6          1.9          16              ..        14.1          9.5
     Germany                 14,533          0.40          0.11             41         34.1          4.2           44.4       96.0          2.1           9           41.0         15.6          9.5
     Greece                     331          0.11          0.04             53          8.6          0.6           13.2       62.2          2.9          23              ..        18.6          9.5
     Hungary                      ..            ..            ..            76            ..           ..             ..         ..           ..          ..          30.7            ..         9.5
     Iceland                      ..            ..            ..            25            ..           ..             ..         ..           ..          ..          17.1            ..           ..
     Ireland                    904          0.52          0.29             45          1.2          9.1           16.0      100.0         12.0           2           31.7         45.2          9.5
     Italy                    4,241          0.19          0.06             78          6.5          4.0           28.9       58.5          7.5          14              ..         9.3          9.5
     Luxembourg                 413          0.99          0.40             47          6.2          4.0           17.1       99.0         13.0          22              ..           ..         9.5
     Malta                        ..            ..            ..            45            ..           ..             ..         ..           ..          ..             ..           ..         9.5
     Netherlands              6,324          0.75          0.24             40          3.2          0.9           10.9       92.9          2.8           7           11.5          5.8          9.5
     Norway                   4,936          1.00          0.34             47          6.9         14.3           32.0      100.0          3.4          11              ..        45.6         24.5
     Poland                       ..            ..            ..            69            ..           ..             ..         ..           ..          ..             ..           ..         9.5
     Portugal                   669          0.29          0.13             52         19.7          0.4           23.4       32.9          2.7          13           39.9         10.0          9.5
     Slovakia                     ..            ..            ..            62            ..           ..             ..         ..           ..          ..          57.6            ..         9.5
     Slovenia                     ..            ..            ..            61            ..           ..             ..         ..           ..          ..             ..           ..         9.5
     Spain                    4,264          0.29          0.12             51         11.1         13.8           37.3       76.2          4.0          15           40.3         11.3          9.5
     Sweden                   5,606          1.02          0.30             52          5.0          2.8           19.3      100.0          4.0           3           31.9          7.6          9.5
     Switzerland              3,086          0.46          0.11             37          7.1          4.5           32.1       74.0          2.9          21           18.2         32.4         13.8
     United Kingdom          13,739          0.56          0.21             56          8.1          1.8           24.4      100.0          8.4           5           35.5         15.7          9.5

LATIN AMERICA & CARIBBEAN
     Bahamas, The                 ..            ..               ..          ..           ..           ..             ..         ..           ..           ..            ..           ..           ..
     Trinidad & Tobago            ..            ..               ..          ..           ..           ..             ..         ..           ..           ..            ..           ..           ..

NORTH AMERICA
     Canada                   5,291          0.31          0.15             46          3.0         12.9           26.9       99.3         15.1           8           28.6          7.4          5.3
     United States           30,745          0.20          0.07             27         10.3          6.2           24.2       69.5          4.4          20           62.1          6.1          3.7
..     Data not availble.    Sources for tables on page 215.
                                                                                                                           www.bread.org/institute          I    2013 Hunger Report 211

Weitere ähnliche Inhalte

Ähnlich wie Table 9, mdg 8 partnership for development, high-income countries

Table 2, mdg 1 eradicate extreme hunger
Table 2, mdg 1  eradicate extreme hungerTable 2, mdg 1  eradicate extreme hunger
Table 2, mdg 1 eradicate extreme hunger
Bread for the World
 
Table 3, mdg 1 eradicate extreme poverty
Table 3, mdg 1  eradicate extreme povertyTable 3, mdg 1  eradicate extreme poverty
Table 3, mdg 1 eradicate extreme poverty
Bread for the World
 
Costa rica competitiveness report
Costa rica competitiveness reportCosta rica competitiveness report
Costa rica competitiveness report
Philippe Guitard
 
Wf gci nl 2012 2013 - test
Wf gci nl 2012 2013 - testWf gci nl 2012 2013 - test
Wf gci nl 2012 2013 - test
Rob Blaauboer
 
Wf gci nl 2012 2013 - test2
Wf gci nl 2012 2013 - test2Wf gci nl 2012 2013 - test2
Wf gci nl 2012 2013 - test2
Rob Blaauboer
 
InfoAxon profiled as a leading open source solutions company from India in Gl...
InfoAxon profiled as a leading open source solutions company from India in Gl...InfoAxon profiled as a leading open source solutions company from India in Gl...
InfoAxon profiled as a leading open source solutions company from India in Gl...
InfoAxon Technologies Limited
 
smurfit stone container 2006_AR
smurfit stone container  2006_ARsmurfit stone container  2006_AR
smurfit stone container 2006_AR
finance30
 
smurfit stone container 2006_AR
smurfit stone container  2006_ARsmurfit stone container  2006_AR
smurfit stone container 2006_AR
finance30
 
02 09 02
02 09 0202 09 02
02 09 02
env02
 
Suborbital reusable vehicles_a_10_year_forecast_of_market_demand
Suborbital reusable vehicles_a_10_year_forecast_of_market_demandSuborbital reusable vehicles_a_10_year_forecast_of_market_demand
Suborbital reusable vehicles_a_10_year_forecast_of_market_demand
Dmitry Tseitlin
 

Ähnlich wie Table 9, mdg 8 partnership for development, high-income countries (20)

Table 2, mdg 1 eradicate extreme hunger
Table 2, mdg 1  eradicate extreme hungerTable 2, mdg 1  eradicate extreme hunger
Table 2, mdg 1 eradicate extreme hunger
 
Spain
SpainSpain
Spain
 
Table 3, mdg 1 eradicate extreme poverty
Table 3, mdg 1  eradicate extreme povertyTable 3, mdg 1  eradicate extreme poverty
Table 3, mdg 1 eradicate extreme poverty
 
Costa rica competitiveness report
Costa rica competitiveness reportCosta rica competitiveness report
Costa rica competitiveness report
 
CASE Network Report 79 - Economic Feasibility, General Economic Impact and Im...
CASE Network Report 79 - Economic Feasibility, General Economic Impact and Im...CASE Network Report 79 - Economic Feasibility, General Economic Impact and Im...
CASE Network Report 79 - Economic Feasibility, General Economic Impact and Im...
 
Wf gci nl 2011 2012
Wf gci nl 2011 2012Wf gci nl 2011 2012
Wf gci nl 2011 2012
 
We4 f innovatorguide
We4 f innovatorguideWe4 f innovatorguide
We4 f innovatorguide
 
Tunisia
TunisiaTunisia
Tunisia
 
Wf gci nl 2012 2013 - test
Wf gci nl 2012 2013 - testWf gci nl 2012 2013 - test
Wf gci nl 2012 2013 - test
 
Wf gci nl 2012 2013 - test2
Wf gci nl 2012 2013 - test2Wf gci nl 2012 2013 - test2
Wf gci nl 2012 2013 - test2
 
Haiti
HaitiHaiti
Haiti
 
Trends in Sustainable Development – Small Island Developing States :: 2010-2011
Trends in Sustainable Development – Small Island Developing States :: 2010-2011Trends in Sustainable Development – Small Island Developing States :: 2010-2011
Trends in Sustainable Development – Small Island Developing States :: 2010-2011
 
InfoAxon profiled as a leading open source solutions company from India in Gl...
InfoAxon profiled as a leading open source solutions company from India in Gl...InfoAxon profiled as a leading open source solutions company from India in Gl...
InfoAxon profiled as a leading open source solutions company from India in Gl...
 
Storage Virtualization for Efficient Operations
Storage Virtualization for Efficient OperationsStorage Virtualization for Efficient Operations
Storage Virtualization for Efficient Operations
 
smurfit stone container 2006_AR
smurfit stone container  2006_ARsmurfit stone container  2006_AR
smurfit stone container 2006_AR
 
smurfit stone container 2006_AR
smurfit stone container  2006_ARsmurfit stone container  2006_AR
smurfit stone container 2006_AR
 
Financial report 2011
Financial report 2011Financial report 2011
Financial report 2011
 
02 09 02
02 09 0202 09 02
02 09 02
 
Offshore Report 2009 - EWEA
Offshore Report 2009 - EWEAOffshore Report 2009 - EWEA
Offshore Report 2009 - EWEA
 
Suborbital reusable vehicles_a_10_year_forecast_of_market_demand
Suborbital reusable vehicles_a_10_year_forecast_of_market_demandSuborbital reusable vehicles_a_10_year_forecast_of_market_demand
Suborbital reusable vehicles_a_10_year_forecast_of_market_demand
 

Mehr von Bread for the World

Table 11, us hunger & poverty trends
Table 11, us hunger & poverty trendsTable 11, us hunger & poverty trends
Table 11, us hunger & poverty trends
Bread for the World
 
Table 8, mdg 8 partnership for development, low- & middle- income countries
Table 8, mdg 8  partnership for development, low- & middle- income countriesTable 8, mdg 8  partnership for development, low- & middle- income countries
Table 8, mdg 8 partnership for development, low- & middle- income countries
Bread for the World
 
Table 7, mdg 7 ensure environmental sustainability
Table 7, mdg 7  ensure environmental sustainabilityTable 7, mdg 7  ensure environmental sustainability
Table 7, mdg 7 ensure environmental sustainability
Bread for the World
 
Table 6, mdg 6 combat hiv, malaria & other diseases
Table 6, mdg 6  combat hiv, malaria & other diseasesTable 6, mdg 6  combat hiv, malaria & other diseases
Table 6, mdg 6 combat hiv, malaria & other diseases
Bread for the World
 

Mehr von Bread for the World (20)

A Fair Deal for Workers
A Fair Deal for WorkersA Fair Deal for Workers
A Fair Deal for Workers
 
Infographic raise minwage
Infographic raise minwageInfographic raise minwage
Infographic raise minwage
 
Infographic: Full Employment
Infographic: Full EmploymentInfographic: Full Employment
Infographic: Full Employment
 
Is Hunger the New Normal in America?
Is Hunger the New Normal in America?Is Hunger the New Normal in America?
Is Hunger the New Normal in America?
 
International food-aid-reform
International food-aid-reformInternational food-aid-reform
International food-aid-reform
 
Circle of Protection Signatories
Circle of Protection SignatoriesCircle of Protection Signatories
Circle of Protection Signatories
 
2013 im-program
2013 im-program2013 im-program
2013 im-program
 
International meeting-media-kit
International meeting-media-kitInternational meeting-media-kit
International meeting-media-kit
 
June 10 agenda
June 10 agendaJune 10 agenda
June 10 agenda
 
2013 im-program-book
2013 im-program-book2013 im-program-book
2013 im-program-book
 
2013 gathering-binder
2013 gathering-binder2013 gathering-binder
2013 gathering-binder
 
2013 gathering-binder
2013 gathering-binder2013 gathering-binder
2013 gathering-binder
 
2013 gathering-binder
2013 gathering-binder2013 gathering-binder
2013 gathering-binder
 
June 10 sun cso meeting agenda
June 10 sun cso meeting agendaJune 10 sun cso meeting agenda
June 10 sun cso meeting agenda
 
Purpose statements
Purpose statementsPurpose statements
Purpose statements
 
June 10 sun cso meeting agenda
June 10 sun cso meeting agendaJune 10 sun cso meeting agenda
June 10 sun cso meeting agenda
 
Table 11, us hunger & poverty trends
Table 11, us hunger & poverty trendsTable 11, us hunger & poverty trends
Table 11, us hunger & poverty trends
 
Table 8, mdg 8 partnership for development, low- & middle- income countries
Table 8, mdg 8  partnership for development, low- & middle- income countriesTable 8, mdg 8  partnership for development, low- & middle- income countries
Table 8, mdg 8 partnership for development, low- & middle- income countries
 
Table 7, mdg 7 ensure environmental sustainability
Table 7, mdg 7  ensure environmental sustainabilityTable 7, mdg 7  ensure environmental sustainability
Table 7, mdg 7 ensure environmental sustainability
 
Table 6, mdg 6 combat hiv, malaria & other diseases
Table 6, mdg 6  combat hiv, malaria & other diseasesTable 6, mdg 6  combat hiv, malaria & other diseases
Table 6, mdg 6 combat hiv, malaria & other diseases
 

Table 9, mdg 8 partnership for development, high-income countries

  • 1. Table 9 MDG 8: Develop a Global Partnership for Development, High Income Countries Net official development assistance (ODA) provided Capacity Building Policy Coherence commitment students to fostering from low- trade- avg. tariffs institutions, income distorting on ag. prod- total given to given for rank (1-23, countries ag. subsidies ucts from (current as % of LDCs (% of given economic given for given to given for where 1 is (% of total (% of ag. low-income million OECD/DAC OECD/DAC multilaterally infrastruc- agriculture build trade public highest com- foreign production countries US$) donors' GNI donors' GNI) (%) ture (%) (%) capacity (%) untied (%) health (%) mittment) students) value) (%) 2011 2011 2010 2009 2010 2010 2010 2010 2010 2011 2009 2011 2008 SUB-SAHARAN AFRICA Equatorial Guinea .. .. .. .. .. .. .. .. .. .. .. .. .. MIDDLE EAST & NORTH AFRICA Bahrain .. .. .. .. .. .. .. .. .. .. .. .. .. Israel .. .. .. 14 .. .. .. .. .. .. .. .. .. Kuwait .. .. .. 0 .. .. .. .. .. .. .. .. .. Oman .. .. .. .. .. .. .. .. .. .. .. .. .. Qatar .. .. .. .. .. .. .. .. .. .. .. .. .. Saudi Arabia .. .. .. 3 .. .. .. .. .. .. .. .. .. United Arab Emirtes .. .. .. .. .. .. .. .. .. .. .. .. .. EAST ASIA & PACIFIC Australia 4,799 0.35 0.10 36 6.2 7.0 14.0 0.0 7.4 12 64.4 3.3 1.0 Brunei Darussalam .. .. .. .. .. .. .. .. .. .. .. .. .. Hong Kong .. .. .. .. .. .. .. .. .. .. .. .. .. Japan 10,604 0.18 0.08 25 48.0 4.4 63.1 93.7 2.2 4 .. 6.0 10.6 Korea, Republic of 1,321 0.12 0.04 33 33.7 5.1 40.9 35.7 7.3 10 .. 4.9 .. Macao SAR, China .. .. .. .. .. .. .. .. .. .. .. .. .. New Zealand 429 0.28 0.08 34 6.6 2.7 .. 89.4 7.9 18 30.6 0.2 .. Singapore .. .. .. .. .. .. .. .. .. .. .. .. .. EUROPE & CENTRAL ASIA Austria 1,107 0.27 0.12 65 9.9 2.4 23.5 67.7 8.1 19 .. 9.3 9.5 Belgium 2,800 0.53 0.31 48 10.8 8.1 37.2 93.2 8.5 17 7.5 17.0 9.5 Croatia .. .. .. .. .. .. .. .. .. .. .. .. .. Cyprus .. .. .. 44 .. .. .. .. .. .. .. .. 9.5 Czech Republic .. .. .. 55 .. .. .. .. .. .. .. .. 9.5 Denmark 2,981 0.86 0.36 36 11.4 4.7 30.6 93.5 1.3 1 14.4 26.9 9.5 Estonia .. .. .. 79 .. .. .. .. .. .. .. .. 9.5 Finland 1,409 0.52 0.20 56 8.0 13.3 33.7 84.3 3.8 6 .. 6.5 9.5 France 12,994 0.46 0.14 46 8.8 3.9 24.2 96.6 1.9 16 .. 14.1 9.5 Germany 14,533 0.40 0.11 41 34.1 4.2 44.4 96.0 2.1 9 41.0 15.6 9.5 Greece 331 0.11 0.04 53 8.6 0.6 13.2 62.2 2.9 23 .. 18.6 9.5 Hungary .. .. .. 76 .. .. .. .. .. .. 30.7 .. 9.5 Iceland .. .. .. 25 .. .. .. .. .. .. 17.1 .. .. Ireland 904 0.52 0.29 45 1.2 9.1 16.0 100.0 12.0 2 31.7 45.2 9.5 Italy 4,241 0.19 0.06 78 6.5 4.0 28.9 58.5 7.5 14 .. 9.3 9.5 Luxembourg 413 0.99 0.40 47 6.2 4.0 17.1 99.0 13.0 22 .. .. 9.5 Malta .. .. .. 45 .. .. .. .. .. .. .. .. 9.5 Netherlands 6,324 0.75 0.24 40 3.2 0.9 10.9 92.9 2.8 7 11.5 5.8 9.5 Norway 4,936 1.00 0.34 47 6.9 14.3 32.0 100.0 3.4 11 .. 45.6 24.5 Poland .. .. .. 69 .. .. .. .. .. .. .. .. 9.5 Portugal 669 0.29 0.13 52 19.7 0.4 23.4 32.9 2.7 13 39.9 10.0 9.5 Slovakia .. .. .. 62 .. .. .. .. .. .. 57.6 .. 9.5 Slovenia .. .. .. 61 .. .. .. .. .. .. .. .. 9.5 Spain 4,264 0.29 0.12 51 11.1 13.8 37.3 76.2 4.0 15 40.3 11.3 9.5 Sweden 5,606 1.02 0.30 52 5.0 2.8 19.3 100.0 4.0 3 31.9 7.6 9.5 Switzerland 3,086 0.46 0.11 37 7.1 4.5 32.1 74.0 2.9 21 18.2 32.4 13.8 United Kingdom 13,739 0.56 0.21 56 8.1 1.8 24.4 100.0 8.4 5 35.5 15.7 9.5 LATIN AMERICA & CARIBBEAN Bahamas, The .. .. .. .. .. .. .. .. .. .. .. .. .. Trinidad & Tobago .. .. .. .. .. .. .. .. .. .. .. .. .. NORTH AMERICA Canada 5,291 0.31 0.15 46 3.0 12.9 26.9 99.3 15.1 8 28.6 7.4 5.3 United States 30,745 0.20 0.07 27 10.3 6.2 24.2 69.5 4.4 20 62.1 6.1 3.7 .. Data not availble. Sources for tables on page 215. www.bread.org/institute I 2013 Hunger Report 211