Weitere ähnliche Inhalte
Ähnlich wie Table 10, us hunger & poverty by state
Ähnlich wie Table 10, us hunger & poverty by state (20)
Mehr von Bread for the World
Mehr von Bread for the World (20)
Table 10, us hunger & poverty by state
- 1. Table 10
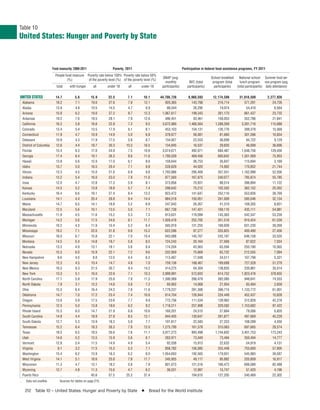
United States: Hunger and Poverty by State
Food insecurity: 2009-2011 Poverty, 2011 Participation in federal food assistance programs, FY 2011
People food insecure Poverty rate below 100% Poverty rate below 50%
SNAP (avg. School breakfast National school Summer food ser-
(%) of the poverty level (%) of the poverty level (%)
monthly WIC (total program (total lunch program vice program (avg.
total with hunger all under 18 all under 18 participants) participants) participants) (total participants) daily attendance)
UNITED STATES 14.7 5.6 15.9 22.5 7.1 10.1 44,708,726 8,960,593 12,174,599 31,818,509 2,277,926
Alabama 18.2 7.1 19.0 27.6 7.8 12.1 920,365 143,768 216,714 571,291 24,726
Alaska 13.9 4.8 10.5 14.5 4.7 6.9 86,044 26,295 19,974 54,410 6,564
Arizona 15.8 6.2 19.0 27.2 8.7 12.3 1,067,617 199,343 261,170 661,437 23,732
Arkansas 19.2 7.6 19.5 28.1 7.9 12.6 486,451 93,461 158,053 352,786 21,841
California 16.2 5.8 16.6 22.8 7.2 9.5 3,672,980 1,466,564 1,288,269 3,281,716 115,688
Colorado 13.4 5.4 13.5 17.9 6.1 8.1 453,103 104,131 126,776 399,378 15,569
Connecticut 11.9 4.7 10.9 14.9 5.0 6.8 378,677 56,081 81,660 301,596 10,834
Delaware 10.9 4.3 11.9 17.5 5.8 8.7 134,927 22,553 36,699 94,722 9,129
District of Columbia 12.6 4.4 18.7 30.3 10.3 16.5 134,845 16,537 29,830 46,699 36,690
Florida 15.4 6.3 17.0 24.9 7.5 10.8 3,074,671 492,071 684,487 1,648,756 129,450
Georgia 17.4 6.4 19.1 26.3 8.6 11.6 1,780,039 469,456 600,642 1,301,069 75,953
Hawaii 13.8 5.6 12.0 17.0 6.1 8.6 159,644 36,753 35,847 115,694 3,169
Idaho 13.7 5.0 16.5 20.4 7.1 8.8 228,629 44,020 74,902 170,852 21,744
Illinois 13.3 4.5 15.0 21.6 6.9 9.8 1,793,886 295,409 357,551 1,162,998 52,556
Indiana 13.2 5.4 16.0 23.0 7.9 11.6 877,560 167,875 240,077 785,874 55,785
Iowa 12.0 4.7 12.8 17.3 5.9 8.1 373,856 70,931 88,514 396,894 11,122
Kansas 14.5 5.2 13.8 18.8 5.7 7.4 298,642 75,212 102,502 362,152 20,262
Kentucky 16.4 6.6 19.1 27.4 8.4 13.2 823,472 141,647 252,116 553,826 39,769
Louisiana 14.1 4.4 20.4 28.8 9.4 14.4 884,519 150,051 261,009 595,046 32,134
Maine 14.7 6.5 14.1 18.8 5.2 6.9 247,943 26,267 41,319 109,305 8,651
Maryland 12.5 5.6 10.1 13.5 5.0 7.1 667,738 147,421 169,116 435,111 54,981
Massachusetts 11.9 4.5 11.6 15.2 5.3 7.3 813,631 119,099 143,363 542,347 53,239
Michigan 14.2 5.6 17.5 24.8 8.1 11.7 1,928,478 252,705 351,518 910,424 61,539
Minnesota 10.2 4.3 11.9 15.4 5.2 6.4 505,919 131,255 169,939 631,230 39,269
Mississippi 19.2 7.1 22.6 31.8 9.8 15.2 622,596 97,277 203,825 400,490 27,456
Missouri 16.0 6.7 15.8 22.1 7.0 10.4 943,088 145,767 242,187 646,158 33,520
Montana 14.5 5.4 14.8 19.7 5.8 8.5 124,243 20,164 27,569 87,622 7,034
Nebraska 13.3 4.9 13.1 18.1 5.6 8.4 174,204 43,563 63,594 250,190 10,565
Nevada 15.3 6.0 15.9 22.1 7.2 9.6 332,959 75,669 63,732 212,555 7,094
New Hampshire 9.6 4.0 8.8 12.0 4.4 6.3 113,407 17,048 24,511 107,790 5,321
New Jersey 12.3 4.5 10.4 14.7 4.8 7.0 759,136 168,467 189,688 727,528 51,279
New Mexico 16.5 6.3 21.5 30.7 9.4 14.2 414,275 64,304 138,835 230,861 35,014
New York 13.3 5.1 16.0 22.6 7.1 10.3 2,999,991 512,603 614,752 1,823,476 378,655
North Carolina 17.1 5.8 17.9 25.6 7.8 11.5 1,590,069 266,478 382,085 948,641 74,553
North Dakota 7.8 3.1 12.2 14.6 5.8 7.2 60,902 14,068 21,954 83,484 2,659
Ohio 15.5 6.4 16.4 24.2 7.6 11.6 1,779,237 281,306 396,715 1,133,772 61,001
Oklahoma 14.7 7.0 17.2 23.4 7.4 10.6 614,704 126,944 224,449 452,437 10,628
Oregon 13.6 5.9 17.5 23.6 7.7 9.9 772,756 111,534 139,962 312,828 42,278
Pennsylvania 12.5 5.0 13.8 19.6 6.2 9.2 1,718,211 257,908 329,582 1,153,682 97,422
Rhode Island 15.5 6.0 14.7 21.9 6.8 10.6 160,201 24,515 27,664 79,006 6,820
South Carolina 14.8 4.4 18.9 27.8 8.5 13.1 844,405 130,647 261,877 497,669 45,229
South Dakota 12.7 5.3 13.9 18.2 5.9 7.7 101,817 22,583 27,253 108,289 4,550
Tennessee 15.2 6.4 18.3 26.3 7.9 12.0 1,275,790 161,578 310,063 697,665 28,574
Texas 18.5 6.5 18.5 26.6 7.6 11.1 3,977,273 993,498 1,744,602 3,401,753 173,243
Utah 14.6 5.2 13.5 15.9 5.6 6.1 283,971 73,049 73,494 350,494 14,777
Vermont 12.8 5.4 11.5 14.9 4.9 5.4 92,038 15,913 22,633 54,919 4,131
Virginia 9.1 3.2 11.5 15.3 5.3 7.1 858,782 156,085 253,448 755,600 57,905
Washington 15.4 6.2 13.9 18.3 6.2 8.0 1,054,693 192,565 179,931 545,983 39,587
West Virginia 14.1 5.1 18.6 25.8 7.8 11.7 345,955 49,117 95,882 205,809 16,917
Wisconsin 11.3 4.7 13.1 18.2 5.8 7.9 801,073 121,516 166,472 606,089 82,488
Wyoming 12.7 4.8 11.3 15.6 4.7 6.2 36,031 12,997 15,747 57,420 4,196
Puerto Rico .. .. 45.6 57.5 25.3 37.4 .. 194,615 127,205 340,469 22,302
.. Data not availble. Sources for tables on page 215.
212 Table 10 – United States: Hunger and Poverty by State I Bread for the World Institute