C4.06: Towards continental-scale operational ocean and coastal monitoring using Earth Observation data in Australia - Thomas Schroeder

Regionally tuned algorithms that deliver remotely sensed marine water quality products from the MODIS/Aqua sensor have been developed and validated for the Great Barrier Reef (GBR). Through the eReefs partnership, these algorithms are being transferred from the research domain and being deployed operationally via the national meteorological agency. Furthermore they are being adapted to work with two other ocean colour satellite instruments, SeaWiFS and VIIRS/NPP to enable extension of the monitoring time series, both historically and into the future. The production infrastructure to manage contemporary data flows from the VIIRS sensor is similarly being extended. In parallel, the validated remote sensing products are being integrated into a hydrodynamic and bio-geochemical regional ocean model through data assimilation to provide a holistic suite of monitoring products for the GBR. This work is being undertaken with the goal of expanding the monitoring to more of Australia's marine jurisdiction. While the remote sensing algorithms themselves are parameterised for the atmospheric and optical characteristics of the GBR region, they are inherently flexible and are progressively being applied and tested in other locations where suitable in situ data are available. The data processing system for the GBR already is nested within the national data production operated by the Integrated Marine Observing System.

Empfohlen
Empfohlen
Weitere ähnliche Inhalte
Was ist angesagt?
Was ist angesagt? (20)
Ähnlich wie C4.06: Towards continental-scale operational ocean and coastal monitoring using Earth Observation data in Australia - Thomas Schroeder
Ähnlich wie C4.06: Towards continental-scale operational ocean and coastal monitoring using Earth Observation data in Australia - Thomas Schroeder (20)
Mehr von Blue Planet Symposium
Mehr von Blue Planet Symposium (20)
Kürzlich hochgeladen
Kürzlich hochgeladen (20)
C4.06: Towards continental-scale operational ocean and coastal monitoring using Earth Observation data in Australia - Thomas Schroeder
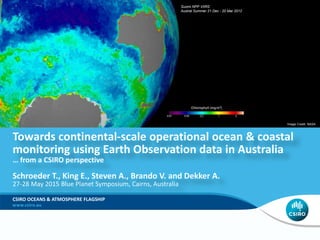
- 1. Towards continental-scale operational ocean & coastal monitoring using Earth Observation data in Australia … from a CSIRO perspective Schroeder T., King E., Steven A., Brando V. and Dekker A. 27-28 May 2015 Blue Planet Symposium, Cairns, Australia CSIRO OCEANS & ATMOSPHERE FLAGSHIP Image Credit: NASA Suomi NPP VIIRS Austral Summer 21 Dec - 20 Mar 2012
- 2. 2009 Australian Strategic Plan for Earth Observation from Space (EOS) report 2013 Australia’s Satellite Utilisation Policy Development National EOS Infrastructure Plan (not released) 2013 Space Coordination Office 2014 National Marine Science Plan Infrastructure White Paper Policy context
- 4. Australia’s marine jurisdiction Prepared by the Oceans Policy Science Advisory Group 2013
- 5. Declining water quality Coastal developments Climate change Fishing Biodiversity threats Bleaching Sea Surface Temperature Cyclones Crown of Thorns Starfish
- 6. Earth Observation (EO) has come a long way Ever increasing data volumes Image Credit: NASA Julius Neubronner German pharmacist - patent 1908 Spy pigeon
- 7. 0.1 2 10 19 0 50 100 150 200 250 RevisitFrequency(days) SpectralBands g S2 MSI Hyspiri HICO SPOT Landsat MERISOLCI MODIS VIIRS GOCI Spatial resolution [m] Spectral bands Revisit frequency [days] Resolution trade-off (spectral, spatial, temporal)
- 8. See also presentations by Cedric Robillot Wed 27th 15:40 Emlyn Jones Thu 28th 09:30 Mark Baird Thu 28th 10:00 http://www.bom.gov.au/marinewaterquality “eReefs will provide unprecedented access to an Integrated system of data, simulation and forecasting models and visual products that can embedded in decision making and improve our understanding of Risks, pressures and responses of the whole Great Barrier Reef system.” The eReefs project
- 9. (Courtesy: Dr Mark Baird & Team) eReefs - Modeling ocean colour (reflectance) Data assimilation Bio-geochemical model Modeled ocean colour Satellite
- 10. Common analytical framework for large volumes of regular gridded scientific data (PetaBytes) Uses National Computational Infrastructure First data set to be transformed into the AGDC is the entire Australasian Landsat archive (1979-present) – L2 surface reflectance Flexible architecture - integration of new sensors Sentinel-2,3 MODIS, MERIS … sensor blending or merging with other data sources e.g. model outputs etc. Some AGDC use cases for coastal monitoring: Bathymetry and habitat mapping e.g. sea grasses, mangroves etc., effect of land-use change on runoff The Australian Geoscience Data Cube (AGDC) Collaboration between GA, CSIRO and the NCI
- 11. See also presentations by: Tim Moltmann Wed 27th 11:30 David Griffin Wed 27th 17:55 Helen Beggs Thu 28th 15:45 http://oceancurrent.imos.org.au Sea Surface Temperature (BoM) AVHRR Ocean Colour (CSIRO) MODIS Sea Surface Height (UTAS) Jason-2, Cryosat-2, SARAL, HY-2A
- 12. IMOS 1 km Product NASA 4 km Product Comparison IMOS and NASA L3 products MODIS standard OC3 chlorophyll-a
- 13. also http://aesop.csiro.au https://imos.aodn.org.au/imos123/home Ground observations IMOS bio-optical data base Support algorithm validation, development and model calibration Provision to NASA (SeaBASS), ESA (Mermaid)
- 14. SeaPRISM (7 wavelengths) Water-leaving radiance Aerosol optical thickness Aerosol absorption Aerosol size distribution Refractive index Single scattering albedo Phasefunction Water vapor Spectral flux Radiative forcing Weather Station Temperature Pressure Humidity Dew point Wind speed etc Satlantic Spectral irradiance Webcams Sky and Sea (A) (A) (B) (B) (B) (C) (C) (D) (D) Above-water measurements
- 15. WetStar fluorometer CDOM absorption Chlorophyll-a Uranine Phycoeryhrin WQM Temperature Salinity Depth Dissolved oxygen Turbidity Back scattering Chlorophyll fluorescence ACs (80 wavelengths) Total absorption Total attenuation ACs switching unit (filtered/unfiltered) BB9 (9 wavelengths) Back-scattering DAPCS Network enabled real-time data logger Automatic winch controller keeps cage at a constant depth In-water optical measurements Fortnightly servicing and water sampling
- 16. Continental-scale EOS needs … Growing investment in national coordination, analysis and dissemination of information from satellites Long-term sustained funding in in-situ observing systems (Cal/Val), computing infra-structure (national archiving and processing) and a network of receiving stations International engagement (GEO, CEOS, …) directly with space agencies to secure ongoing access to data streams, Space Coordination Office Ultimately funding through the NEOS-Infrastructure Plan All this allows us to address some of the national challenges (e.g. Marine Nation 2025) and support National Environmental Accounting (State of the Environment)
- 17. Opportunities Provide products beyond a simple chlorophyll-a map – PFTs, primary productivity, carbon fluxes, particle size, fronts, surrogates, pixel based error estimates etc. – engage with user community on needs. New satellite sensors that provide higher spectral, spatial and temporal resolution data (see detailed sensor list IOCCG web page) Polar-orbiting – scheduled: Sentinel-3 (OLCI) ESA/EUMETSAT (Europe) 2015 GCOM-C (SGLI) JAXA (Japan) 2016 EnMAP (HSI) DLR (Germany) 2017 … Geo-stationary – in orbit: Himawari-8/9 (AHI) JAXA (Japan), …
- 18. Himawari-8 See also presentation by: Keiji Imaoka Thu 28th 14:30 Successfully launched on 7 Oct 2014 Geostationary orbit 140.7°E JMA plans formal operation mid-2015 as replacement for MTSAT-2 Himawari-8/9 will observe the East Asia and Western Pacific regions for period of 14 years (H8 2015-2022, H9 2022-2029) AHI not an Ocean Colour sensor
- 19. Courtesy: Yasushi Izumikawa Big data Approx. 40 GB per day light set Approx. 188 GB per day full sethttp://www.jma-net.go.jp/mscweb/en/himawari89/index.html
- 20. Himawari-8 See also presentation by: Keiji Imaoka Thu 28th 14:30 Successfully launched on 7 Oct 2014 Geostationary orbit 140.7°E JMA plans formal operation mid-2015 as replacement for MTSAT-2 Himawari-8/9 will observe the East Asia and Western Pacific regions for period of 14 years (H8 2015-2022, H9 2022-2029) AHI not an Ocean Colour sensor Proposed continental-scale non-met applications: Turbid water mapping (flood plumes), floating algae (Trichodesmium) linking into BGCM – improve forecasting Product development in collaboration with Japanese colleagues Data through BoM at National Computing Infra-structure (NCI)
- 21. Advantage of GEO vs LEO observations Enhanced temporal and spatial coverage – full disk swath (Source: IOCCG Report 12, Image ACRI-ST) Constellation of 2 LEO sensors One GEO sensor Example: Percentage of days in December that a pixel can be observed
- 22. 15.06.2011 20.06.2011Tidal resuspension Whitsunday Islands, GBR MERIS
- 23. Thank you – questions? Thomas Schroeder CSIRO Oceans & Atmosphere Flagship Brisbane Australia Thomas.Schroeder@csiro.au Image Credit: JAXA