2017 - Environmental Ordination of Filamentous Bacteria in Activated Sludge
•
3 gefällt mir•680 views

Reference: Zornoza, A., Serrano, S. and Alonso, J.L. (2017) Environmental Ordination of Filamentous Bacteria in Activated Sludge. In: Abstracts of the 7th congress of European microbiologists FEMS 2017, Valencia, Spain, 9-13 July 2017.
Empfohlen

Empfohlen
Weitere ähnliche Inhalte
Was ist angesagt?
Was ist angesagt? (20)
Ähnlich wie 2017 - Environmental Ordination of Filamentous Bacteria in Activated Sludge
Ähnlich wie 2017 - Environmental Ordination of Filamentous Bacteria in Activated Sludge (20)
Mehr von WALEBUBLÉ
Mehr von WALEBUBLÉ (20)
Kürzlich hochgeladen
Kürzlich hochgeladen (20)
2017 - Environmental Ordination of Filamentous Bacteria in Activated Sludge
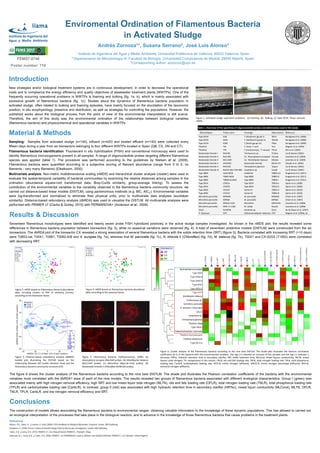
- 1. Enviromental Ordination of Filamentous Bacteria in Activated Sludge Andrés Zornoza1*, Susana Serrano2, José Luis Alonso1 1 Instituto de Ingeniería del Agua y Medio Ambiente, Universitat Politècnica de València, 46022 Valencia, Spain 2 Departamento de Microbiología III. Facultad de Biología. Universidad Complutense de Madrid, 28040 Madrid, Spain *Corresponding author: anzorzor@upv.es Introduction New strategies and/or biological treatment systems are in continuous development, in order to decrease the operational costs and to compliance the energy efficiency and quality objectives of wastewater treatment plants (WWTPs). One of the frequently occurring operational problems in WWTPs is foaming and bulking (fig. 1a, b), which is mainly associated with excessive growth of filamentous bacteria (fig. 1c). Studies about the dynamics of filamentous bacteria population in activated sludge, often related to bulking and foaming episodes, have mainly focused on the elucidation of the taxonomic position, in situ ecophysiology, presence and distribution, as well as strategies for controlling the populations. However, the published works about the biological process from the point of view of the environmental interpretation is still scarce. Therefore, the aim of this study was the environmental ordination of the relationships between biological variables (filamentous bacteria) and physicochemical and operational variables in WWTPs. Material & Methods Sampling: Samples from activated sludge (n=140), influent (n=420) and treated effluent (n=140) were collected every fifteen days during a year from six bioreactors belonging to four different WWTPs located in Spain (QB, CX, DN and CT). Filamentous bacteria identification: Fluorescent in situ hybridization (FISH) and conventional microscopy were used to identity filamentous microorganisms present in all samples. A range of oligonucleotide probes targeting different filamentous species was applied (table 1). The procedure was performed according to the guidelines by Nielsen et al. (2009). Filamentous bacteria were quantified according to a subjective scoring of filament abundance (range from 0 to 5, no filaments - very many filaments) (Eikelboom, 2000). Multivariate analysis: Non-metric multidimensional scaling (nMDS) and hierarchical cluster analysis (cluster) were used to evaluate the spatial-temporal variability of bacterial communities by examining the relative distances among samples in the ordination (abundance square-root transformed data; Bray-Curtis similarity; group-average linking). To assess the contribution of the environmental variables to the variability observed in the filamentous bacteria community structure, we carried out distance-based linear models (DISTLM), using parsimonious methods (e.g. BIC, AICC). Environmental variables were log-transformed and normalized to eliminate their physical units, prior to multivariate data analyses (euclidean similarity). Distance-based redundancy analysis (dbRDA) was used to visualize the DISTLM. All multivariate analyses were performed with PRIMER v7 (Clarke & Gorley, 2015) with PERMANOVA+ (Anderson et al., 2008). Table 1. Overview of the specificity of oligonucleotide probes and abbreviatios used in this study. Morphotypes Probe name Coverage Abbreviation Reference Type 021N G1B T. disciformis (grupo I) Tdisci Kanagawa et al. (2000) Type 021N G2M T. eikelboomii (grupo II) Teikelb Kanagawa et al. (2000) Type 021N G3M T. flexilis (grupo III) Tflexi Kanagawa et al. (2000) Thiothrix TNI T. nivea, T. unzii Tniv Wagner et al. (1994) Thiothrix TFR T. fructosivorans, ‘T. ramosa’ Tfruct Kim et al. (2002) Nostocoida limicola I NlimI91 Trichococcus sp. Trichoc Liu & Seviour (2001) Nostocoida limicola II Noli‐644 Ca. ‘Alysiosphaera europaea’ Aeurop Levantesi et al. (2004) Nostocoida limicola II MC2‐649 Ca. ‘Monilibacter batavus’ Mbatav Levantesi et al. (2004) Nostocoida limicola II AHW183 Nostocoida limicola NlimII‐chl Schade et al. (2002) Nostocoida limicola II Nlim192 Tetrasphaera japonica Tjapon Liu & Seviour (2001) Nostocoida limicola III NlimIII 301+729+830 Isosphaera sp. Isosph Liu & Seviour (2001) Type 0803 Caldi‐0678 Caldilinea T0803‐cal Kragelund et al. (2011) Type 0803 T0803‐0654 Type 0803 T0803‐D Kragelund et al. (2011) Type 0803 T0803ind‐0642 Type 0803 T0803‐I Kragelund et al. (2011) Type 0914 CFX67a Type 0914 T0914‐a Speirs et al. (2009) Type 0914 CFX67b Type 0914 T0914‐b Speirs et al. (2009) Type 0092 CFX197 Variant A T0092‐A Speirs et al. (2010) Type 0092 CFX223 Variant B T0092‐B Speirs et al. (2010) Microthrix parvicella MPA645 M. parvicella MPA645 Erhart et al. (1997) Microthrix parvicella MPA60 M. parvicella MPA60 Erhart et al. (1997) Microthix parvicella MPAall‐1410 Microthrix MPA1410 Levantesi et al. (2006) Microthrix parvicella MPA‐T1‐1260 M. calida Mcalid Levantesi et al. (2006) GALO Gor0596 Gordonia sp. Gord de los Reyes et al. (1997) H. hydrossis HHY Haliscomenobacter hydrossis HHY Wagner et al. (1994a, b) Results & Discussion Seventeen filamentous morphotypes were identified and twenty seven probe FISH hybridized positively in the active sludge samples investigated. As shown in the nMDS plot, the results revealed some differences in filamentous bacteria population between bioreactors (fig. 3), while no seasonal variations were observed (fig. 4). A total of seventeen predictive models (DISTLM) were constructed from the six bioreactors. The dbRDA plot of the bioreactor CX revealed a strong association of several filamentous bacteria with the solids retention time (SRT) (figure 5). Bacteria correlated with increasing SRT (>10 days) were T0803-cal, T0041, T0581, T0092-A/B and A. europea (fig. 7a), whereas that M. parvicella (fig. 7c), N. limicola II (Chloroflexi) (fig. 7d), M. batavus (fig. 7b), T0041 and CX-02/03 (T1852) were correlated with decreasing SRT. Figure 1. Activated sludge separation problems. (a) Foaming. (b) Bulking. (c) Type 021N. Phase contrast, 1000x. Conclusions The construction of models allows associating the filamentous bacteria to environmental ranges, obtaining valuable information to the knowledge of these dynamic populations. This has allowed to carried out an ecological interpretation of the processes that take place in the biological reactors, and to advance in the knowledge of those filamentous bacteria that cause problems in the treatment plants. Figure 3. nMDS based on filamentous bacteria abundance data, including clusters at 70% of similarity (circles), according to the bioreactor factor. Figure 4. nMDS based on filamentous bacteria abundance data, according to the seasonal factor. The figure 6 shows the cluster analysis of the filamentous bacteria according to the nine best DISTLM. The shade plot illustrates the Pearson correlation coefficients of the bacteria with the environmental variables most correlated with the dbRDA1 axes of each of the nine models. The results revealed two groups of filamentous bacteria associated with different ecological characteristics. Group I (green) was associated mainly with high nitrogen removal efficiency, high SRT and low mixed liquor total nitrogen (MLTN), oils and fats loading rate (OFLR), total nitrogen loading rate (TNLR), total phosphorus loading rate (TPLR) and carbohydrates loading rate (CarbLR). In contrast, group II (red) was associated with high hydraulic retention time in secondary clarifier (HRTsc), mixed liquor conductivity (MLCond), MLTN, OFLR, TNLR, TPLR, CarbLR, and low nitrogen removal efficiency and SRT. References Nielsen, P.H., Daims, H., y Lemmer, H. (eds) (2009b) FISH Handbook for Biological Wastewater Treatment. London: IWA Publishing. Eikelboom, D. (2000) Process Control of Activated Sludge Plant by Microscopic Investigations. London: IWA Publishing. Clarke, K.R, y Gorley, R.N. (2015) PRIMER v7: User Manual/Tutorial. PRIMER-E, Plymouth, 296pp. Anderson, M.J., Gorley R.N., y Clarke, K.R. (2008) PRIMER + for PERMANOVA: Guide to Software and Statistical Methods. PRIMER-E. Ltd, Plymouth. United Kingdom. Figure 6. Cluster analysis of the filamentous bacteria according to the nine best DISTLM. The shade plot illustrates the Pearson correlation coefficients (0‐1) of the bacteria with the environmental variables. The sign (+) indicates an increase of the variable and the sign (‐) indicates a decrease. HRTsc, hidraulic retention time in secundary clarifier; SRT, solids retention time; MLCond, mixed liquour conductivity; MLTN, mixed liquour total nitrogen; Tªr, temperature in the reactor; OFLR, oils and fats loading rate; TNLR, total nitrogen loading rate; TPLR, total phosphorus loading rate; CarbLR, carbohydrates loading rate; NO2‐N, nitrite nitrogen (effluent); %NO2‐N, nitrite nitrogen percentaje (effluent); NH4‐N, ammonia nitrogen (effluent). Figure 5. Distance‐based redundancy analysis (dbRDA) bubble plot illustrating the DISTLM based on the relationship between SRT (solids retention time) and the filamentous bacteria community structure (CX). Figure 7. Filamentous bacteria. Epifluorescence, 1000x. (a) Alysiosphera europea (Noli‐644 probe). (b) Monilibacter batavus (MC2‐649 probe). (c) Microthrix (Mpa‐all‐1410 probe). (d) Nostocoida limicola II‐Chloroflexi (AHW183 probe). a b c d a b c FEMS7-0746 Poster number: 710