SlideShare ist ein Scribd-Unternehmen logo
1 von 20
Image Source: http://www.blogspot.com
0 - 3 2
4 - 7 3
8 – 11 8
12 - 15 3
16 - 19 2
Number of
Cappuccinos
Freq
Image Source: http://www.espressospot.com
0 - 3 2
4 - 7 3
8 – 11 8
12 - 15 3
16 - 19 2
Number of
Cappuccinos
Freq
Image Source: http://www.wordpress.com
A survey was conducted at a Cafe which sells food and coffees.
The Barista suggested that they get a bigger machine to cope with
high demand. A bigger machine is very expensive to buy, and so the
owner had a two day survey done to find out how many Cappuccinos
were being made per hour in the Cafe.
From the survey results, they would be able to do some Statistics,
and better understand the current problem situation.
The following is a Histogram of the Number of Coffees made
for each hour that the coffee shop was open over two days.
We want to find the Average Number of Coffees per hour.
Image Source: http://www.blogspot.com
0 - 3 2
4 - 7 3
8 – 11 8
12 - 15 3
16 - 19 2
Number of
Cappuccinos
Freq
0–3
8
6
4
2
0
Number of Cappuccinos Made Per Hour
The “Modal Class” is the group which occurs the most times.
It is the biggest frequency group and forms tallest column.
Image Source: http://www.blogspot.com
0 - 3 2
4 - 7 3
8 – 11 8
12 - 15 3
16 - 19 2
Number of
Cappuccinos
Freq
0–3
8
6
4
2
0
Number of Cappuccinos Made Per Hour
The “Modal Class” is the group 8 to 11 Cappuccinos.
There can be several groups in the “Modal Class” if we have
the biggest frequency value occur multiple times.
Image Source: http://metrio.com.au
0 - 3 2
4 - 7 3
8 – 11 3
12 - 15 3
16 - 19 2
Number of
Café Lattes
Freq
0–3
8
6
4
2
0
Number of Café Lattes Made Per Hour
“Modal Class” is 4-7, 8-11, and 12-15 Café Lattes.
The Median is halfway through our Groups of Interval Data.
Cappuccinos f
0-3 2
4-7 3
8-11 8
12-15 3
16-19 2
TOTAL 18
We find the Median by
finding our Half-Way
Position within the
Frequencies, which is
NOT 18 / 2 = 9 
1,2,3,4,5,6,7,8,9, 10,11,12,13,14,15,16,17,18
The middle of our Frequencies is at the 9.5th value.
9.5
The Median is halfway through our Groups of Interval Data.
Cappuccinos f
0-3 2
4-7 3
8-11 8
12-15 3
16-19 2
TOTAL 18
We can find our Half-Way
Position using the formula:
(Total Frequency + 1) / 2
= (18 + 1) / 2 = 9.5
1,2,3,4,5,6,7,8,9, 10,11,12,13,14,15,16,17,18
The middle of our Frequencies is at the 9.5th value.
9.5
To find the Median, we also need to do Cumulative Addition.
Cappuccinos f Cumulative f
0-3 2
4-7 3
8-11 8
12-15 3
16-19 2
TOTAL 18
We add a new column
where we do continual
Totalling of the “f”
Frequency values.
We add on an extra column, and add the frequencies.
But first we need to learn how to do Cumulative Addition.
Our friend Glen is busking and getting money for each song.
Song $ Cumulative $
Let It Be 15 15
Get Back 4 15 + 4 19
Lady
Madonna
10 15 + 4 + 10 29
Imagine 20 15+4+10+20 49
TOTAL 49
After he has finished each song, we can see how
many total dollars he has. The last values must be
identical (eg. both 49), or else we have made an error.
A quicker way to add up is using the “Zig Zag” pattern.
Song $ Cumulative $
Let It Be 15 15
Get Back 4 19
Lady
Madonna
10 29
Imagine 20 49
TOTAL 49
After he has finished each song, we can see how
many $ he has earned so far. The last values must be
identical (eg. both 49), or else we have made an error.
+
+
+
1st step is add the extra column, and do Cumulative Addition.
Cappuccinos f Cumulative f
0-3 2 2
4-7 3 5
8-11 8 13
12-15 3 16
16-19 2 18
TOTAL 18
We add a new column
where we do continual
Totalling of the “f”
Frequency values.
(Use Zig Zag Pattern)
The other step is to find the half-way frequency using
( Total f + 1 ) / 2 = (18 + 1 ) / 2 = 9.5th position.
Half-Way through the Frequency is (18 + 1) /2 = 9.5
Cappuccinos f Cumulative f
0-3 2 2
4-7 3 5
8-11 8 13
12-15 3 16
16-19 2 18
TOTAL 18
The 9.5th position
occurs during
the 8-11 Interval.
In this Interval
we pass through
9.5 on the way
to reaching 13.
The Median Class is 8-11
We find the Average Number of Coffees per Hour by adding
two new columns to our Frequency Table and using a Formula.
Cappuccinos Freq Interval Midpoint Freq x Midpt
0-3 2
4-7 3
8-11 8
12-15 3
16-19 2
TOTALS 18
We find all of our Interval Midpoints first, and then we
Multiply each Frequency x Midpoint value as our second step
We find the Average Number of Coffees per Hour by adding
two new columns to our Frequency Table and using a Formula.
Cappuccinos Freq Interval Midpoint
0-3 2 0,1, 2,3 -> 1.5
4-7 3 4,5, 6,7 -> 5.5
8-11 8 8,9, 10,11 -> 9.5
12-15 3 12,13, 14,15 13.5
16-19 2 16,17, 18,19 17.5
TOTALS 18
We find Interval Midpoints by getting the exact middle
(or Median) of each of our data classes, or data groups.
Eg. Exactly half way between 0 to 3 is the value of 1.5
We can also find the Midpoints by adding the Lower end
to the Upper end of an Interval, and then dividing by 2.
Cappuccinos Freq Interval Midpoint
0-3 2 (0 + 3) /2 -> 1.5
4-7 3 (4 + 7) /2 -> 5.5
8-11 8 (8+11) /2 -> 9.5
12-15 3 (12+15) /2 -> 13.5
16-19 2 (16+19) /2 -> 17.5
TOTALS 18
We find Interval Midpoints by getting the exact middle
(or Median) of each of our data classes, or data groups.
Eg. Exactly half way between 0 to 3 is the value of 1.5
We complete the final column by Multiplying the Frequency
by the Midpoint Value for each row of our class groups.
Cappuccinos Freq Interval Midpoint Freq x Midpt
0-3 2 0,1,2,3 -> 1.5 2 x 1.5 = 3
4-7 3 4,5,6,7 -> 5.5 3 x 5.5 = 16.5
8-11 8 8,9,10,11 -> 9.5 8 x 9.5 = 76
12-15 3 12,13,14,15 13.5 3 x 13.5 = 40.5
16-19 2 16,17,18,19 17.5 2 x 17.5 = 35
TOTALS 18 171
The 3rd and final step is to use the Grouped Mean Formula:
MEAN Average = Total of (Freq x Midpt) / Total Frequency
We find the Average Number of Coffees per Hour by adding
two new columns to our Frequency Table and using a Formula.
Cappuccinos Freq Interval Midpoint Freq x Midpt
0-3 2 1.5 2 x 1.5 = 3
4-7 3 5.5 3 x 5.5 = 16.5
8-11 8 9.5 8 x 9.5 = 76
12-15 3 13.5 3 x 13.5 = 40.5
16-19 2 17.5 2 x 17.5 = 35
TOTALS 18 171
MEAN Average = Total of (Freq x Midpt) / Total Frequency
= 171 / 18 = 10 cappuccinos per hour
We use some specific Mathematical Notation as follows:
Groups like 0-3 are called “Intervals” eg. 0 up to 3 = 0,1,2,3
f = frequency, or how many we have of a particular interval
x = midpoint, which is (Low + High) /2 for each interval
is the sum of the frequencies (eg. Total Frequency)
is the Total of all the Frequency x Midpoint values
MEAN Average for Grouped Data =
f
fx
f
fx
Using Standard Statistics Notation, we obtain the following:
Cappuccinos f x f x
0-3 2 1.5 2 x 1.5 = 3
4-7 3 5.5 3 x 5.5 = 16.5
8-11 8 9.5 8 x 9.5 = 76
12-15 3 13.5 3 x 13.5 = 40.5
16-19 2 17.5 2 x 17.5 = 35
TOTALS = 18 = 171
MEAN = = 171 / 18 = 10 cappuccinos per hour
f fx
f
fx
http://passyworldofmathematics.wordpress.com/
Visit our site for Free Mathematics PowerPoints

Weitere ähnliche Inhalte

Was ist angesagt?

PROBABILITY OF MUTUALLY EXCLUSIVE EVENTS final.pptx
PROBABILITY OF MUTUALLY EXCLUSIVE EVENTS final.pptxPROBABILITY OF MUTUALLY EXCLUSIVE EVENTS final.pptx
PROBABILITY OF MUTUALLY EXCLUSIVE EVENTS final.pptx
ReinabelleMarfilMarq
 
5.1 sequences and summation notation
5.1 sequences and summation notation5.1 sequences and summation notation
5.1 sequences and summation notation
math260
 
Standard Deviation and Variance
Standard Deviation and VarianceStandard Deviation and Variance
Standard Deviation and Variance
Jufil Hombria
 
Mean, median, mode, & range ppt
Mean, median, mode, & range pptMean, median, mode, & range ppt
Mean, median, mode, & range ppt
mashal2013
 
Chapter 2: Frequency Distribution and Graphs
Chapter 2: Frequency Distribution and GraphsChapter 2: Frequency Distribution and Graphs
Chapter 2: Frequency Distribution and Graphs
Mong Mara
 

Was ist angesagt? (20)

PROBABILITY OF MUTUALLY EXCLUSIVE EVENTS final.pptx
PROBABILITY OF MUTUALLY EXCLUSIVE EVENTS final.pptxPROBABILITY OF MUTUALLY EXCLUSIVE EVENTS final.pptx
PROBABILITY OF MUTUALLY EXCLUSIVE EVENTS final.pptx
 
Organizing and presenting data
Organizing and presenting dataOrganizing and presenting data
Organizing and presenting data
 
Measures of relative position
Measures of relative positionMeasures of relative position
Measures of relative position
 
Determining measures of central tendency for grouped data
Determining measures of central tendency for grouped dataDetermining measures of central tendency for grouped data
Determining measures of central tendency for grouped data
 
Chapter 1 random variables and probability distributions
Chapter 1   random variables and probability distributionsChapter 1   random variables and probability distributions
Chapter 1 random variables and probability distributions
 
5.1 sequences and summation notation
5.1 sequences and summation notation5.1 sequences and summation notation
5.1 sequences and summation notation
 
random variable and distribution
random variable and distributionrandom variable and distribution
random variable and distribution
 
Quartile in Statistics
Quartile in StatisticsQuartile in Statistics
Quartile in Statistics
 
Quartile
QuartileQuartile
Quartile
 
Mode of Grouped Data - Math 7 (4th Quarter)
Mode of Grouped Data - Math 7 (4th Quarter)Mode of Grouped Data - Math 7 (4th Quarter)
Mode of Grouped Data - Math 7 (4th Quarter)
 
Stem and-leaf-diagram-ppt.-dfs
Stem and-leaf-diagram-ppt.-dfsStem and-leaf-diagram-ppt.-dfs
Stem and-leaf-diagram-ppt.-dfs
 
Chapter 3: Prsentation of Data
Chapter 3: Prsentation of DataChapter 3: Prsentation of Data
Chapter 3: Prsentation of Data
 
Standard Deviation and Variance
Standard Deviation and VarianceStandard Deviation and Variance
Standard Deviation and Variance
 
T distribution
T distributionT distribution
T distribution
 
Mean, median, mode, & range ppt
Mean, median, mode, & range pptMean, median, mode, & range ppt
Mean, median, mode, & range ppt
 
Measures of position. gouped data
Measures of position. gouped dataMeasures of position. gouped data
Measures of position. gouped data
 
Bivariate data
Bivariate dataBivariate data
Bivariate data
 
Chapter 2: Frequency Distribution and Graphs
Chapter 2: Frequency Distribution and GraphsChapter 2: Frequency Distribution and Graphs
Chapter 2: Frequency Distribution and Graphs
 
Harmonic sequence
Harmonic sequenceHarmonic sequence
Harmonic sequence
 
Random variable
Random variableRandom variable
Random variable
 

Mehr von Passy World

Congruent Triangles
Congruent TrianglesCongruent Triangles
Congruent Triangles
Passy World
 
Factorising Common Factors
Factorising Common FactorsFactorising Common Factors
Factorising Common Factors
Passy World
 
Expanding Binomial Brackets
Expanding Binomial BracketsExpanding Binomial Brackets
Expanding Binomial Brackets
Passy World
 
Significant Figures
Significant FiguresSignificant Figures
Significant Figures
Passy World
 

Mehr von Passy World (20)

Why Exponents are Important
Why Exponents are ImportantWhy Exponents are Important
Why Exponents are Important
 
Exponents Rules
Exponents RulesExponents Rules
Exponents Rules
 
Equations with Fractions on Both Sides
Equations with Fractions on Both SidesEquations with Fractions on Both Sides
Equations with Fractions on Both Sides
 
Equations with Variables on Both Sides
Equations with Variables on Both SidesEquations with Variables on Both Sides
Equations with Variables on Both Sides
 
Gradient of Straight Lines
Gradient of Straight LinesGradient of Straight Lines
Gradient of Straight Lines
 
Midpoint Between Two Points
Midpoint Between Two PointsMidpoint Between Two Points
Midpoint Between Two Points
 
Linear Rules
Linear RulesLinear Rules
Linear Rules
 
Back to Back S&L Plots
Back to Back S&L PlotsBack to Back S&L Plots
Back to Back S&L Plots
 
Symmetry and Skew
Symmetry and Skew Symmetry and Skew
Symmetry and Skew
 
The Tangent Ratio
The Tangent RatioThe Tangent Ratio
The Tangent Ratio
 
The Cosine Ratio
The Cosine RatioThe Cosine Ratio
The Cosine Ratio
 
The Sine Ratio
The Sine RatioThe Sine Ratio
The Sine Ratio
 
Labeling Trigonometry Triangles
Labeling Trigonometry TrianglesLabeling Trigonometry Triangles
Labeling Trigonometry Triangles
 
Similar Triangles II
Similar Triangles IISimilar Triangles II
Similar Triangles II
 
Similar Triangles
Similar TrianglesSimilar Triangles
Similar Triangles
 
Congruent Triangles
Congruent TrianglesCongruent Triangles
Congruent Triangles
 
Factorising Common Factors
Factorising Common FactorsFactorising Common Factors
Factorising Common Factors
 
Expanding Binomial Brackets
Expanding Binomial BracketsExpanding Binomial Brackets
Expanding Binomial Brackets
 
Rearranging Formulas
Rearranging FormulasRearranging Formulas
Rearranging Formulas
 
Significant Figures
Significant FiguresSignificant Figures
Significant Figures
 

Kürzlich hochgeladen

Seal of Good Local Governance (SGLG) 2024Final.pptx
Seal of Good Local Governance (SGLG) 2024Final.pptxSeal of Good Local Governance (SGLG) 2024Final.pptx
Seal of Good Local Governance (SGLG) 2024Final.pptx
negromaestrong
 
The basics of sentences session 2pptx copy.pptx
The basics of sentences session 2pptx copy.pptxThe basics of sentences session 2pptx copy.pptx
The basics of sentences session 2pptx copy.pptx
heathfieldcps1
 
Beyond the EU: DORA and NIS 2 Directive's Global Impact
Beyond the EU: DORA and NIS 2 Directive's Global ImpactBeyond the EU: DORA and NIS 2 Directive's Global Impact
Beyond the EU: DORA and NIS 2 Directive's Global Impact
PECB
 

Kürzlich hochgeladen (20)

Mehran University Newsletter Vol-X, Issue-I, 2024
Mehran University Newsletter Vol-X, Issue-I, 2024Mehran University Newsletter Vol-X, Issue-I, 2024
Mehran University Newsletter Vol-X, Issue-I, 2024
 
PROCESS RECORDING FORMAT.docx
PROCESS      RECORDING        FORMAT.docxPROCESS      RECORDING        FORMAT.docx
PROCESS RECORDING FORMAT.docx
 
Class 11th Physics NEET formula sheet pdf
Class 11th Physics NEET formula sheet pdfClass 11th Physics NEET formula sheet pdf
Class 11th Physics NEET formula sheet pdf
 
Role Of Transgenic Animal In Target Validation-1.pptx
Role Of Transgenic Animal In Target Validation-1.pptxRole Of Transgenic Animal In Target Validation-1.pptx
Role Of Transgenic Animal In Target Validation-1.pptx
 
General Principles of Intellectual Property: Concepts of Intellectual Proper...
General Principles of Intellectual Property: Concepts of Intellectual  Proper...General Principles of Intellectual Property: Concepts of Intellectual  Proper...
General Principles of Intellectual Property: Concepts of Intellectual Proper...
 
Seal of Good Local Governance (SGLG) 2024Final.pptx
Seal of Good Local Governance (SGLG) 2024Final.pptxSeal of Good Local Governance (SGLG) 2024Final.pptx
Seal of Good Local Governance (SGLG) 2024Final.pptx
 
Introduction to Nonprofit Accounting: The Basics
Introduction to Nonprofit Accounting: The BasicsIntroduction to Nonprofit Accounting: The Basics
Introduction to Nonprofit Accounting: The Basics
 
2024-NATIONAL-LEARNING-CAMP-AND-OTHER.pptx
2024-NATIONAL-LEARNING-CAMP-AND-OTHER.pptx2024-NATIONAL-LEARNING-CAMP-AND-OTHER.pptx
2024-NATIONAL-LEARNING-CAMP-AND-OTHER.pptx
 
Basic Civil Engineering first year Notes- Chapter 4 Building.pptx
Basic Civil Engineering first year Notes- Chapter 4 Building.pptxBasic Civil Engineering first year Notes- Chapter 4 Building.pptx
Basic Civil Engineering first year Notes- Chapter 4 Building.pptx
 
Z Score,T Score, Percential Rank and Box Plot Graph
Z Score,T Score, Percential Rank and Box Plot GraphZ Score,T Score, Percential Rank and Box Plot Graph
Z Score,T Score, Percential Rank and Box Plot Graph
 
The basics of sentences session 2pptx copy.pptx
The basics of sentences session 2pptx copy.pptxThe basics of sentences session 2pptx copy.pptx
The basics of sentences session 2pptx copy.pptx
 
Advanced Views - Calendar View in Odoo 17
Advanced Views - Calendar View in Odoo 17Advanced Views - Calendar View in Odoo 17
Advanced Views - Calendar View in Odoo 17
 
TỔNG ÔN TẬP THI VÀO LỚP 10 MÔN TIẾNG ANH NĂM HỌC 2023 - 2024 CÓ ĐÁP ÁN (NGỮ Â...
TỔNG ÔN TẬP THI VÀO LỚP 10 MÔN TIẾNG ANH NĂM HỌC 2023 - 2024 CÓ ĐÁP ÁN (NGỮ Â...TỔNG ÔN TẬP THI VÀO LỚP 10 MÔN TIẾNG ANH NĂM HỌC 2023 - 2024 CÓ ĐÁP ÁN (NGỮ Â...
TỔNG ÔN TẬP THI VÀO LỚP 10 MÔN TIẾNG ANH NĂM HỌC 2023 - 2024 CÓ ĐÁP ÁN (NGỮ Â...
 
Food Chain and Food Web (Ecosystem) EVS, B. Pharmacy 1st Year, Sem-II
Food Chain and Food Web (Ecosystem) EVS, B. Pharmacy 1st Year, Sem-IIFood Chain and Food Web (Ecosystem) EVS, B. Pharmacy 1st Year, Sem-II
Food Chain and Food Web (Ecosystem) EVS, B. Pharmacy 1st Year, Sem-II
 
Beyond the EU: DORA and NIS 2 Directive's Global Impact
Beyond the EU: DORA and NIS 2 Directive's Global ImpactBeyond the EU: DORA and NIS 2 Directive's Global Impact
Beyond the EU: DORA and NIS 2 Directive's Global Impact
 
ComPTIA Overview | Comptia Security+ Book SY0-701
ComPTIA Overview | Comptia Security+ Book SY0-701ComPTIA Overview | Comptia Security+ Book SY0-701
ComPTIA Overview | Comptia Security+ Book SY0-701
 
Holdier Curriculum Vitae (April 2024).pdf
Holdier Curriculum Vitae (April 2024).pdfHoldier Curriculum Vitae (April 2024).pdf
Holdier Curriculum Vitae (April 2024).pdf
 
Ecological Succession. ( ECOSYSTEM, B. Pharmacy, 1st Year, Sem-II, Environmen...
Ecological Succession. ( ECOSYSTEM, B. Pharmacy, 1st Year, Sem-II, Environmen...Ecological Succession. ( ECOSYSTEM, B. Pharmacy, 1st Year, Sem-II, Environmen...
Ecological Succession. ( ECOSYSTEM, B. Pharmacy, 1st Year, Sem-II, Environmen...
 
Sociology 101 Demonstration of Learning Exhibit
Sociology 101 Demonstration of Learning ExhibitSociology 101 Demonstration of Learning Exhibit
Sociology 101 Demonstration of Learning Exhibit
 
How to Give a Domain for a Field in Odoo 17
How to Give a Domain for a Field in Odoo 17How to Give a Domain for a Field in Odoo 17
How to Give a Domain for a Field in Odoo 17
 

Grouped Mean Median Mode

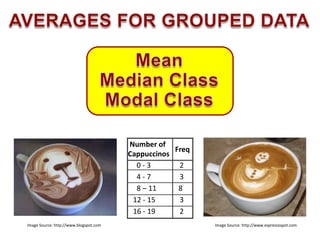
  • 1. Image Source: http://www.blogspot.com 0 - 3 2 4 - 7 3 8 – 11 8 12 - 15 3 16 - 19 2 Number of Cappuccinos Freq Image Source: http://www.espressospot.com
  • 2. 0 - 3 2 4 - 7 3 8 – 11 8 12 - 15 3 16 - 19 2 Number of Cappuccinos Freq Image Source: http://www.wordpress.com A survey was conducted at a Cafe which sells food and coffees. The Barista suggested that they get a bigger machine to cope with high demand. A bigger machine is very expensive to buy, and so the owner had a two day survey done to find out how many Cappuccinos were being made per hour in the Cafe. From the survey results, they would be able to do some Statistics, and better understand the current problem situation.
  • 3. The following is a Histogram of the Number of Coffees made for each hour that the coffee shop was open over two days. We want to find the Average Number of Coffees per hour. Image Source: http://www.blogspot.com 0 - 3 2 4 - 7 3 8 – 11 8 12 - 15 3 16 - 19 2 Number of Cappuccinos Freq 0–3 8 6 4 2 0 Number of Cappuccinos Made Per Hour
  • 4. The “Modal Class” is the group which occurs the most times. It is the biggest frequency group and forms tallest column. Image Source: http://www.blogspot.com 0 - 3 2 4 - 7 3 8 – 11 8 12 - 15 3 16 - 19 2 Number of Cappuccinos Freq 0–3 8 6 4 2 0 Number of Cappuccinos Made Per Hour The “Modal Class” is the group 8 to 11 Cappuccinos.
  • 5. There can be several groups in the “Modal Class” if we have the biggest frequency value occur multiple times. Image Source: http://metrio.com.au 0 - 3 2 4 - 7 3 8 – 11 3 12 - 15 3 16 - 19 2 Number of Café Lattes Freq 0–3 8 6 4 2 0 Number of Café Lattes Made Per Hour “Modal Class” is 4-7, 8-11, and 12-15 Café Lattes.
  • 6. The Median is halfway through our Groups of Interval Data. Cappuccinos f 0-3 2 4-7 3 8-11 8 12-15 3 16-19 2 TOTAL 18 We find the Median by finding our Half-Way Position within the Frequencies, which is NOT 18 / 2 = 9  1,2,3,4,5,6,7,8,9, 10,11,12,13,14,15,16,17,18 The middle of our Frequencies is at the 9.5th value. 9.5
  • 7. The Median is halfway through our Groups of Interval Data. Cappuccinos f 0-3 2 4-7 3 8-11 8 12-15 3 16-19 2 TOTAL 18 We can find our Half-Way Position using the formula: (Total Frequency + 1) / 2 = (18 + 1) / 2 = 9.5 1,2,3,4,5,6,7,8,9, 10,11,12,13,14,15,16,17,18 The middle of our Frequencies is at the 9.5th value. 9.5
  • 8. To find the Median, we also need to do Cumulative Addition. Cappuccinos f Cumulative f 0-3 2 4-7 3 8-11 8 12-15 3 16-19 2 TOTAL 18 We add a new column where we do continual Totalling of the “f” Frequency values. We add on an extra column, and add the frequencies. But first we need to learn how to do Cumulative Addition.
  • 9. Our friend Glen is busking and getting money for each song. Song $ Cumulative $ Let It Be 15 15 Get Back 4 15 + 4 19 Lady Madonna 10 15 + 4 + 10 29 Imagine 20 15+4+10+20 49 TOTAL 49 After he has finished each song, we can see how many total dollars he has. The last values must be identical (eg. both 49), or else we have made an error.
  • 10. A quicker way to add up is using the “Zig Zag” pattern. Song $ Cumulative $ Let It Be 15 15 Get Back 4 19 Lady Madonna 10 29 Imagine 20 49 TOTAL 49 After he has finished each song, we can see how many $ he has earned so far. The last values must be identical (eg. both 49), or else we have made an error. + + +
  • 11. 1st step is add the extra column, and do Cumulative Addition. Cappuccinos f Cumulative f 0-3 2 2 4-7 3 5 8-11 8 13 12-15 3 16 16-19 2 18 TOTAL 18 We add a new column where we do continual Totalling of the “f” Frequency values. (Use Zig Zag Pattern) The other step is to find the half-way frequency using ( Total f + 1 ) / 2 = (18 + 1 ) / 2 = 9.5th position.
  • 12. Half-Way through the Frequency is (18 + 1) /2 = 9.5 Cappuccinos f Cumulative f 0-3 2 2 4-7 3 5 8-11 8 13 12-15 3 16 16-19 2 18 TOTAL 18 The 9.5th position occurs during the 8-11 Interval. In this Interval we pass through 9.5 on the way to reaching 13. The Median Class is 8-11
  • 13. We find the Average Number of Coffees per Hour by adding two new columns to our Frequency Table and using a Formula. Cappuccinos Freq Interval Midpoint Freq x Midpt 0-3 2 4-7 3 8-11 8 12-15 3 16-19 2 TOTALS 18 We find all of our Interval Midpoints first, and then we Multiply each Frequency x Midpoint value as our second step
  • 14. We find the Average Number of Coffees per Hour by adding two new columns to our Frequency Table and using a Formula. Cappuccinos Freq Interval Midpoint 0-3 2 0,1, 2,3 -> 1.5 4-7 3 4,5, 6,7 -> 5.5 8-11 8 8,9, 10,11 -> 9.5 12-15 3 12,13, 14,15 13.5 16-19 2 16,17, 18,19 17.5 TOTALS 18 We find Interval Midpoints by getting the exact middle (or Median) of each of our data classes, or data groups. Eg. Exactly half way between 0 to 3 is the value of 1.5
  • 15. We can also find the Midpoints by adding the Lower end to the Upper end of an Interval, and then dividing by 2. Cappuccinos Freq Interval Midpoint 0-3 2 (0 + 3) /2 -> 1.5 4-7 3 (4 + 7) /2 -> 5.5 8-11 8 (8+11) /2 -> 9.5 12-15 3 (12+15) /2 -> 13.5 16-19 2 (16+19) /2 -> 17.5 TOTALS 18 We find Interval Midpoints by getting the exact middle (or Median) of each of our data classes, or data groups. Eg. Exactly half way between 0 to 3 is the value of 1.5
  • 16. We complete the final column by Multiplying the Frequency by the Midpoint Value for each row of our class groups. Cappuccinos Freq Interval Midpoint Freq x Midpt 0-3 2 0,1,2,3 -> 1.5 2 x 1.5 = 3 4-7 3 4,5,6,7 -> 5.5 3 x 5.5 = 16.5 8-11 8 8,9,10,11 -> 9.5 8 x 9.5 = 76 12-15 3 12,13,14,15 13.5 3 x 13.5 = 40.5 16-19 2 16,17,18,19 17.5 2 x 17.5 = 35 TOTALS 18 171 The 3rd and final step is to use the Grouped Mean Formula: MEAN Average = Total of (Freq x Midpt) / Total Frequency
  • 17. We find the Average Number of Coffees per Hour by adding two new columns to our Frequency Table and using a Formula. Cappuccinos Freq Interval Midpoint Freq x Midpt 0-3 2 1.5 2 x 1.5 = 3 4-7 3 5.5 3 x 5.5 = 16.5 8-11 8 9.5 8 x 9.5 = 76 12-15 3 13.5 3 x 13.5 = 40.5 16-19 2 17.5 2 x 17.5 = 35 TOTALS 18 171 MEAN Average = Total of (Freq x Midpt) / Total Frequency = 171 / 18 = 10 cappuccinos per hour
  • 18. We use some specific Mathematical Notation as follows: Groups like 0-3 are called “Intervals” eg. 0 up to 3 = 0,1,2,3 f = frequency, or how many we have of a particular interval x = midpoint, which is (Low + High) /2 for each interval is the sum of the frequencies (eg. Total Frequency) is the Total of all the Frequency x Midpoint values MEAN Average for Grouped Data = f fx f fx
  • 19. Using Standard Statistics Notation, we obtain the following: Cappuccinos f x f x 0-3 2 1.5 2 x 1.5 = 3 4-7 3 5.5 3 x 5.5 = 16.5 8-11 8 9.5 8 x 9.5 = 76 12-15 3 13.5 3 x 13.5 = 40.5 16-19 2 17.5 2 x 17.5 = 35 TOTALS = 18 = 171 MEAN = = 171 / 18 = 10 cappuccinos per hour f fx f fx