SlideShare ist ein Scribd-Unternehmen logo
1 von 6
Downloaden Sie, um offline zu lesen
JMeter proxy Step-by-step
This short tutorial attempts to explain the exact steps for JMeter's proxy. For those new to
Jmeter, one easy way to create a test plan is to use the Proxy. What the proxy does is it
records the requests sent to the server. Jmeter's proxy currently does not support recording
HTTPS. Since HTTPS is secure, the proxy is unable to decrypt the traffic and record the
request parameters or cookies. There are several ways to get around this limitation. The
easiest method is to use Badboy http://www.badboy.com.au/. The second option is to
record in HTTP and then change the test plan to use HTTP request defaults.

Basic Proxy Instructions
1. start jmeter with jmeter.bat on windows and jmeter.sh on unix
2. select “test plan” on the tree
3. right click on the “test plan” and add a new thread group: add -> thread group


4.   select the thread group
5.   right click “add -> config element -> Http Request Defaults”
6.   Protocol – enter “HTTP”
7.   Server name – enter “jakarta.apache.org”
8.   Path – leave blank
9.   Port number – enter “80”
10.select workbench
11.right click on workbench and add the Http proxy: add -> non-test elements -> Http
   Proxy Server
12.Port field - Enter “9090”
13.Target Controller – click on the drop down and select “test plan > thread group”
14.Click the “add” button in “Patterns to include”. This will create a blank entry.
15.Enter “.*.html”
16.Click the “add” button in “Patterns to exclude”. This will create a blank entry.
17.Enter “.*.gif”
18.Click the “start” button at the bottom
19.Start Internet Explorer, but do not close Jmeter.

Note: make sure the include and exclude patterns are correct. Below are some common
patterns for images and types of pages.

       .* - all
       .*.png – png images
       .*.gif – gif images
       .*.jpg – jpeg images
       .*.php
       .*.jsp
       .*.html
       .*.htm
       .*.js

As a general tip, it is a good idea to set the homepage for your browser to a blank page. This
way, it reduces the number of unwanted pages Jmeter records during the session. It is a good
idea to try the proxy with different sites and get comfortable with different filtering patterns.
20.From the tool bar, click “tools -> internet options”. This should bring up the options.
21.Select the “connection” tab
22.Click “lan settings” button near the bottom.
23.On the connections tab, check “Use a proxy server for your LAN”. The address and port
   fields should be enabled now.
24.Address – enter “Localhost” or the IP address of your system
25.Port – enter “9090”.
26.Click “ok” button
27.Click “ok” button again. This should return you to the browser
28.In the “Address” bar at the top, enter “http://jakarta.apache.org/jmeter/index.html” and
   hit the “enter” key.
29.Click on a few links on Jmeter's page.
30.Close internet explorer and bring up the Jmeter window.
Reviewing the Test Plan

Expand the thread group and there should be several samplers. At this point, the test plan
can be saved as is. If you forget to add default http request settings, you will have to
manually delete the servername, and port. In this sample, there aren't any default request
parameters. If a particular request parameter is required by all pages, the request defaults is
where one would add the entries.


1. Select “thread group”
2. Right click “add -> listener -> aggregate report” to add an aggregate listener. The
   aggregate listener will show some basic statistics.
3.   Select “thread group”
4.   Number of threads – enter “5”
5.   Ramp up Period – do not change
6.   Loop count – enter 100


Running the Test
At this point, we are ready to run our test plan and see what happens. Save the test plan.
When you're ready to run the test, there's two ways:

1. Run -> Start
2. CRTL – R

Before you start the test, select “aggregate report”. As the test runs, the statistics will change
until the test is done. At the end of the test, the aggregate report should look like this.


While the test is running, in the upper right-hand corner, there should be a green square.
When the test is done, the box should be grey.

Weitere ähnliche Inhalte

Andere mochten auch (6)

A Distributed Self-management Service
A Distributed Self-management ServiceA Distributed Self-management Service
A Distributed Self-management Service
 
Scalable Dynamic Graph Summarization
Scalable Dynamic Graph SummarizationScalable Dynamic Graph Summarization
Scalable Dynamic Graph Summarization
 
Graphic Drawings Proposal
Graphic Drawings ProposalGraphic Drawings Proposal
Graphic Drawings Proposal
 
New Seo Proposal
New Seo ProposalNew Seo Proposal
New Seo Proposal
 
How to Make Awesome SlideShares: Tips & Tricks
How to Make Awesome SlideShares: Tips & TricksHow to Make Awesome SlideShares: Tips & Tricks
How to Make Awesome SlideShares: Tips & Tricks
 
Getting Started With SlideShare
Getting Started With SlideShareGetting Started With SlideShare
Getting Started With SlideShare
 

Ähnlich wie Use JMeter as a Performance Testing Tool

Software testing
Software testingSoftware testing
Software testing
nil65
 
Performance testing using Jmeter for apps which needs authentication
Performance testing using Jmeter for apps which needs authenticationPerformance testing using Jmeter for apps which needs authentication
Performance testing using Jmeter for apps which needs authentication
Jay Jha
 

Ähnlich wie Use JMeter as a Performance Testing Tool (20)

Utilizando Proxy no Jmeter Passo a Passo
Utilizando Proxy no Jmeter Passo a PassoUtilizando Proxy no Jmeter Passo a Passo
Utilizando Proxy no Jmeter Passo a Passo
 
Jmeter memory profiling, server-side monitoring, memory and cpu monitoring
Jmeter memory profiling, server-side monitoring, memory and cpu monitoringJmeter memory profiling, server-side monitoring, memory and cpu monitoring
Jmeter memory profiling, server-side monitoring, memory and cpu monitoring
 
Automation - Apache JMeter
Automation - Apache JMeterAutomation - Apache JMeter
Automation - Apache JMeter
 
Perfromane Test Tool jmeter
Perfromane Test Tool jmeterPerfromane Test Tool jmeter
Perfromane Test Tool jmeter
 
Jmeter
JmeterJmeter
Jmeter
 
ConnectSMART Tutorials
ConnectSMART TutorialsConnectSMART Tutorials
ConnectSMART Tutorials
 
Presentation on Apache Jmeter
Presentation on Apache JmeterPresentation on Apache Jmeter
Presentation on Apache Jmeter
 
QA. Load Testing
QA. Load TestingQA. Load Testing
QA. Load Testing
 
Neoload overview
Neoload overviewNeoload overview
Neoload overview
 
Day5_Apache_JMeter_Test_Execution_RemoteMode_Master_Slave
Day5_Apache_JMeter_Test_Execution_RemoteMode_Master_SlaveDay5_Apache_JMeter_Test_Execution_RemoteMode_Master_Slave
Day5_Apache_JMeter_Test_Execution_RemoteMode_Master_Slave
 
JMeter JMX Script Creation via BlazeMeter
JMeter JMX Script Creation via BlazeMeterJMeter JMX Script Creation via BlazeMeter
JMeter JMX Script Creation via BlazeMeter
 
Software testing
Software testingSoftware testing
Software testing
 
Basic of jMeter
Basic of jMeter Basic of jMeter
Basic of jMeter
 
Performance testing using Jmeter for apps which needs authentication
Performance testing using Jmeter for apps which needs authenticationPerformance testing using Jmeter for apps which needs authentication
Performance testing using Jmeter for apps which needs authentication
 
Visualize your Twitter network
Visualize your Twitter networkVisualize your Twitter network
Visualize your Twitter network
 
Load testing with J meter
Load testing with J meterLoad testing with J meter
Load testing with J meter
 
Diesel load testing tool
Diesel load testing toolDiesel load testing tool
Diesel load testing tool
 
Module 4: Introduction to ASP.NET 3.5 (Material)
Module 4: Introduction to ASP.NET 3.5 (Material)Module 4: Introduction to ASP.NET 3.5 (Material)
Module 4: Introduction to ASP.NET 3.5 (Material)
 
Learning j meter
Learning j meterLearning j meter
Learning j meter
 
Load testing jmeter
Load testing jmeterLoad testing jmeter
Load testing jmeter
 

Kürzlich hochgeladen

Why Teams call analytics are critical to your entire business
Why Teams call analytics are critical to your entire businessWhy Teams call analytics are critical to your entire business
Why Teams call analytics are critical to your entire business
panagenda
 
Architecting Cloud Native Applications
Architecting Cloud Native ApplicationsArchitecting Cloud Native Applications
Architecting Cloud Native Applications
WSO2
 

Kürzlich hochgeladen (20)

Understanding the FAA Part 107 License ..
Understanding the FAA Part 107 License ..Understanding the FAA Part 107 License ..
Understanding the FAA Part 107 License ..
 
Elevate Developer Efficiency & build GenAI Application with Amazon Q​
Elevate Developer Efficiency & build GenAI Application with Amazon Q​Elevate Developer Efficiency & build GenAI Application with Amazon Q​
Elevate Developer Efficiency & build GenAI Application with Amazon Q​
 
Why Teams call analytics are critical to your entire business
Why Teams call analytics are critical to your entire businessWhy Teams call analytics are critical to your entire business
Why Teams call analytics are critical to your entire business
 
MINDCTI Revenue Release Quarter One 2024
MINDCTI Revenue Release Quarter One 2024MINDCTI Revenue Release Quarter One 2024
MINDCTI Revenue Release Quarter One 2024
 
"I see eyes in my soup": How Delivery Hero implemented the safety system for ...
"I see eyes in my soup": How Delivery Hero implemented the safety system for ..."I see eyes in my soup": How Delivery Hero implemented the safety system for ...
"I see eyes in my soup": How Delivery Hero implemented the safety system for ...
 
Six Myths about Ontologies: The Basics of Formal Ontology
Six Myths about Ontologies: The Basics of Formal OntologySix Myths about Ontologies: The Basics of Formal Ontology
Six Myths about Ontologies: The Basics of Formal Ontology
 
Boost Fertility New Invention Ups Success Rates.pdf
Boost Fertility New Invention Ups Success Rates.pdfBoost Fertility New Invention Ups Success Rates.pdf
Boost Fertility New Invention Ups Success Rates.pdf
 
Architecting Cloud Native Applications
Architecting Cloud Native ApplicationsArchitecting Cloud Native Applications
Architecting Cloud Native Applications
 
Apidays New York 2024 - The value of a flexible API Management solution for O...
Apidays New York 2024 - The value of a flexible API Management solution for O...Apidays New York 2024 - The value of a flexible API Management solution for O...
Apidays New York 2024 - The value of a flexible API Management solution for O...
 
Vector Search -An Introduction in Oracle Database 23ai.pptx
Vector Search -An Introduction in Oracle Database 23ai.pptxVector Search -An Introduction in Oracle Database 23ai.pptx
Vector Search -An Introduction in Oracle Database 23ai.pptx
 
Navigating the Deluge_ Dubai Floods and the Resilience of Dubai International...
Navigating the Deluge_ Dubai Floods and the Resilience of Dubai International...Navigating the Deluge_ Dubai Floods and the Resilience of Dubai International...
Navigating the Deluge_ Dubai Floods and the Resilience of Dubai International...
 
Apidays New York 2024 - Accelerating FinTech Innovation by Vasa Krishnan, Fin...
Apidays New York 2024 - Accelerating FinTech Innovation by Vasa Krishnan, Fin...Apidays New York 2024 - Accelerating FinTech Innovation by Vasa Krishnan, Fin...
Apidays New York 2024 - Accelerating FinTech Innovation by Vasa Krishnan, Fin...
 
CNIC Information System with Pakdata Cf In Pakistan
CNIC Information System with Pakdata Cf In PakistanCNIC Information System with Pakdata Cf In Pakistan
CNIC Information System with Pakdata Cf In Pakistan
 
MS Copilot expands with MS Graph connectors
MS Copilot expands with MS Graph connectorsMS Copilot expands with MS Graph connectors
MS Copilot expands with MS Graph connectors
 
Introduction to Multilingual Retrieval Augmented Generation (RAG)
Introduction to Multilingual Retrieval Augmented Generation (RAG)Introduction to Multilingual Retrieval Augmented Generation (RAG)
Introduction to Multilingual Retrieval Augmented Generation (RAG)
 
WSO2's API Vision: Unifying Control, Empowering Developers
WSO2's API Vision: Unifying Control, Empowering DevelopersWSO2's API Vision: Unifying Control, Empowering Developers
WSO2's API Vision: Unifying Control, Empowering Developers
 
ICT role in 21st century education and its challenges
ICT role in 21st century education and its challengesICT role in 21st century education and its challenges
ICT role in 21st century education and its challenges
 
ProductAnonymous-April2024-WinProductDiscovery-MelissaKlemke
ProductAnonymous-April2024-WinProductDiscovery-MelissaKlemkeProductAnonymous-April2024-WinProductDiscovery-MelissaKlemke
ProductAnonymous-April2024-WinProductDiscovery-MelissaKlemke
 
Apidays New York 2024 - Scaling API-first by Ian Reasor and Radu Cotescu, Adobe
Apidays New York 2024 - Scaling API-first by Ian Reasor and Radu Cotescu, AdobeApidays New York 2024 - Scaling API-first by Ian Reasor and Radu Cotescu, Adobe
Apidays New York 2024 - Scaling API-first by Ian Reasor and Radu Cotescu, Adobe
 
Strategies for Landing an Oracle DBA Job as a Fresher
Strategies for Landing an Oracle DBA Job as a FresherStrategies for Landing an Oracle DBA Job as a Fresher
Strategies for Landing an Oracle DBA Job as a Fresher
 

Use JMeter as a Performance Testing Tool

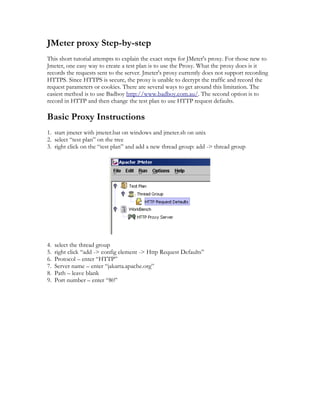
  • 1. JMeter proxy Step-by-step This short tutorial attempts to explain the exact steps for JMeter's proxy. For those new to Jmeter, one easy way to create a test plan is to use the Proxy. What the proxy does is it records the requests sent to the server. Jmeter's proxy currently does not support recording HTTPS. Since HTTPS is secure, the proxy is unable to decrypt the traffic and record the request parameters or cookies. There are several ways to get around this limitation. The easiest method is to use Badboy http://www.badboy.com.au/. The second option is to record in HTTP and then change the test plan to use HTTP request defaults. Basic Proxy Instructions 1. start jmeter with jmeter.bat on windows and jmeter.sh on unix 2. select “test plan” on the tree 3. right click on the “test plan” and add a new thread group: add -> thread group 4. select the thread group 5. right click “add -> config element -> Http Request Defaults” 6. Protocol – enter “HTTP” 7. Server name – enter “jakarta.apache.org” 8. Path – leave blank 9. Port number – enter “80”
  • 2. 10.select workbench 11.right click on workbench and add the Http proxy: add -> non-test elements -> Http Proxy Server 12.Port field - Enter “9090” 13.Target Controller – click on the drop down and select “test plan > thread group” 14.Click the “add” button in “Patterns to include”. This will create a blank entry. 15.Enter “.*.html” 16.Click the “add” button in “Patterns to exclude”. This will create a blank entry. 17.Enter “.*.gif” 18.Click the “start” button at the bottom 19.Start Internet Explorer, but do not close Jmeter. Note: make sure the include and exclude patterns are correct. Below are some common patterns for images and types of pages. .* - all .*.png – png images .*.gif – gif images .*.jpg – jpeg images .*.php .*.jsp .*.html .*.htm .*.js As a general tip, it is a good idea to set the homepage for your browser to a blank page. This way, it reduces the number of unwanted pages Jmeter records during the session. It is a good idea to try the proxy with different sites and get comfortable with different filtering patterns.
  • 3. 20.From the tool bar, click “tools -> internet options”. This should bring up the options. 21.Select the “connection” tab 22.Click “lan settings” button near the bottom. 23.On the connections tab, check “Use a proxy server for your LAN”. The address and port fields should be enabled now. 24.Address – enter “Localhost” or the IP address of your system 25.Port – enter “9090”. 26.Click “ok” button 27.Click “ok” button again. This should return you to the browser 28.In the “Address” bar at the top, enter “http://jakarta.apache.org/jmeter/index.html” and hit the “enter” key. 29.Click on a few links on Jmeter's page. 30.Close internet explorer and bring up the Jmeter window.
  • 4. Reviewing the Test Plan Expand the thread group and there should be several samplers. At this point, the test plan can be saved as is. If you forget to add default http request settings, you will have to manually delete the servername, and port. In this sample, there aren't any default request parameters. If a particular request parameter is required by all pages, the request defaults is where one would add the entries. 1. Select “thread group” 2. Right click “add -> listener -> aggregate report” to add an aggregate listener. The aggregate listener will show some basic statistics.
  • 5. 3. Select “thread group” 4. Number of threads – enter “5” 5. Ramp up Period – do not change 6. Loop count – enter 100 Running the Test At this point, we are ready to run our test plan and see what happens. Save the test plan. When you're ready to run the test, there's two ways: 1. Run -> Start
  • 6. 2. CRTL – R Before you start the test, select “aggregate report”. As the test runs, the statistics will change until the test is done. At the end of the test, the aggregate report should look like this. While the test is running, in the upper right-hand corner, there should be a green square. When the test is done, the box should be grey.