SlideShare ist ein Scribd-Unternehmen logo
1 von 1
marbles.com.au
Cash flow forecast - 12 Months


Cash flow forecast - 12 Months


Period Starting:              Month 1    Month 2    Month 3    Month 4   Month 5   Month 6   Month 7   Month 8   Month 9   Month 10   Month 11   Month 12    Totals


Sales
   Listing fees                     0          0        200        240       288       346       415       498       597        717        860       1,032     5,192
   Final value fees                50        100        200        240       288       346       415       498       597        717        860       1,032     5,342
   Other                                                                                                                                                              0
Total Sales                        50        100        400        480       576       691       829       995     1,194      1,433      1,720      2,064    10,533


Less Cost of Goods Sold
   Overhead                         0          0          0          0         0         0         0         0         0          0          0          0             0
   Other                            0          0          0          0         0         0         0         0         0          0          0          0             0
Total Cost of Goods Sold            0          0          0          0         0         0         0         0         0         0          0           0             0


Gross Profit                       50        100        400        480       576       691       829       995     1,194      1,433      1,720      2,064    10,533


Operating Expenses
   Advertising                    100         50         50         50        50        50        50        50        50         50         50         50       650
   Bank charges                    60         10         10         10        10        10        10        10        10         10         10         10       170
   Bookkeeping                      0          0          0          0         0         0         0         0         0          0          0          0             0
   Depreciation                     0          0          0          0         0         0         0         0         0          0          0          0             0
   Insurance                       30         30         30         30        30        30        30        30        30         30         30         30       360
   Marketing/promotion              0          0          0          0         0         0         0         0         0          0          0          0             0
   Miscellaneous                    0          0          0          0         0         0         0         0         0          0          0          0             0
   Office supplies                 20         10         10         10        10        10        10        10        10         10         10         10       130
   Postage                          0          0          0          0         0         0         0         0         0          0          0          0             0
   Professional fees                0          0          0          0         0         0         0         0         0          0          0        200       200
   Rent                             0          0          0          0         0         0         0         0         0          0          0          0             0
   Repairs and maintenance          0          0          0          0         0         0         0         0         0          0          0          0             0
   Salaries and wages               0          0          0          0         0         0         0         0         0          0          0          0             0
   Telephone                       20         20         40         40        60        60        80        80        80        100        100        100       780
   Training and development         0          0          0          0         0         0         0         0         0          0          0          0             0
   Travel                          59         59         59         59        59        59        59        59        59         59         59         59       710
   Utilities                        0          0          0          0         0         0         0         0         0          0          0          0             0
   Web hosting expenses            40         40         40         40        40        40        40        40        40         40         40         40       480
Total Operating Expenses          329        179        199        199       219       219       239       239       239       259        259        459       3,480


Operating Income                 (279)       (79)       201        281       357       472       590       756       955      1,174      1,461      1,605      7,053


   Interest expense                            0          0          0         0         0         0         0         0          0          0          0             0
   Other income (expense)           0          0          0          0         0         0         0         0         0          0          0          0             0
Total Nonoperating Income (Expense)
                                 0             0          0          0         0         0         0         0         0         0          0           0             0


Income (Loss) Before Taxes       (279)       (79)       201        281       357       472       590       756       955      1,174      1,461      1,605      7,053


Income Taxes                                                                                                                                                          0


Net Income (Loss)                (279)       (79)       201        281       357       472       590       756       955      1,174      1,461      1,605      7,053


Cumulative Net Income (Loss)     (279)      (358)      (158)       123       480       952     1,542     2,298     3,254      4,428      5,888      7,493      7,053

Weitere ähnliche Inhalte

Was ist angesagt? (19)

Personal Budge
Personal BudgePersonal Budge
Personal Budge
 
New perfect business
New perfect businessNew perfect business
New perfect business
 
Accruals 16.02.09
Accruals 16.02.09Accruals 16.02.09
Accruals 16.02.09
 
Weartech presentation
Weartech presentationWeartech presentation
Weartech presentation
 
Parker Hannifin 2012 Annual Report
Parker Hannifin 2012 Annual ReportParker Hannifin 2012 Annual Report
Parker Hannifin 2012 Annual Report
 
Presupuesto Personal
Presupuesto PersonalPresupuesto Personal
Presupuesto Personal
 
Personal Budge
Personal BudgePersonal Budge
Personal Budge
 
12357 (201101)-2357
12357 (201101)-235712357 (201101)-2357
12357 (201101)-2357
 
Macprog (4)
Macprog (4)Macprog (4)
Macprog (4)
 
Lucagbo 1 sheet1
Lucagbo 1 sheet1Lucagbo 1 sheet1
Lucagbo 1 sheet1
 
Finalacc
FinalaccFinalacc
Finalacc
 
2011 Budget
2011 Budget2011 Budget
2011 Budget
 
HHHHHH
HHHHHHHHHHHH
HHHHHH
 
Live roulette-tv.com
Live roulette-tv.comLive roulette-tv.com
Live roulette-tv.com
 
Copy Of Cost Of Goods Formula 3 Year
Copy Of Cost Of Goods Formula 3 YearCopy Of Cost Of Goods Formula 3 Year
Copy Of Cost Of Goods Formula 3 Year
 
Gomory baumol ricardo_china
Gomory baumol ricardo_chinaGomory baumol ricardo_china
Gomory baumol ricardo_china
 
Mafia Wars Expense Guide
Mafia Wars Expense GuideMafia Wars Expense Guide
Mafia Wars Expense Guide
 
Da = new fifo lifo
Da = new fifo lifoDa = new fifo lifo
Da = new fifo lifo
 
Management accounting
Management accountingManagement accounting
Management accounting
 

Ähnlich wie Cash Flow Projection

Small Business Dec.2
Small Business Dec.2Small Business Dec.2
Small Business Dec.2JMcaninch
 
6. Seastar 6.5ha Quaterly Report
6. Seastar 6.5ha   Quaterly Report6. Seastar 6.5ha   Quaterly Report
6. Seastar 6.5ha Quaterly Reportericbali
 
Case Week 7 Carrie Miller
Case Week 7 Carrie MillerCase Week 7 Carrie Miller
Case Week 7 Carrie Millertreavor96
 
E2 financial oep report
E2 financial oep reportE2 financial oep report
E2 financial oep reportSteve Santora
 
Grape Leaf Financials
Grape Leaf FinancialsGrape Leaf Financials
Grape Leaf Financialssasha lugo
 
Project Npv
Project NpvProject Npv
Project Npvwrdiehl
 
Comparison wz peer grps
Comparison wz peer grpsComparison wz peer grps
Comparison wz peer grpsArpita Shah
 
Final Chocolate Assignment
Final Chocolate AssignmentFinal Chocolate Assignment
Final Chocolate Assignmentclmacdonald
 
Casushandelsgeestblanco
CasushandelsgeestblancoCasushandelsgeestblanco
CasushandelsgeestblancoFlexs bv
 
Financial Plan Profit And Loss Account
Financial Plan Profit And Loss AccountFinancial Plan Profit And Loss Account
Financial Plan Profit And Loss Accountruhma
 
Pbl2 p & l statement - excel
Pbl2   p & l statement - excelPbl2   p & l statement - excel
Pbl2 p & l statement - excelMARIAPHAN
 
Pbl2 p & l statement - excel
Pbl2   p & l statement - excelPbl2   p & l statement - excel
Pbl2 p & l statement - excelMARIAPHAN
 
Fluxo de Caixa caminhao 1634
Fluxo de Caixa caminhao 1634Fluxo de Caixa caminhao 1634
Fluxo de Caixa caminhao 1634conexaologistica
 
03b Bri 3 Year Monthly Forcasts Y1
03b Bri   3 Year Monthly Forcasts Y103b Bri   3 Year Monthly Forcasts Y1
03b Bri 3 Year Monthly Forcasts Y1Thomas J. Lewis
 
Presupuesto personal
Presupuesto personalPresupuesto personal
Presupuesto personalajimenezt
 
Presupuesto Paula Garro
Presupuesto Paula GarroPresupuesto Paula Garro
Presupuesto Paula GarroPGarro
 

Ähnlich wie Cash Flow Projection (20)

Small Business Dec.2
Small Business Dec.2Small Business Dec.2
Small Business Dec.2
 
6. Seastar 6.5ha Quaterly Report
6. Seastar 6.5ha   Quaterly Report6. Seastar 6.5ha   Quaterly Report
6. Seastar 6.5ha Quaterly Report
 
Case Week 7 Carrie Miller
Case Week 7 Carrie MillerCase Week 7 Carrie Miller
Case Week 7 Carrie Miller
 
uml
umluml
uml
 
E2 financial oep report
E2 financial oep reportE2 financial oep report
E2 financial oep report
 
Grape Leaf Financials
Grape Leaf FinancialsGrape Leaf Financials
Grape Leaf Financials
 
Project Npv
Project NpvProject Npv
Project Npv
 
Comparison wz peer grps
Comparison wz peer grpsComparison wz peer grps
Comparison wz peer grps
 
Final Chocolate Assignment
Final Chocolate AssignmentFinal Chocolate Assignment
Final Chocolate Assignment
 
Casushandelsgeestblanco
CasushandelsgeestblancoCasushandelsgeestblanco
Casushandelsgeestblanco
 
ratio analysis assignment
ratio analysis assignmentratio analysis assignment
ratio analysis assignment
 
Financial Plan Profit And Loss Account
Financial Plan Profit And Loss AccountFinancial Plan Profit And Loss Account
Financial Plan Profit And Loss Account
 
Pbl2 p & l statement - excel
Pbl2   p & l statement - excelPbl2   p & l statement - excel
Pbl2 p & l statement - excel
 
Pbl2 p & l statement - excel
Pbl2   p & l statement - excelPbl2   p & l statement - excel
Pbl2 p & l statement - excel
 
Fluxo de Caixa caminhao 1634
Fluxo de Caixa caminhao 1634Fluxo de Caixa caminhao 1634
Fluxo de Caixa caminhao 1634
 
03b Bri 3 Year Monthly Forcasts Y1
03b Bri   3 Year Monthly Forcasts Y103b Bri   3 Year Monthly Forcasts Y1
03b Bri 3 Year Monthly Forcasts Y1
 
Ts0011725632
Ts0011725632Ts0011725632
Ts0011725632
 
Presupuesto personal
Presupuesto personalPresupuesto personal
Presupuesto personal
 
Presupuesto Paula Garro
Presupuesto Paula GarroPresupuesto Paula Garro
Presupuesto Paula Garro
 
Personal budge portafolio
Personal budge portafolioPersonal budge portafolio
Personal budge portafolio
 

Cash Flow Projection

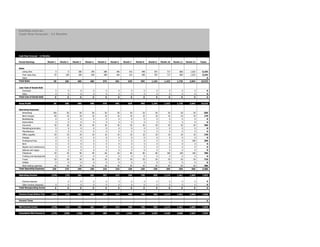
  • 1. marbles.com.au Cash flow forecast - 12 Months Cash flow forecast - 12 Months Period Starting: Month 1 Month 2 Month 3 Month 4 Month 5 Month 6 Month 7 Month 8 Month 9 Month 10 Month 11 Month 12 Totals Sales Listing fees 0 0 200 240 288 346 415 498 597 717 860 1,032 5,192 Final value fees 50 100 200 240 288 346 415 498 597 717 860 1,032 5,342 Other 0 Total Sales 50 100 400 480 576 691 829 995 1,194 1,433 1,720 2,064 10,533 Less Cost of Goods Sold Overhead 0 0 0 0 0 0 0 0 0 0 0 0 0 Other 0 0 0 0 0 0 0 0 0 0 0 0 0 Total Cost of Goods Sold 0 0 0 0 0 0 0 0 0 0 0 0 0 Gross Profit 50 100 400 480 576 691 829 995 1,194 1,433 1,720 2,064 10,533 Operating Expenses Advertising 100 50 50 50 50 50 50 50 50 50 50 50 650 Bank charges 60 10 10 10 10 10 10 10 10 10 10 10 170 Bookkeeping 0 0 0 0 0 0 0 0 0 0 0 0 0 Depreciation 0 0 0 0 0 0 0 0 0 0 0 0 0 Insurance 30 30 30 30 30 30 30 30 30 30 30 30 360 Marketing/promotion 0 0 0 0 0 0 0 0 0 0 0 0 0 Miscellaneous 0 0 0 0 0 0 0 0 0 0 0 0 0 Office supplies 20 10 10 10 10 10 10 10 10 10 10 10 130 Postage 0 0 0 0 0 0 0 0 0 0 0 0 0 Professional fees 0 0 0 0 0 0 0 0 0 0 0 200 200 Rent 0 0 0 0 0 0 0 0 0 0 0 0 0 Repairs and maintenance 0 0 0 0 0 0 0 0 0 0 0 0 0 Salaries and wages 0 0 0 0 0 0 0 0 0 0 0 0 0 Telephone 20 20 40 40 60 60 80 80 80 100 100 100 780 Training and development 0 0 0 0 0 0 0 0 0 0 0 0 0 Travel 59 59 59 59 59 59 59 59 59 59 59 59 710 Utilities 0 0 0 0 0 0 0 0 0 0 0 0 0 Web hosting expenses 40 40 40 40 40 40 40 40 40 40 40 40 480 Total Operating Expenses 329 179 199 199 219 219 239 239 239 259 259 459 3,480 Operating Income (279) (79) 201 281 357 472 590 756 955 1,174 1,461 1,605 7,053 Interest expense 0 0 0 0 0 0 0 0 0 0 0 0 Other income (expense) 0 0 0 0 0 0 0 0 0 0 0 0 0 Total Nonoperating Income (Expense) 0 0 0 0 0 0 0 0 0 0 0 0 0 Income (Loss) Before Taxes (279) (79) 201 281 357 472 590 756 955 1,174 1,461 1,605 7,053 Income Taxes 0 Net Income (Loss) (279) (79) 201 281 357 472 590 756 955 1,174 1,461 1,605 7,053 Cumulative Net Income (Loss) (279) (358) (158) 123 480 952 1,542 2,298 3,254 4,428 5,888 7,493 7,053