SlideShare ist ein Scribd-Unternehmen logo
1 von 8
The Site
The Area


Population
    The 2011A population estimate in this selected geography is 83,763. The 2010 Census revealed a population of 83,094, and in 2000 it was 67,260 representing a 23.5% change.
        It is projected the population in this area will be 87,515 in 2016, representing a change of 4.5% from 2011A. The current population is 50.0% male and 50.0% female. In
        2011A, the median age of the population in this area was 36.8, compared to the US median age which was 37.1. The population density in your area is 266.6 people per
        square mile.
Households
    There are currently 27,523 estimated households in this selected geography. The Census revealed household counts of 27,062 in 2010 and 21,815 in 2000, representing a
        change of 24.1%. It is projected the number of households in this area will be 29,405 in 2016, representing a change of 6.8% from the current year.
    In 2011A, the median number of years in residence in this geography's population is 3.3. The average household size in this geography was 3.0 people and the average family
        size was 3.5 people. The average number of vehicles per household in this geography was 2.1.
Income
    In 2011A, the median household income in this selected geography was $69,774, compared to the US median which was $50,008. The Census revealed median household
        incomes of $56,035 in 2000. Income questions were not asked in the 2010 Census and will be available in an upcoming ACS (American Communities Survey) release. It is
        projected the median household income in this area will be $75,557 in 2016, which would represent a change of 8.3% from the current year.
    In 2011A, the per capita income in this area was $26,825, compared to the US per capita, which was $26,226. The 2011A average household income for this area was $80,589,
        compared to the US average which was $67,073.
Race & Ethnicity
    In 2011A, the racial makeup of this selected area was as follows: 88.5% White; 4.9% Black; 0.2% Native American; 0.8% Asian/Pacific Islander; and 3.6% Other. Compare these
        to the US racial makeup which was: 72.4% White, 12.6% Black, 1.0% Native American, 4.7% Asian/Pacific Islander and 5.9% Other.
    People of Hispanic ethnicity are counted independently of race. People of Hispanic origin make up 10.3% of the current year population in this selected area. Compare this to
        the US makeup of 16.9%. Changes in the population within each race and ethnicity category from the 2000 Census to the 2010 Census are as follows: 33.2% American
        Indian, Eskimo, Aleut Population; 160.1% Asian, Pacific Islander; 22.4% Black; 115.0% Hispanic Ethnicity; 124.5% Other; White 19.7%.
Housing, Employment & Education
Housing
     The median housing value in this area was $116,991 in 1990; compare this to the US median of $78,381 for
     the same year. The 2000 Census median housing value was $151,138. In 2000, there were 77.8% owner
     occupied housing units in this area vs. 79.2% estimated in 2011A. Also in 2000, there were 18.4% renter
     occupied housing units in this area vs. 16.5% estimated in 2011A. The average rent in 2000 was $507.
     Detailed Housing Units questions were not asked in the 2010 Census and will be available in an upcoming ACS
     release.


Employment
    In 2011A, there were 44,686 people over the age of 16 in the labor force in your geography. Of these 92.1%
    were employed, 7.9% were unemployed, 31.4% were not in the labor force and 0.1% were in the Armed
    Forces. In 2000, unemployment in this area was 3.4%.
    In 2011A, there were 18,834 employees in this selected area (daytime population) and there were 1,897
    establishments. For this area in 2000, white collar workers made up 55.0% of the population, and those
    employed in blue collar occupations made up 45.0%. In 2000, the average time traveled to work was 28
    minutes. Detailed Employment questions were not asked in the 2010 Census and will be available in an
    upcoming ACS release.

Educational Facilities
     The local public school district is the Oxford Area School District. There are six schools associated with the
     district: Jordan Bank Elementary, Elk Ridge Elementary, Nottingham Elementary, Hopewell Elementary, Penn's
     Grove Middle, and Oxford Area High School. Sacred Heart School is also located in Oxford, but is considered
     part of the Archdiocese of Philadelphia. Oxford is the closest town to Lincoln University, the first historically
     black college in the United States.
Existing Tenants


 SPROUTS EARLY LEARNING CENTER


                                   RETAIL PAD #2 - UNDER CONTRACT

RETAIL PAD #1 – SUSQUEHANNA BANK
3,900SF still available - prime, free-standing retail space available
Located just off US Route 1 on busy Route 10 (Limestone Road Exit).
Visible from Route 1.
Easy on/easy off highway access.
Great thru-traffic.
Space is divisible to 2,000 SF.


4,500 SF Pad Retail Space available
Located just off US Route 1 on busy Route 10 (Limestone Road Exit).
Visible from Route 1.
Easy on/easy off highway access
Great thru-traffic.
Available Immediately – Fit-out options available
Drive-Thru Capability
(610) 444-7770

(610) 444-7787

Click Here to Email Us
                         Click here to go to our
                                website

Weitere ähnliche Inhalte

Empfohlen

Social Media Marketing Trends 2024 // The Global Indie Insights
Social Media Marketing Trends 2024 // The Global Indie InsightsSocial Media Marketing Trends 2024 // The Global Indie Insights
Social Media Marketing Trends 2024 // The Global Indie Insights
Kurio // The Social Media Age(ncy)
 
Good Stuff Happens in 1:1 Meetings: Why you need them and how to do them well
Good Stuff Happens in 1:1 Meetings: Why you need them and how to do them wellGood Stuff Happens in 1:1 Meetings: Why you need them and how to do them well
Good Stuff Happens in 1:1 Meetings: Why you need them and how to do them well
Saba Software
 

Empfohlen (20)

Content Methodology: A Best Practices Report (Webinar)
Content Methodology: A Best Practices Report (Webinar)Content Methodology: A Best Practices Report (Webinar)
Content Methodology: A Best Practices Report (Webinar)
 
How to Prepare For a Successful Job Search for 2024
How to Prepare For a Successful Job Search for 2024How to Prepare For a Successful Job Search for 2024
How to Prepare For a Successful Job Search for 2024
 
Social Media Marketing Trends 2024 // The Global Indie Insights
Social Media Marketing Trends 2024 // The Global Indie InsightsSocial Media Marketing Trends 2024 // The Global Indie Insights
Social Media Marketing Trends 2024 // The Global Indie Insights
 
Trends In Paid Search: Navigating The Digital Landscape In 2024
Trends In Paid Search: Navigating The Digital Landscape In 2024Trends In Paid Search: Navigating The Digital Landscape In 2024
Trends In Paid Search: Navigating The Digital Landscape In 2024
 
5 Public speaking tips from TED - Visualized summary
5 Public speaking tips from TED - Visualized summary5 Public speaking tips from TED - Visualized summary
5 Public speaking tips from TED - Visualized summary
 
ChatGPT and the Future of Work - Clark Boyd
ChatGPT and the Future of Work - Clark Boyd ChatGPT and the Future of Work - Clark Boyd
ChatGPT and the Future of Work - Clark Boyd
 
Getting into the tech field. what next
Getting into the tech field. what next Getting into the tech field. what next
Getting into the tech field. what next
 
Google's Just Not That Into You: Understanding Core Updates & Search Intent
Google's Just Not That Into You: Understanding Core Updates & Search IntentGoogle's Just Not That Into You: Understanding Core Updates & Search Intent
Google's Just Not That Into You: Understanding Core Updates & Search Intent
 
How to have difficult conversations
How to have difficult conversations How to have difficult conversations
How to have difficult conversations
 
Introduction to Data Science
Introduction to Data ScienceIntroduction to Data Science
Introduction to Data Science
 
Time Management & Productivity - Best Practices
Time Management & Productivity -  Best PracticesTime Management & Productivity -  Best Practices
Time Management & Productivity - Best Practices
 
The six step guide to practical project management
The six step guide to practical project managementThe six step guide to practical project management
The six step guide to practical project management
 
Beginners Guide to TikTok for Search - Rachel Pearson - We are Tilt __ Bright...
Beginners Guide to TikTok for Search - Rachel Pearson - We are Tilt __ Bright...Beginners Guide to TikTok for Search - Rachel Pearson - We are Tilt __ Bright...
Beginners Guide to TikTok for Search - Rachel Pearson - We are Tilt __ Bright...
 
Unlocking the Power of ChatGPT and AI in Testing - A Real-World Look, present...
Unlocking the Power of ChatGPT and AI in Testing - A Real-World Look, present...Unlocking the Power of ChatGPT and AI in Testing - A Real-World Look, present...
Unlocking the Power of ChatGPT and AI in Testing - A Real-World Look, present...
 
12 Ways to Increase Your Influence at Work
12 Ways to Increase Your Influence at Work12 Ways to Increase Your Influence at Work
12 Ways to Increase Your Influence at Work
 
ChatGPT webinar slides
ChatGPT webinar slidesChatGPT webinar slides
ChatGPT webinar slides
 
More than Just Lines on a Map: Best Practices for U.S Bike Routes
More than Just Lines on a Map: Best Practices for U.S Bike RoutesMore than Just Lines on a Map: Best Practices for U.S Bike Routes
More than Just Lines on a Map: Best Practices for U.S Bike Routes
 
Ride the Storm: Navigating Through Unstable Periods / Katerina Rudko (Belka G...
Ride the Storm: Navigating Through Unstable Periods / Katerina Rudko (Belka G...Ride the Storm: Navigating Through Unstable Periods / Katerina Rudko (Belka G...
Ride the Storm: Navigating Through Unstable Periods / Katerina Rudko (Belka G...
 
Barbie - Brand Strategy Presentation
Barbie - Brand Strategy PresentationBarbie - Brand Strategy Presentation
Barbie - Brand Strategy Presentation
 
Good Stuff Happens in 1:1 Meetings: Why you need them and how to do them well
Good Stuff Happens in 1:1 Meetings: Why you need them and how to do them wellGood Stuff Happens in 1:1 Meetings: Why you need them and how to do them well
Good Stuff Happens in 1:1 Meetings: Why you need them and how to do them well
 

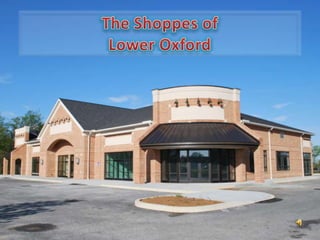
The Shoppes Of Lower Oxford

  • 1.
  • 3. The Area Population The 2011A population estimate in this selected geography is 83,763. The 2010 Census revealed a population of 83,094, and in 2000 it was 67,260 representing a 23.5% change. It is projected the population in this area will be 87,515 in 2016, representing a change of 4.5% from 2011A. The current population is 50.0% male and 50.0% female. In 2011A, the median age of the population in this area was 36.8, compared to the US median age which was 37.1. The population density in your area is 266.6 people per square mile. Households There are currently 27,523 estimated households in this selected geography. The Census revealed household counts of 27,062 in 2010 and 21,815 in 2000, representing a change of 24.1%. It is projected the number of households in this area will be 29,405 in 2016, representing a change of 6.8% from the current year. In 2011A, the median number of years in residence in this geography's population is 3.3. The average household size in this geography was 3.0 people and the average family size was 3.5 people. The average number of vehicles per household in this geography was 2.1. Income In 2011A, the median household income in this selected geography was $69,774, compared to the US median which was $50,008. The Census revealed median household incomes of $56,035 in 2000. Income questions were not asked in the 2010 Census and will be available in an upcoming ACS (American Communities Survey) release. It is projected the median household income in this area will be $75,557 in 2016, which would represent a change of 8.3% from the current year. In 2011A, the per capita income in this area was $26,825, compared to the US per capita, which was $26,226. The 2011A average household income for this area was $80,589, compared to the US average which was $67,073. Race & Ethnicity In 2011A, the racial makeup of this selected area was as follows: 88.5% White; 4.9% Black; 0.2% Native American; 0.8% Asian/Pacific Islander; and 3.6% Other. Compare these to the US racial makeup which was: 72.4% White, 12.6% Black, 1.0% Native American, 4.7% Asian/Pacific Islander and 5.9% Other. People of Hispanic ethnicity are counted independently of race. People of Hispanic origin make up 10.3% of the current year population in this selected area. Compare this to the US makeup of 16.9%. Changes in the population within each race and ethnicity category from the 2000 Census to the 2010 Census are as follows: 33.2% American Indian, Eskimo, Aleut Population; 160.1% Asian, Pacific Islander; 22.4% Black; 115.0% Hispanic Ethnicity; 124.5% Other; White 19.7%.
  • 4. Housing, Employment & Education Housing The median housing value in this area was $116,991 in 1990; compare this to the US median of $78,381 for the same year. The 2000 Census median housing value was $151,138. In 2000, there were 77.8% owner occupied housing units in this area vs. 79.2% estimated in 2011A. Also in 2000, there were 18.4% renter occupied housing units in this area vs. 16.5% estimated in 2011A. The average rent in 2000 was $507. Detailed Housing Units questions were not asked in the 2010 Census and will be available in an upcoming ACS release. Employment In 2011A, there were 44,686 people over the age of 16 in the labor force in your geography. Of these 92.1% were employed, 7.9% were unemployed, 31.4% were not in the labor force and 0.1% were in the Armed Forces. In 2000, unemployment in this area was 3.4%. In 2011A, there were 18,834 employees in this selected area (daytime population) and there were 1,897 establishments. For this area in 2000, white collar workers made up 55.0% of the population, and those employed in blue collar occupations made up 45.0%. In 2000, the average time traveled to work was 28 minutes. Detailed Employment questions were not asked in the 2010 Census and will be available in an upcoming ACS release. Educational Facilities The local public school district is the Oxford Area School District. There are six schools associated with the district: Jordan Bank Elementary, Elk Ridge Elementary, Nottingham Elementary, Hopewell Elementary, Penn's Grove Middle, and Oxford Area High School. Sacred Heart School is also located in Oxford, but is considered part of the Archdiocese of Philadelphia. Oxford is the closest town to Lincoln University, the first historically black college in the United States.
  • 5. Existing Tenants SPROUTS EARLY LEARNING CENTER RETAIL PAD #2 - UNDER CONTRACT RETAIL PAD #1 – SUSQUEHANNA BANK
  • 6.
  • 7. 3,900SF still available - prime, free-standing retail space available Located just off US Route 1 on busy Route 10 (Limestone Road Exit). Visible from Route 1. Easy on/easy off highway access. Great thru-traffic. Space is divisible to 2,000 SF. 4,500 SF Pad Retail Space available Located just off US Route 1 on busy Route 10 (Limestone Road Exit). Visible from Route 1. Easy on/easy off highway access Great thru-traffic. Available Immediately – Fit-out options available Drive-Thru Capability
  • 8. (610) 444-7770 (610) 444-7787 Click Here to Email Us Click here to go to our website