2. 2 Batal et al.: Plasma Fatty Acids and CF
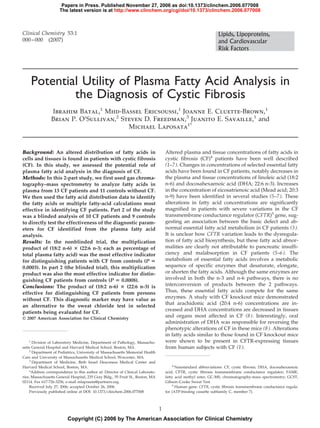
Table 1. Demographic and genotypic characteristics of the CF patients.
Nonblinded Trial Blinded Trial
Sweat chloride, Sweat chloride,
Sexa
No. Age, years mEq/L Genotype No. Sex Age, years mEq/L Genotype
1 M 18 87 dF508/N1303K 1 F 18 114 dF508/dF508
2 M 18 91 dF508/dF508 2 M 21 115 dF508/dI507
Unknownb
3 F 28 117 dF508/dF508 3 M 22 dF508/dF508
4 F 17 88 dF508/dF508 4 F 17 101 dF508/dF508
dF508/3849 10kb C-Tc
5 M 18 84 dF508/G551D 5 F 12 35
6 F 41 150 dF508/dl507 6 F 7 101 dF508/dF508
NAd
7 M 15 100 dF508/W1282X 7 M 7 dF508/Y1092X
8 F 23 116 dF508/1717-1G3A 8 M 19 78 dF508/dF508
dF508/—e
9 F 16 NA 9 M 21 122 dF508/W1282X
10 F 23 NA dF508/dF508 10 F 18 104 dF508/dF508
11 M 19 129 dF508/G551D
12 F 19 115 dF508/G542X
13 M 32 NA dF508/—
a
M, male; F, female.
b
The patient had been seen at another medical center and was found to have a genotype consistent with CF; therefore, the sweat chloride test was not repeated
in our study.
c
This genotype is consistent with negative sweat chloride test values in CF.
d
NA, not analyzed
e
—, Unidentified genotype.
confirmed CF status (9–12 ). Another limitation for the
Because certain alterations in plasma fatty acid compo-
sweat test is that false-positive values may occur in
sition in CF are highly reproducible, fatty acid analysis
several clinical conditions readily distinguishable from CF
may be useful as a diagnostic procedure for CF. The
(13 ). In rare cases, some homozygous CF patients have
altered fatty acid distributions that we observed in our
sweat chloride concentrations within reference intervals if
own studies with CF knockout mice and subsequently
a second ameliorating or neutralizing variation in the
with CF patients prompted us to reexamine our database
CFTR gene product, such as R553Q, is also present (13 ).
of CF patients to determine whether specific plasma fatty
Nasal potential difference measurement is also used as
acid changes can be used to differentiate between CF
a diagnostic procedure in the evaluation for CF (14, 15 ).
patients and persons not suffering from CF.
An increased nasal potential difference is strong evidence
The sweat chloride test is the gold standard screening
for CF, but a value within reference intervals does not
test for CF, but this test has limitations. A subset of
exclude the diagnosis (16 ). False-negative results may
patients with CF show values for the sweat chloride test
arise, especially in the presence of a nasal polyp (17 ). To
that are not diagnostic, and some CF patients demonstrate
confirm a diagnosis of CF, an increased nasal potential
a sweat chloride value within reference intervals despite
Table 2. Mean (SD) plasma fatty acidsa of CF patients and healthy controls.
Nonblinded Analysis Blinded Analysis
b
P valueb
Fatty acid parameter CF patients (n 13) Controls (n 11) P value CF patients (n 10) Controls (n 9)
(18:2 n-6) (22:6 n-3) 23.6 (2.7) 79.7 (10.5) 0.0003 20.2 (2.2) 42.4 (4.5) 0.0008
22:6 n-3 1.04 (0.14) 2.92 (0.56) 0.007 0.89 (0.06) 1.59 (0.2) 0.006
Total n-6/Total n-3 14.6 (1.13) 9.94 (1.23) 0.01 16.6 (0.5) 12.2 (1.3) 0.008
18:2 n-6 23.9 (1.7) 29.2 (1.9) 0.05 22.3 (1.2) 27.2 (1.1) 0.01
(22:5 n-6)/(22:6 n-3) 0.23 (0.03) 0.10 (0.02) 0.001 0.37 (0.03) 0.19 (0.03) 0.0008
(22:5 n-6)/(22:5 n-3) 0.47 (0.12) 0.38 (0.09) NS 1.05 (0.2) 0.65 (0.07) 0.04
(18:2 n-6) (22:6 n-3) (22:5 n-6) 97.6 (16.1) 321.9 (92.6) 0.04 67.4 (8.6) 194.7 (52.6) 0.04
(18:2 n-6)/(16:0) 1.08 (0.10) 1.41 (0.10) 0.03 0.93 (0.07) 1.11 (0.05) 0.05
(20:3 n-9)/(18:2 n-6) 0.02 (0.005) 0.002 (0.001) 0.01 0.006 (0.002) 0.001 (0.0006) NS
(20:3 n-9) (22:5 n-6) 0.005 (0.002) 0.0004 (0.0002) 0.01 0.003 (0.001) 0.0002 (0.9) NS
(18:2 n-6) (22:6 n-3)
20:3 n-9 0.34 (0.1) 0.05 (0.03) 0.01 0.12 (0.04) 0.03 (0.01) NS
a
Values mean (SE) for individual fatty acids are expressed as mole percentages, and calculations are derived from mole percentages of individual fatty acids.
a
Derived from the Student t-test. NS, not significant.
3. 3
Clinical Chemistry 53, No. 1, 2007
Fig. 1. The multiplication product of (18:2 n-6) (22:6 n-3; each as
percentage of total plasma fatty acid) in the nonblinded analysis of 13
patients with CF and 11 non-CF controls and in the blinded analysis of Fig. 2. The multiplication product of (18:2 n-6) (22:6 n-3; each as
10 patients with CF and 9 non-CF controls. percentage of total plasma fatty acid) in CF patients and non-CF
controls in the nonblinded trial, the blinded trial, and a study by
The non-CF controls had significantly higher concentrations than the CF patients
(P 0.0003 and 0.0008 in the nonblinded and blinded studies, respectively). Benabdeslam et al. (22 ).
Data are presented as mean (SE) because the individual values were not
available from Benabdeslam et al. (22 ). The non-CF controls had a significantly
higher concentration than the CF patients in all studies.
difference must be demonstrated twice. The nasal poten-
tial difference measurement is a technically challenging controls [46 (11.2) years; range, 30 – 62 years]; patients and
procedure (13 ). controls were selected after we reviewed medical records.
These limitations of existing methods led us to pursue
an alternative screening test involving plasma fatty acid plasma fatty acid isolation and methylation
analysis to confirm the diagnosis of CF in patients with We obtained peripheral venous blood from nonfasting
questionable sweat test results and positive clinical find- participants. Samples were collected in heparin-contain-
ings for CF. ing vacuum tubes and centrifuged at 45g for 15 min at
room temperature. Thereafter, the plasma was removed.
Materials and Methods Fatty acids from plasma were isolated and methylated
enrollment of patients according to Moser and Moser (20 ). The fatty acid methyl
The nonblinded study was conducted from October ester (FAME) mixture was analyzed by gas chromatog-
2000 to September 2003, and the blinded study was raphy–mass spectrometry (GC-MS).
conducted from September 2004 to August 2005. CF
patients attending the University of Massachusetts Med- gc-ms fame identification and quantification
ical Center and Beth Israel Deaconess Medical Center GC-MS analysis was performed on a Hewlett-Packard
were included in the studies. Reference values were Series II 5890 gas chromatograph coupled to an HP-5971
obtained from healthy controls recruited at both sites. mass spectrometer (Agilent Technologies) equipped with
Exclusion criteria for the controls included findings con- a Supelcowax SP-10 capillary column (Supelco). The oven
sistent with the presence of CF, the use of drugs that affect temperature was maintained at 150 °C for 2 min, ramped
fatty acid metabolism, or a family history of CF. All study at 10 °C/min to 200 °C and held for 4 min, ramped again
patients had pancreatic insufficiency and met the criteria at 5 °C/min to 240 °C and held for 3 min, and then finally
for CF diagnosis (18 ). All study participants provided ramped to 270 °C at 10 °C/min and maintained for 5 min.
written informed consent before enrollment. Participants The injector and detector were maintained at 260 °C and
were randomly selected for part 2 (blinded) of the study. 280 °C, respectively. Carrier gas flow rate was maintained
In the nonblinded and blinded studies, the CF patients, at a constant 0.8 mL/min throughout. Total ion monitor-
but not the controls, were encouraged to eat high-fat, ing was performed, encompassing mass ranges from 50
high-energy diets and to visit a nutritionist regularly, in to 550 atomic mass units. Peak identification was based on
accordance with the guidelines of the Cystic Fibrosis comparison of both retention time and mass spectra of
Foundation (19 ). The nonblinded study included 13 pa- the unknown peak to those of known standards within
tients with CF [mean (SD) age, 22.1 (7.5) years; range, the GC-MS database library. A commercially available
15– 41 years] and 11 healthy controls [26.5 (7.2) years; standard mixture of FAMEs (Nucheck) was used to
range, 19 –33 years]. The blinded study included 10 pa- calculate masses of fatty acids based on the response
factor of 17:0 FAME (21 ).
tients with CF [16.2 (5.6) years; range, 7–22 years] and 9
4. 4 Batal et al.: Plasma Fatty Acids and CF
cutoff of 40 arbitrary units compared with 100%, 56%,
Three samples from the control group were excluded
71%, and 100% for the blinded trial with the same cutoff
from part 1 of the study because the fatty acid profile
of 40 arbitrary units. Combined data from the blinded and
indicated significant loss of fatty acids in the processing of
nonblinded trials showed values for sensitivity, specific-
the samples. In the excluded samples, the normally prom-
ity, positive predictive value, and negative predictive
inent fatty acids had areas that were 3–10-fold below the
value of 96%, 75%, 81%, and 94%, respectively, for the
area of the internal standard. Accepted samples were
same cutoff of 40 arbitrary units. In addition, there were
those in which the most prominent fatty acids were
no technical limitations associated with sample collection.
3– 6-fold greater in peak area than the internal standard.
The sensitivity of the assay for detection of CF was very
In part 2 of the study, all specimens were analyzed in a
high, and false positives were definitively identified as CF
blinded fashion.
or non-CF by genetic testing.
statistical analysis
Discussion
Plasma fatty acid concentrations of CF patients and
non-CF controls were compared. The unpaired Student Our data demonstrate that a multiplication product of
t-test was used to evaluate differences between the means plasma (18:2 n-6) (22:6 n-3) can be used to differentiate
of the 2 groups. Differences were considered statistically CF patients and non-CF controls in the majority of cases.
significant at P 0.05. This multiplication product was the most effective param-
eter in measuring plasma fatty acid status between CF
Results patients and controls, and as a diagnostic marker, it
provided a higher level of statistical significance than any
The demographic and genotypic characteristics of the CF
other mathematical operations or clinical markers tested.
patients who were evaluated with plasma fatty acid
In a study by Benabdeslam et al. (22 ), plasma phos-
analysis are shown in Table 1. A genotype consistent with
pholipid fatty acid analysis was performed with fasting
the diagnosis of CF obviated the need for sweat testing in
blood samples collected from 65 CF patients and 39
some patients. One of the CF patients from the blinded
controls, whereas in our study, both the blinded and
trial had a genotype that was consistent with a negative
nonblinded trials were performed with samples collected
sweat-chloride test value.
from nonfasting CF patients and controls, a procedural
Eleven different plasma fatty acid markers for differ-
difference that may slightly alter plasma fatty acid com-
entiating CF patients from controls, including (18:2 n-6)
position. Other investigators have shown, however, that it
(22:6 n-3), were tested in the nonblinded trial (Table 2).
is unlikely that total plasma fatty acid composition is
There were significant differences between CF patients
significantly altered by a fasting period (23 ). The data in
and controls for the multiplication product of (18:2 n-6)
Fig. 2 show 3 paired comparisons between a CF group
(22:6 n-3; P 0.0003), the ratio of (22:5 n-6):(22:6 n-3; P
and a control group, including comparison of data from
0.001), and 22:6 n-3 alone (P 0.007). The multiplication
total plasma fatty acid analysis in CF patients and controls
product of (18:2 n-6) (22:6 n-3; each as percentage of
using our data and data from the study by Benabdeslam
total plasma fatty acid) most effectively distinguished
et al. (22 ). The (18:2 n-6) (22:6 n-3) value separates CF
patients with CF from controls (Fig. 1).
patients from non-CF controls in all 3 paired comparisons.
In the blinded trial, we tested 11 different plasma fatty
The absolute values for (18:2 n-6) (22:6 n-3) are very
acid markers (Table 2). Again, the multiplication product
different, however, especially for the control groups. In
of (18:2 n-6) (22:6 n-3) was the most statistically
the current study, we used total plasma fatty acids be-
significant parameter in distinguishing CF patients from
cause samples do not require additional processing to
controls (P 0.0008; Fig. 1).
isolate phospholipids from total fatty acids. Thus, our
The multiplication product of (18:2 n-6) (22:6 n-3) in
method simplifies sample preparation for clinical use. In
the nonblinded trial of our study showed sensitivity,
specificity, positive predictive value, and negative predic- the 2 studies involving total fatty acids, although the
tive value of 92%, 91%, 92%, and 91%, respectively, for a control groups were markedly different, the CF groups
(22:6 n-3).a
Table 3. Diagnostic sensitivity and specificity of sweat chloride test and of (18:2 n-6)
Diagnostic Tests Technical Failure Rate Diagnostic Sensitivity Diagnostic Specificity
Sweat test, % Mastella et al. (24 ) 3.6 91 100
Sweat test, % Warwick et al. (25 ) 14 93 99
(18:2 n-6) (22:6 n-3), % Negligible 92 91
Nonblinded analysis
Blinded analysis, % (18:2 n-6) (22:6 n-3) Negligible 100 56
Blinded nonblinded analysis, % (18:2 n-6) Negligible 96 75
(22:6 n-3)
a
Cutoff value for fatty acid analyses is 40 arbitrary units
5. 5
Clinical Chemistry 53, No. 1, 2007
Fig. 3. A diagnostic algorithm illustrating a suggested evaluation of patients with CF, including fatty acid analysis as a complementary and/or
alternative test to the sweat chloride test in patients with CF (28 ).
*, Sweat test results must be 80 to be abnormal in infants. **, Sweat test results must be 40 to be normal in infants.
respectively. The rationale for this approach is analogous
were very similar. The control group for the blinded trial
to the protocol for the HIV ELISA screening test, which is
showed a lower DHA concentration than the control
followed up by a Western blot test for confirmation, with
group for the nonblinded trial (Fig. 2), the major differ-
the goal of 100% sensitivity in the screening study.
ence between the 2 control groups. This finding may be
To determine whether plasma fatty acid analysis can
attributable to lower fish consumption or fish oil supple-
help in the evaluation of CF patients, we compared the
mentation in the blinded trial than the nonblinded trial
sensitivity, specificity, positive predictive value, and neg-
control groups, both of which were randomly selected.
ative predictive value of the sweat chloride test reported
Because total fatty acid values were very similar in both
in 2 different published studies (24, 25 ) with the most
CF populations, a value 40 could be used as a clinical
favorable diagnostic fatty acid marker in our study
cutoff for CF; therefore, patients with a value 40 should
(Table 3). The technical failure rate of plasma fatty acid
undergo follow-up genetic studies. In the blinded and
analysis as a diagnostic test for CF is negligible because
nonblinded trials, use of a cutoff of 40 would have
blood samples are readily collected.
resulted in a genetic study for 4 controls and 1 control,
6. 6 Batal et al.: Plasma Fatty Acids and CF
patients with borderline sweat test values will be infor-
The Gibson–Cooke Sweat Test (GCST) is the standard
mative. In addition, further study is necessary to deter-
technique used in the diagnosis of CF. Two previous
mine the diagnostic accuracy of plasma fatty acid analysis
published studies (24, 25 ) compared the results of the
in a CF clinical setting. The data in this initial study,
GCST technique with results obtained using different
however, indicate that fatty acid analysis is a promising
assays for sweat chloride collection and measurement.
screening test for CF if sweat chloride testing cannot be
The 1st study (24 ) used a cutoff value of 70 mmol/L to
performed.
differentiate between intermediate and abnormal sweat
chloride test results rather than the cutoff value of 60
mmol/L used by the Cystic Fibrosis Foundation (26 ). In References
the Mastella et al. study (24 ), 3.6% of the samples did not 1. Freedman SD, Blanco PG, Zaman MM, Shea JC, Ollero M, Hopper
IK, et al. Association of cystic fibrosis with abnormalities in fatty
contain enough sweat to perform a sweat chloride analy-
acid metabolism. N Engl J Med 2004;350:560 –9.
sis. Among the CF patients, sweat chloride concentrations
2. Lepage G, Levy E, Ronco N, Smith L, Galeano N, Roy CC. Direct
were outside the reference interval in 91.2%, within the
transesterification of plasma fatty acids for the diagnosis of
reference interval in 1%, and borderline in 7.8%. Among essential fatty acid deficiency in cystic fibrosis. J Lipid Res
healthy controls, 4% had borderline sweat chloride con- 1989;30:1483–90.
centrations (24 ). In this study (24 ), the sensitivity and the 3. Strandvik B, Gronowitz E, Enlund F, Martinsson T, Wahlstrom J.
specificity for the GCST were 91% and 100%, respectively. Essential fatty acid deficiency in relation to genotype in patients
with cystic fibrosis. J Pediatr 2001;139:650 –5.
In the 2nd study (25 ) the GCST could not be performed on
4. Carlstedt-Duke J, Bronnegard M, Strandvik B. Pathological regula-
15% of the CF patients because these patients failed to
tion of arachidonic acid release in cystic fibrosis: the putative
produce enough sweat for analysis. The sensitivity and basic defect. Proc Natl Acad Sci U S A 1986;83:9202– 6.
the specificity values for the GCST were 93% and 99%, 5. Farrell PM, Mischler EH, Engle MJ, Brown DJ, Lau SM. Fatty acid
respectively, for this study (25 ). abnormalities in cystic fibrosis. Pediatr Res 1985;19:104 –9.
Despite the high sensitivity and specificity of the sweat 6. Hubbard VS, Dunn GD, di Sant’Agnese PA. Abnormal fatty-acid
chloride gold standard diagnostic screening test, practical composition of plasma lipids in cystic fibrosis. A primary or
secondary defect? Lancet 1977;2:1302– 4.
difficulties limit the performance of the sweat test, partic-
7. Lloyd-Still JD, Johnson SB, Holman RT. Essential fatty acid status
ularly in infants younger than 4 weeks (27 ). In cases in
in cystic fibrosis and the effect of safflower oil supplementation.
which sweat testing is technically not possible or is Am J Clin Nutr 1981;34:1–7.
clinically misleading, plasma fatty acid analysis as a 8. Freedman SD, Katz MH, Parker EM, Laposata M, Urman MY,
screening test for CF may be useful, as proposed in Fig. 3. Alvarez JG. A membrane lipid imbalance plays a role in the
Although the sensitivity values of plasma fatty acid phenotypic expression of cystic fibrosis in cftr (-/-) mice. Proc Natl
Acad Sci U S A 1999;96:13995–14000.
analysis support its utility as a diagnostic test for patients
9. Stewart B, Zabner J, Shuber AP, Welsh MJ, McCray PB Jr. Normal
with CF, this analysis requires a relatively sophisticated
sweat chloride values do not exclude the diagnosis of cystic
assay involving gas chromatography to generate the re-
fibrosis. Am J Respir Crit Care Med 1995;151:899 –903.
quired fatty acid profile. Because the fatty acids of interest 10. Leoni GB, Pitzalis S, Podda R, Zanda M, Silvetti M, Caocci L, et al. A
are predominant in the plasma, it is likely that the fatty specific cystic fibrosis mutation (T3381) associated with the pheno-
acid analysis can be performed with a gas chromatograph type of isolated hypotonic dehydration. J Pediatr 1995;127:281–3.
with a standard flame ionization detector and may not 11. Highsmith WE, Burch LH, Zhou Z, Olsen JC, Boat TE, Spock A, et
al. A novel mutation in the cystic fibrosis gene in patients with
require a mass spectrometer, as was used in our study.
pulmonary disease but normal sweat chloride concentrations.
We reported plasma fatty acid concentrations as percent-
N Engl J Med 1994;331:974 – 80.
age of total fatty acids because mole percent or gram
12. Fitzgerald D, Van Asperen P, Henry R, Walters D, Freelander M,
percent data are much simpler to obtain than are amounts Wilson M, et al. Delayed diagnosis of cystic fibrosis in children
of the individual fatty acids in micrograms of fatty acid with a rare genotype (delta F508/R117H). J Paediatr Child Health
per milliliter of plasma. When actual amounts in mass are 1995;31:168 –71.
required, meticulous attention to fatty acid recovery for 13. Stern RC. The diagnosis of cystic fibrosis. N Engl J Med 1997;
336:487–91.
the individual fatty acids is necessary. With variable loss
14. Alton EW, Currie D, Logan-Sinclair R, Warren JO, Hodson ME,
of fatty acids between specimens, the mole or gram
Geddes DM. Nasal potential difference: a clinical diagnostic test
percentage of total fatty acids stays the same. The sim- for cystic fibrosis. Eur Respir J 1990;3:922– 6.
plicity of using mole percentages is important for fatty 15. Sauder RA, Chesrown SE, Loughlin GM. Clinical application of
acid analyses performed in a clinical laboratory. transepithelial potential difference measurements in cystic fibro-
sis. J Pediatr 1987;111:353– 8.
In summary, fatty acid analysis is not a substitute for 16. Rosenstein BJ, Cutting GR. The diagnosis of cystic fibrosis: a
consensus statement. Cystic Fibrosis Foundation Consensus
sweat testing, but it may be a useful test for CF when the
Panel. J Pediatr 1998;132:589 –95.
sweat chloride test does not provide a definitive answer at
17. Knowles MR, Paradiso AM, Boucher RC. In vivo nasal potential
the screening level. Our findings demonstrate that the difference: techniques and protocols for assessing efficacy of
multiplication product of (18:2 n-6) (22:6 n-3) can gene transfer in cystic fibrosis. Hum Gene Ther 1995;6:445–55.
diagnostically differentiate CF from non-CF cases. Larger 18. Wilmott RW. Making the diagnosis of cystic fibrosis. J Pediatr
studies with different CFTR gene variations and more 1998;132:563–5.
7. 7
Clinical Chemistry 53, No. 1, 2007
19. Borowitz D, Baker RD, Stallings V. Consensus report on nutrition 24. Mastella G, Di Cesare G, Borruso A, Menin L, Zanolla L. Reliability
for pediatric patients with cystic fibrosis. J Pediatr Gastroenterol of sweat-testing by the Macroduct collection method combined
Nutr 2002;35:246 –59. with conductivity analysis in comparison with the Gibson and
20. Moser HW, Moser AB. Measurement of saturated very long chain Cooke technique. Acta Paediatr 2000;89:933–7.
fatty acids in plasma. In: Hommes FA, ed. Techniques in Diagnostic 25. Warwick WJ, Hansen LG, Brown IV, Laine WC, Hansen KL. Sweat
Human Biochemical Genetics. New York: Wiley-Liss, 1991:177–91. chloride: quantitative patch for collection and measurement. Clin
21. Dodds ED, McCoy MR, Rea LD, Kennish JM. Gas chromatographic Lab Sci 2001;14:155–9.
quantification of fatty acid methyl esters: flame ionization detec-
26. Cystic Fibrosis Foundation. http://www.cff.org/UploadedFiles/
tion vs. electron impact mass spectrometry. Lipids 2005;40:
publications/files/SweatTestFactSheetLH.pdf (accessed Febru-
419 –28.
ary 2006).
22. Benabdeslam H, Garcia I, Bellon G, Gilly R, Revol A. Biochemical
27. Parad RB. Buccal cell DNA mutation analysis for diagnosis of
assessment of the nutritional status of cystic fibrosis patients
cystic fibrosis in newborns and infants inaccessible to sweat
treated with pancreatic enzyme extracts. Am J Clin Nutr 1998;67:
chloride measurement. Pediatrics 1998;101:851–5.
912– 8.
28. Farrell PM, Koscik RE. Sweat chloride concentrations in infants
23. Gopaul NK, Zacharowski K, Halliwell B, Anggard EE. Evaluation of
homozygous or heterozygous for F508 cystic fibrosis. Pediatrics
the postprandial effects of a fast-food meal on human plasma
F2-isoprostane levels. Free Radic Biol Med 2000;28:806 –14. 1996;97:524 – 8.