SlideShare ist ein Scribd-Unternehmen logo
1 von 28
Downloaden Sie, um offline zu lesen
1
E AT I N G F O R T O M O R R O W
HOW CHINA’S FOOD CHOICES CAN
HELP MITIGATE CLIMATE CHANGE
2
5 T O D O T O D AY
ABOUT 5 TO DO TODAY:
5 To Do Today is a campaign initiated in China to influence
attitudes, motivate behavioral change and create support for
climate action. We believe that individuals can make a significant,
collective impact by modifying daily routines to reduce their
environmental footprint.
Our mission is to minimize the impacts of climate change by urging
individuals to reduce their energy use and overall resource
consumption. The campaign asks all of us to take five simple
actions every day to reduce energy use and consumption. The
current focus is on transportation and food choices.
5 To Do Today is a campaign of WildAid, an organization which
has a proven track record of success in influencing attitudes,
inciting behavioral change, and creating collective support for
action to protect endangered wildlife.
www.5todo.org
CONTACT INFORMATION:
5 To Do Today
333 Pine St. #300		
San Francisco, CA 94104	
Matt Grager
Climate Program Officer
grager@wildaid.org
PROJECT TEAM:
Betty Chong,
Climate Program Officer
Jenny Du,
Climate Program Officer
Matt Grager,
Climate Program Officer
Jaclyn Sherry,
Executive Assistant
Hugo Ugaz,
Graphic Designer
SPECIAL THANKS TO
Avatar Alliance Foundation, Karen Bouris, Brighter Green,
California Environmental Associates, Chatham House, Chinese
Nutrition Society, Climate Nexus, The David and Lucile Packard
Foundation, Amy Dickie, Flora L. Thornton Foundation, Samuel
Lee Gammage, The Grantham Foundation for the Protection of the
Environment, Mia MacDonald, My Plate My Planet, Rachel Potter,
Walter Reid, Maria Wilhelm, Yi Jian.
CONTENTS
EXECUTIVE SUMMARY 3
LIVESTOCK & GREENHOUSE GAS 4
DEMAND FOR MEAT & DAIRY 6
LAND USE ISSUES 8
WATER SUPPLY 10
FOOD SUPPLY 11
RISKS TO HUMAN HEALTH 12
OTHER IMPACTS 14
CLIMATE CHANGE IMPACTS IN CHINA 15
SURVEY FINDINGS 16
DIET FOR A TWO-DEGREE WORLD 18
5 TO DO TODAY & CNS 20
CONSUMER RECOMMENDATIONS 22
CHINA IS READY TO LEAD 23
ENDNOTES & APPENDIX 24
3
E AT I N G F O R T O M O R R O W
EXECUTIVE SUMMARY
WHY EATING LESS MEAT MATTERS:
LIVESTOCK AGRICULTURE CONTRIBUTES 14.5% OF ALL GHG
Many experts predict that keeping global warming below the critical
two degree Celsius threshold is impossible without a significant shift
in diet. 1
Livestock agriculture produces more greenhouse gas (GHG)
than all global transportation combined.2
By 2050, the predicted
increase in meat and dairy consumption would result in a further
80% growth of agriculture-related emissions.3
DEMAND IS RISING FAST
By 2050, rising incomes, growing populations and urbanization are
projected to increase meat consumption by 76% and dairy
consumption by 65%.4
LIVESTOCK AGRICULTURE DRIVES ENVIRONMENTAL CRISES
In addition to GHG emissions, livestock agriculture has significant
environmental impacts, including deforestation, desertification,
soil degradation and pollution, water pollution, ocean warming and
acidification, ocean dead zones, and biodiversity loss. Deforestation
and ocean warming further exacerbate climate change, while
desertification and soil degradation can reduce agricultural output.
LIVESTOCK AGRICULTURE IS UNSUSTAINABLE
The world cannot meet the water and caloric needs of a growing
population if current levels of livestock agriculture are continued.
The practice involves 33% of all freshwater use, 30% of all ice-free
land, 33% of all calories produced, and 50% of all protein, resources
which all may be negatively impacted by climate change.5,6
WE CAN ACT NOW
Unlike reducing GHG emissions from energy or transportation,
which require developing new technologies and building new
infrastructure, reducing emissions from livestock agriculture can be
immediately addressed at the individual level. Simple and direct
steps, such as reducing portion size, eliminating food waste,
substituting lower-carbon meats (e.g. chicken for beef) and
increasing the number of meatless meals consumed can all help
lower emissions.
LOWER EMISSIONS, BETTER HEALTH
The benefits of eating less meat go beyond the climate and
environment – it can also improve your health. High meat
consumption is linked to non-communicable diseases, such as
diabetes, obesity, heart disease and cancer.
WHY CHINA CAN LEAD:
CHINA PLAYS A KEY ROLE
Due to its large population and rapid rates of economic growth,
China is essential to any efforts to curb GHG emissions, especially
from meat consumption, in which it already leads the world. China
consumes 28% of meat and 50% of pork, globally.7,8
Beef
consumption is expected to rise 47% by 2030. Yet China is new to
mass meat consumption. Average per capita meat consumption has
risen six-fold since 1978 to reach 63 kg and could rise another 30
kg by 2030.9
IT HAS INCENTIVE TO ACT
Reducing meat consumption can benefit China from a health,
resource, climate and geopolitical perspective. Over 50% of the
population is suffering from environmental-related illnesses, many
of which are made worse by higher meat consumption, such as heart
disease, obesity, cancer and diabetes. China has 20% of the global
population, but 33% of the world’s diabetics.10
Child obesity has
quadrupled in a single generation. The rising healthcare costs
associated with these emerging crises will be significant.
IT HAS POLITICAL AND PUBLIC WILL
In May 2016, the Chinese Nutrition Society (CNS) issued its most
recent ten-year dietary guidelines, which recommend reducing
meat consumption by over 50%. A 2015 5 To Do Today survey
showed that 83% of middle-class urban residents are willing to eat
vegetarian at least one day each week, with 62% willing to do so at
least two days per week. The survey also showed high awareness of
the health impacts of meat consumption and moderate awareness
of the environmental impacts.
AN OPPORTUNITY TO LEAD THE WORLD
Were the CNS dietary recommendations to be adopted nationally,
emissions from meat consumption in China would decrease by an
amount equal to 1.5% of global emissions or 6% of Chinese emissions.
Without a dietary shift, emissions from meat consumption in China
would rise over 50% by 2030 to equal more GHG than the 2012
national emissions of every country except China, the United States,
India and Russia.
4
5 T O D O T O D AY
As the main driver of climate change,
greenhouse gas (GHG) emissions are
typically associated with fossil fuels used
for energy, transportation or industry.
Greenhouse gases such as carbon dioxide,
methane and nitrous oxide trap heat in the
Earth’s atmosphere, thus raising the
temperature of the planet. Though each of
these gases traps heat at different rates,
they are all calculated in their equivalent
amount of carbon dioxide, known as the
carbon equivalent (CO2eq). For example,
methane and nitrous oxide, two GHGs
emitted during the livestock agriculture
process, are 25 and 298 times more
p o w e r f u l t h a n c a r b o n d i o x i d e ,
respectively.11
Many people will be surprised to learn that
burning fossil fuels is not the only major
source of GHGs. Emissions from livestock
are calculated to be at least 14.5% of the
global total.12,13
That is greater emissions
than all of global transportation – more
than every car, truck, train, plane and ship
on Earth combined.
Animal feed production and the land-use
change required for it accounts for 30% of
all livestock emissions.14
The largest source
(39%) is from enteric fermentation–the
gaseous releases of cows and sheep.
Per unit of protein, beef, pork, and chicken
emit 150, 25, and 20 times the GHG of
soybeans.15
Because livestock emissions
come mainly from large ruminant animals,
the 60 billion chickens each year contribute
only 10% of livestock emissions while the
1.4 billion cows contribute 66%.16
In
addition to being less flatulent than cows
or sheep, chickens convert feed more
efficiently and use less land, both of which
reduce their overall emissions.
LIVESTOCK & GREENHOUSE GAS
FIG. 1: GHG EMISSIONS FROM LIVESTOCK
Source: Gerber, et. al. “Tackling Climate Change Through Livestock,” 2013
5%
ENERGY USE
6%
PASTURE
24%
FEED CROPS
26%
MANURE
39%
ENTERIC
FERMENTATION
“THE GHG
CONTRIBUTIONS FROM
LIVESTOCK ARE
GREATER THAN
EVERY CAR, TRUCK,
TRAIN, PLANE AND
SHIP ON EARTH
COMBINED.”
5
E AT I N G F O R T O M O R R O W
A single factory farm with 1,000 head of cattle produces waste equivalent to a city of 164,500
people. 17
In 2011, there were 1.4 billion cows on Earth.18
Photo: Alamy
MEAT ALONE CAN BUST THE
CARBON BUDGET
Governments and experts, including the
Intergovernmental Panel on Climate
Change, have determined that the worst
impacts of climate change are likely to be
avoided if warming is stopped below two
degrees Celsius above 19th century levels.
Reducing emissions from our meat and
dairy consumption is important not only
because it represents a significant
proportion of total emissions, but also
because of how little GHG we can emit in
the future while keeping warming below
this limit. As it stands now, the world has
already warmed a full one degree Celsius.19
In order to understand how much GHG
can be released and still stay below two
degrees, the carbon budget was created. In
order to have a likely chance (>66%) of
staying below two degrees warming, the
world can emit only 870 gigatonnes of
CO2eq (GtCO2eq) between 2009 and
2100.20
With current annual global
emissions hovering around 50 GtCO2eq,
the world will push past the two-degree
threshold by 2030 without significant
changes. One expert, Dr. Richard
Oppenlander, goes so far as to say that
even if livestock were the only source of
GHG emissions, we would exceed the
carbon budget as early as the 2030s.21
While many people understand the
importance of transitioning away from
fossil fuels for energy production or
transportation, few publicly suggest a
similar shift away from meat consumption
despite its annual contribution of at least 7
GtCo2eq.22
Compared to reducing the same
amount from transportation, energy or
industry, reducing emissions from
a g r i c u l t u r e r e q u i r e s l i t t l e n e w
infrastructure or technology. It could be
accomplished immediately with a
worldwide decision to shift away from
meat consumption. For more information
on mitigation scenarios in agriculture
please see page 26.
*Soybean calculation reflects a no-tillage cultivation in moderately degraded savannah.
FIG. 2: GHG EMISSIONS PER KG OF MEAT(KGCO2EQ)
Source: Chatham House “Changing Climate, Changing Diets,” 2015
10
20
BEEF
56.6
31.3
8.8 7 3.9 2.6 5*
PORK EGGS CATTLE
MILK
SOYBEANLAMB CHICKEN
30
40
50
60
70
80
0
6
5 T O D O T O D AY
Due to the growing population, rising
incomes and urbanization, meat and dairy
consumption are increasing around the
globe. By 2050, meat and dairy consumption
are expected to rise by 76 and 65%
respectively,23
contributing to an 80%
increase in agricultural emissions.24
These
emissions, plus the requirements for large
amounts of land, water and crops to raise
livestock, makes the growth of meat
consumption unsustainable.
This increase is happening fastest in
developing countries as a part of a larger
trend known as the nutrition transition.
Meat consumption in western countries
remains higher per capita, but has mostly
plateaued or even declined slightly.25
The
nutrition transition occurs because rising
incomes allow developing countries to afford
higher-priced food, which often includes less
whole foods and more food prepared outside
the home. Urbanization combined with
global trade also makes Western-style diets
more common, as they are better marketed
and cheaper than ever before.
Due to the combination of high population
and increasing per capita consumption,
China will be the largest source of
increased demand. It currently consumes
twice the amount of the second place
United States and is projected to triple the
US total by 2030. Even Brazil, where per
capita consumption doubled from 40 kg to
over 80 kg since 1980, represents only a
small fraction of the total demand in
China.26
Increased demand for livestock is not new.
Over the fifty years between 1960 and 2010,
global meat production rose from 150
million tonnes to 300 million tonnes, while
average consumption quadrupled from
10kg to over 40kg.27
In order to meet rising
demand for livestock products, the world
has had to produce more crops by
DEMAND FOR MEAT & DAIRY
10,000
20,000
2010 2014 2018 2022 2026 2030
30,000
40,000
50,000
60,000
70,000
90,000
100,000
110,000
120,000
130,000
80,000
0
FIG. 3: ANNUAL MEAT & DAIRY CONSUMPTION BY COUNTRY (1,000S OF TONNES)
Source: California Environmental Associates, “Dietary Trends in Asia,” 2013
CHINA
UNITED STATES
BRAZIL
INDIA
“CHINA WILL BE THE
LARGEST SOURCE OF
INCREASED DEMAND.
IT CURRENTLY
CONSUMES TWICE
THE AMOUNT OF THE
SECOND PLACE
US AND IS PROJECTED
TRIPLE THE US TOTAL
BY 2030.”
7
E AT I N G F O R T O M O R R O W
increasing yields per hectare and cultivating
more land, neither of which will be feasible
in the near future. The Green Revolution
increased yields in the 1960-80s by creating
and mainstreaming genetically modified
crops, pesticides and chemical fertilizers,
while deforestation made the necessary
farmland available. Further deforestation
will cost the planet vital carbon sinks and
storage, while additional chemical inputs
could degrade critical topsoil that is already
overstressed in addition to contributing its
own GHG emissions.
MEAT CONSUMPTION IN CHINA
Since 1978, the average annual income in
China has grown from $200 to $6,000.29
The average Chinese consumer now eats
63kg per year,30
six times as much as in
1978,31
and consumption is predicted to
rise an additional 30 kg by 2030.32
This
growth is happening four times faster than
the next fastest-growing consumer, Brazil.
China now consumes 28% of the world’s
meat and dairy products and half of its
pork.33
The predicted rise in per capita
consumption would be the equivalent of
adding another United States to total
global demand for meat and dairy products
by 2030.34
The study that predicts a 30 kg increase
also predicts that beef consumption will
make up 10% of that rise, from 5 kg per year
per person in 2010 to 8 kg in 2030.35
This
rise would mean an additional 233
megatonnes (MtCO2eq) in GHG emissions
annually. The predicted 20 kg rise in pork
consumption by 2030 would add an
estimated 244 MtCO2eq to annual GHG
emissions.36
Out of three recent projections
for per capita demand for meat in China in
2030, two would result in an increase in
GHG emissions from meat consumption of
over 50%. For more information on GHGs
from meat consumption in China see page
26.
In 1992, the first McDonalds to opened in Beijing. Today, there more than 2,000 McDonalds locations across China. 28
Photo: Alamy
8
5 T O D O T O D AY
LAND USE ISSUES
With demand for meat and dairy set to rise
by 76 and 65%, what will it take in terms of
land, crops and water to meet the demand
for livestock of 9.7 billion people in 2050
and 11.2 billion by 2100?37
Whether looking at land, water and crops
individually or as an ecosystem it is clear
that there will not be enough resources to
meet the growing demand for livestock
agriculture if feeding the growing population
is also to be achieved.
As with the crop and water inputs, more land
is required to produce beef than any other
meat, at 30 square meters per kilo. Both
chicken and pork require approximately 20
square meters, still much higher than soy,
fruits, potatoes and vegetables, which
require less than two square meters.38
In
aggregate, the large land use requirements
for livestock presents many challenges,
especially as demand for meat and dairy
grows.
Livestock agriculture uses 70% of all
agricultural land and 30% of all the ice-
free land on Earth.39
If the entire global
population were to eat the average North
American diet, the resulting tripling of
animal-based protein consumption would
require at minimum a doubling of
cropland.40
By 2050 an area of forests the
size of India will have been purposefully
deforested mainly for agriculture, releasing
over 100 GtCO2eq, or one-sixth of the
planet’s remaining carbon budget.41
LAND USE ISSUES IN CHINA:
•	 China has 20% of the world’s
population but only 7% of its arable
land.42
•	 Each year, 400 million people in China
are affected by desertification, which
caused 24,000 towns and villages to
vanish between 1950 and 2000.43
•	 In 2008, an official survey estimated
that China was losing 4.5 billion tons
FIG. 4: LAND NEEDED FOR PRODUCTION OF 1 KG FOOD (SQUARE METERS)
Source: Okologie + Landbau 159, 3/2011, p40–42 www.soel.de
5
10
BEEF PORK EGGSCHICKEN
15
20
25
30
35
0
FRUITS VEGETABLES
of topsoil annually due to wind and water erosion, or five times as much as was lost
annually during the US dustbowl of the 1930s.44
China now has half the arable land
per person compared with 50 years ago.
•	 As China has run out of arable land to grow feed at home, it has begun buying and
leasing farmland overseas. In 2012, the International Institute for Sustainable
Development reported that it identified 54 Chinese overseas agricultural projects
totalling over 18,000 square miles–an area 40% larger than Taiwan–in countries
ranging from Ukraine to Zimbabwe.45
DEFORESTATION
Livestock agriculture contributes to deforestation in three ways. First, forests are often
cleared for grazing. This is the number one cause of deforestation in nearly every Amazon
country, and accounts for at least 70% of Amazon forest loss.46
Second, forests must be
cleared to grow crops, mainly soy, used to feed livestock. Lastly, by causing general climate
change, the GHG emissions from livestock accelerate forest loss already underway.
Livestock agriculture has had a significant impact on the world’s forests, particularly in
Central and South America. In the past 40 years, over 40% of Central American forests
have been cut down and an area of rainforest twenty times larger than Taiwan has been
cleared from the Amazon, predominantly for livestock and its feed.47
A further seven
football fields worth of land is cleared every minute to make room for livestock.48
9
E AT I N G F O R T O M O R R O W
FIG. 5: CAUSES OF DEFORESTATION IN THE BRAZILIAN AMAZON 2000-2005
Source: H.K. Gibbs, 2009
“BY 2050 AN AREA OF
FORESTS THE
SIZE OF INDIA WILL
HAVE BEEN
PURPOSEFULLY
DEFORESTED MAINLY
FOR AGRICULTURE.”
A soy plantation intrudes into the Brazilian Amazon rainforest. Chinese imports account for 64% of the global soy trade
and grew 253% between 2003 and 2012. Soybean meal, an ingredient in animal feed represents nearly 80% of Chinese
soy imports.49
Photo: Alamy
LAND DEGRADATION
Livestock agriculture contributes to other
forms of land degradation, including desert-
ification and soil degradation, which reduce
the available space and nutrients needed for
growing food.
Each year, 20 million acres of arable land
are lost to desertification, 35 times the
historical rate.50
Livestock agriculture is
responsible for about one-third of this
total loss, or an area only slightly smaller
than Hainan Island. In that last 40 years,
nearly one-third of the world’s arable land
has been lost, and 25% of the Earth’s total
land area is now either highly degraded or
currently undergoing high rates of
degradation.51
The land lost to desertification and
degradation directly diminishes a key
resource for food production. Total land
lost to degradation dating back to only
1995 would be sufficient to feed the current
global population a plant-based diet year-
round.52, 53
65–70%
CATTLING
RANCHING
20–25%
SMALL-SCALE
AGRICULTURE
5–10%
LARGE-SCALE
AGRICULTURE
2–3%
LOGGING
1–2%
OTHER
1 0
5 T O D O T O D AY
WATER SUPPLY
In total, one-third of all freshwater used globally is for animal
agriculture.54
Agriculture overall is responsible for 70% of all
freshwater use and 93% of global water depletion. By 2030
humanity’s annual global water requirements will rise by 50% and
exceed sustainable water supplies by 40%.55, 56
The meat and dairy
we put on our plate are inextricably linked with the exploitation of
this resource.
As with all other inputs, water usage varies depending on the type
of livestock. Switching from beef, the largest user at over 15,000
liters of water per kilogram of meat, to any other type of meat does
more for the planet than switching from any other type of meat to
plant-based proteins. Compared to cereals, beef, pork and chicken
use 9, 4 and 3 times as much water per kilogram.57
The World Bank predicts that 2.8 billion people will live in regions
with absolute water scarcity by 2025.58
Yields from rainfed
agriculture, which supplies 60% of the world’s food,59
are predicted
to be down by 50% as early as 2020 due to climate change.60
Up to one third of the world’s largest aquifers are already being
drained faster than they are replenished, most of them concentrated
in food producing regions that support over 25% of the planet.61
The food sector is responsible for about half of all organic water
pollutants. In developing countries, up to 90% of waste water,
including that which results from agriculture, flows untreated into
oceans, lakes, rivers and streams.62
WATER ISSUES IN CHINA
•	 China irrigates over half its farmland, five times as much as
the US.63
Agriculture uses more than 60% of water in China.
Official government estimates say that 55% of this water is lost
through leakage in the system, meaning as much as 33% of all
China’s water is wasted through leakage in an inefficient
agricultural system.64
Many major cities in China, including
Beijing, which has experienced 31 consecutive years of drought,
are suffering from rapidly falling water tables and subsidence.65
•	 China has less than one-third the global average of per capita
water resources.66
•	 One-third of all major rivers and 60% of all groundwater are
polluted, which has resulted in 300 million people drinking
contaminated water and almost 200 million suffering from
water-related illnesses annually between 2007 and 2012.67
•	 Agriculture is responsible for 42% of water pollution in China,
and 67% of both nitrogen and phosphorous discharge,
pointing to over-use of fertilizer and pesticides as well as poor
manure management practices.68
FIG. 6: LITERS OF WATER PER KG OF MEAT
Source: Institution of Mechanical Engineers
CHICKEN CHEESEBEEF SHEEP PORK BUTTER
15,400 10,400 6,000 5,500 4,300 3,200
A farmer tills a drought affected field in Shanxi Province, China. In 2010, agriculture
used 61% of all freshwater in the country.69
Photo: Alamy
FIG. 7: WATER USE BY SECTOR IN CHINA 2010
Source: National Bureau of Statistics, China
61%
AGRICULTURE
2%
OTHER
24%
INDUSTRY
13%
MUNICIPAL
1 1
E AT I N G F O R T O M O R R O W
FOOD SUPPLY
Currently, 25% of all crops, 33% of all calories and 50% of all protein
globally go to feed livestock. 70
Livestock animals consume 40-50%
of global corn production and 80% of soy.71
By 2050, as much as
50% of crops will be fed to livestock while climate change threatens
to reduce yields by between 13 and 50% in the same time frame. 72
In the context of world hunger and food security, grains fed to
livestock are misallocated. 82% of undernourished people live in
countries that export livestock or export crops for livestock feed.73
In 2013, scientists from the University of Minnesota concluded
that if all food crops were fed directly to humans rather than
livestock, 70% more food could be added to the global supply. This
supply would be enough to feed an additional four billion people
- the same number of people the UN estimates will be added to the
global population by 2100.74
The world currently produces enough crops to provide every person
with a daily diet of 2,700 calories.75
CROP ISSUES IN CHINA
FIG. 8: GRAIN REQUIRED FOR 1 KG OF MEAT
Source: USDA
1KG CHICKEN = 2.3KG
1KG: PORK = 5.9KG
1KG: BEEF = 13KG
1KG: LAMB = 21KG
MILLIONTONS
FIG. 9: SOYBEAN PRODUCTION, CONSUMPTION, AND IMPORTS IN CHINA, 1974-2011
Source: USDA
10
20
20041974 1984 1994
30
40
50
60
70
90
80
0
CONSUMPTION
IMPORTS
PRODUCTION
•	 In 2011, China used approximately 70% of its total corn
production for livestock feed and only 5% for food.76
•	 China will have a deficit of 19-32 million tons of corn by 2022,
requiring imports approximately equal to a third of the entire
world corn trade today.77
•	 China will account for 40% of the growth in agricultural
imports between now and 2050.78
•	 Only 12% of total cereals are traded on the global market, of
which China is the largest buyer. Total soy imports increased
by 253% from 2003-2012, making China the largest importer
of soy, with purchases on the global market 5 times larger
than the next largest importer, the EU.79
1 2
5 T O D O T O D AY
Meat plays a central role in most traditional
and modern food cultures, and consumption
continues to grow in many developing coun-
tries. With that growth comes a number of
related health issues. Risks of cardiovascular
disease, obesity, diabetes and cancer all in-
crease with higher levels of meat consump-
tion. Dr. Frank Hu of Harvard University
School of Public Health wrote that there is
“clear evidence that regular consumption of
red meat, especially processed meat, contrib-
utes substantially to premature death.”80
On average, vegetarian men live 9.5 years
longer than male meat-eaters, and women
6.1 years longer.81
Vegetarians have also
been shown to be 32% less likely to develop
heart disease, 40% less likely to develop
cancer, have a lower risk of diabetes and
have a lower body mass index (BMI). 82
The
lower BMI is not attributable to eating less
overall, as a 2010 study showed that even
between people who consume the same
amount of calories, the meat consumer will
gain an additional 2kg over five years
compared to the vegetarian.83
This helps
explain why on average adult vegans are 4.5
to 9 kg lighter than adult meat-eaters.84
HEALTH IMPACTS IN CHINA
As meat consumption grows in China, so
too do the related health problems.
According to the Chinese Nutrition Society,
the biggest health problems in China are
obesity, diabetes, hypertension, high salt
intake, and nutrient deficiency. In 2010,
85% of deaths in China were the result of
non-communicable diseases,85
including
many of those listed above. Globally, the
average is 60%. Many of these diseases,
such as high blood pressure, heart disease,
diabetes and several forms of cancer are
linked with the over consumption of meat.
China is home to over 100 million diabetic
patients, more than any other country. In
the adult population, 11% suffer from
RISKS TO HUMAN HEALTH
FIG. 10: OVERWEIGHT POPULATION IN CHINA
Source: University of Washington, Institute of Health Metrics and Evaluation
5%
10%
BOYS WOMEN MEN
15%
20%
25%
30%
0
GIRLS
2013
1980
“LIKE THEIR AMERICAN
COUNTERPARTS, MORE
PROCESSED FOOD,
MORE MEAT, MORE
OILS, FATS AND
SUGARS ARE MAKING
CHINESE CHILDREN
DANGEROUSLY
OVERWEIGHT.”
1 3
E AT I N G F O R T O M O R R O W
Non-communicable diseases such as diabetes, cancer, hypertension and obesity cause 85% of deaths in China, 25
percentage points higher than the global average.85
Photo: World Health Organization
diabetes, while another 50% are pre-
diabetic, putting them at increased risk for
cardiovascular disease, kidney disease and
cancer.86
As a result, the percentage of
national healthcare expenses used to treat
diabetes in China rose from 1.96% in 1983
to 18.2% in 2007.87
The average Chinese person is now 8 to 15
kg heavier than a generation ago.88
Obesity
is defined as a BMI of over 30, while
overweight falls between 25 and 30. China
is now home to the second most obese
individuals after the US, which has 62
million.89
Meat consumption can also combine with
environmental factors to undermine
human health. In China, at least half of the
population is suffering from chronic and
environmental related illnesses while 200
million more are directly exposed to
occupational hazards.90
Like their American counterparts, more
processed food, more meat, more oils, fats
and sugars are making Chinese children
dangerously overweight. In Beijing,
Chongqing and Shanghai, children now
consume nearly 30% of their calories from
processed packaged foods.91
Between 1980
and 2013 the rate of children that are
overweight quadrupled to 20% and the
rate of pre-diabetic children rose to 15%.92
Chinese adolescents now have a diabetes
rate three times that of their US peers.93
Partly due to the growth in childhood
obesity, China could be home to 800
million overweight or obese citizens by
2030.94
“ON AVERAGE,
VEGETARIAN MEN LIVE
9.5 YEARS LONGER
THAN MALE MEAT-
EATERS, AND WOMEN
6.1 YEARS LONGER.”
1 4
5 T O D O T O D AY
OTHER IMPACTS OF LIVESTOCK
OCEAN DEAD ZONES
Modern livestock agriculture has not only
transformed the terrestrial landscape, it is
also rapidly changing our oceans. In addition
to the problem of overfishing, the planet’s
marine ecosystems are coping with acidifi-
cation and a growing number of dead zones,
the primary cause of which is nitrogen and
phosphorous from agricultural runoff.96
Dead zones have doubled in frequency every
10 years since the 1960s and now number
more than 400 worldwide, including a
5,000 square mile dead zone in the Gulf of
Mexico caused by agricultural and industrial
runoff from the Mississippi River; and, a
145,000 square mile dead zone in the Baltic
Sea.97
China’s Bohai Sea is also considered a
dead zone. Despite the fact that 20% of the
nations sewage is dumped there, its main
pollutant source is runoff from fertilizer. 98
In total, ocean dead zones now cover over
1.7 million square miles,99
or an area the
size of South Asia, including Bangladesh,
India, Nepal, Pakistan and Sri Lanka.
BIODIVERSITY LOSS
Over the 3.5 billion year history of life on
Earth, there have been five major extinction
events in which the variety and number of
living species have dropped dramatically,
up to 90%. Scientists now agree that the
planet is currently in the middle of the sixth
major extinction event, and tellingly, that
humans are its cause.
Scientists call this the Anthropocene, the
epoch where humans have wielded the
power to alter the environment on Earth
significantly. Humans have transformed
the landscape, added GHG and pollutants
to the air, changed weather patterns, and
increased the temperature and sea level. In
this process, we increased the rate of
The Bohai Sea in Northern China, once known as the “Emperor’s Fishery,” is now considered the most
polluted waterway in China. 95
Photo: European Space Agency.
1 5
E AT I N G F O R T O M O R R O W
An endangered golden snub-nosed monkey bares its teeth in the Qinling Mountains of China. It is estimated that only
3,000 of the species remain due to habitat loss, including deforestation. Photo: Alamy
CLIMATE CHANGE IMPACTS IN CHINA
The combination of a large population
concentrated on the coast, a relative lack
of arable land and persistent water issues
make China particularly vulnerable to
climate change, especially as it relates to
food security. China’s own National
Development and Reform Commission
acknowledged the following in a
December 2013 Report:
“Our country is a developing nation with
a large population, complex climate
conditions and a weak environment
(situation). The mission to deal with
climate change is very arduous, but
knowledge in society and ability to do
this are weak across the board.”105
Zheng Guoguang, director of China’s
meteorological administration, reported
in early 2015 that among the most
pressing climate related issues in China
will be food insecurity, extreme weather,
cities at risk of submersion, and the
spread of illnesses, including dengue
fever and malaria.
Other climate change impacts
in China include:
•	 Approximately 85 million people in
China currently live on land that will
be submerged or chronically flooded
by 2100. 106
Due to urbanization, the
population growth of coastal cities is
occurring three times the national
rate and could reach between 200
and 245 million by 2060.107
•	 By 2050, 40 to 200 million people
could be internally displaced within
China due to climate change. 108
•	 Temperatures on the Tibetan Plateau
are rising at a rate over four times
faster than the global average,
partially due to its arid elevation and
partially due to the loss of reflectivity
from rapidly melting glaciers, which
are expected to be 50% depleted by
2100. The 1.5 billion people who
receive their water supply from these
glaciers will increase to 2.2 billion by
mid-century. 109
In the short term
this glacial melt will increase the
outflow of some of the world’s major
rivers, including the Yangtze and
Yellow rivers in China, the
Brahmaputra, Ganges and Indus in
India, and the Irrawaddy and
Mekong in Southeast Asia, until
approximately 2050. However,
combined with more unpredictable
monsoon seasons, an increase in
glacial melt will likely result in
substantial flooding rather than
alleviating water shortages.
•	 Globally, climate change will
increase the frequency, severity and
unpredictability of natural disasters
that include floods, droughts and
storms. Recent experiences can be
expected to continue in China where
the number of natural disasters from
2000-2014 rose 57% from the
previous 15-year period. 110
extinction to between 1,000 and 10,000
times its predicted level without human
interference (the background rate).100
This
is the largest extinction event since a
meteor wiped out the dinosaurs 65 million
years ago and continues to exterminate 137
species every day.101
Habitat destruction from grazing livestock
and feed crops impacts 86% of threatened
mammals, 88% of amphibians and 86% of
all birds.102
Further estimates are that one
in eight birds, one in four mammals and
one in three amphibians are facing an
extremely high risk of extinction in the
near future.103
According to the Alliance
for Global Conservation, 36% of all species
on Earth are now threatened with
extinction.104
Livestock agriculture also
contributes to biodiversity loss in other
ways, including the hunting of predator
species, such as wolves or jaguars, to
protect livestock and the use of pesticides,
herbicides and chemical fertilizers that
pollute the environment, interfere with
animal reproduction and poison
waterways.
1 6
5 T O D O T O D AY
SURVEY FINDINGS	
FIG. 11: FACTORS CONSIDERED IN FOOD CHOICES
FINDINGS: DECISION-MAKING
NUTRITION TASTE FOOD SAFETY IN-SEASONPRICE GMOORGANIC LOCATION
60
40
20
0
43.4%
15.7%
29%
2.1% 0.6%1.2%6% 1.5%
FINDINGS: IMPACT AWARENESS
88.1
59.7
67
49.8
39.5 36.7 35.6 35.6
54
50 48 49
63
86
HEALTH CROP & LAND
RESOURCES
WATER
RESOURCES
MITIGATING
CLIMATE CHANGE
GHG EMISSIONS DEFORESTATION OCEAN DEAD ZONES,
HABITAT LOSS,
SPECIES EXTINCTION
FIG. 12: PERCENTAGE OF RESPONDENTS AWARE OF THE IMPACT OF LIVESTOCK
ON THE FOLLOWING ISSUES:
100
80
60
40
20
0
OFFLINE
ONLINE
AWARENESS, ATTITUDES & HABITS IN CHINA:
In December 2015, 5 To Do Today commissioned Ipsos to conduct
a direct interview 700-person survey across 11 Tier 1 and Tier 2
cities in China, and Intage to conduct a broader online survey of
5,000 people across 13 Tier 1, Tier 2 and Tier 3 cities.
KEY FINDINGS:
•	 98% of survey respondents had eaten meat in the last month.
95.3% had eaten eggs, while 87.2% had consumed dairy products.
•	 Online, 6% reported being vegetarian. Of the non-vegetarians,
64% considered their meat consumption to be at “normal levels.”
•	 19.2% of men and 13.7% of women dined out more often than
they dined at home. Younger people reported dining out more
often than older ones.
•	 Beef and lamb are more likely to be eaten by men than by women
and more likely to be eaten at home than while dining out.
•	 78.6% report consuming 1 kg of beef or less each week. 75.1%
report consuming 1 kg of lamb or less per week.
•	 Nutrition, taste, and food safety were the highest ranked
factors in food choice.
•	 88.1% of respondents were aware of the negative health
impacts of eating meat.
•	 Based on health, environment or resource factors, 83.7% were
willing to adopt a vegetarian diet for at least one day each
week. 62.4% were willing to do so two or more days each week.
•	 22.4% were unwilling to reduce beef or lamb consumption
based on the belief that it would be bad for their personal
health or nutrition. Men were twice as likely to refuse to reduce
consumption as women.
1 7
E AT I N G F O R T O M O R R O W
Employees line up for lunch at the Huawei cafeteria in Hong Kong. Photo: Alex Hofford
HEALTH
FIG. 14: WHY PEOPLE REFUSE TO EAT LESS BEEF AND/OR LAMB
FIG. 13: WHY PEOPLE ARE WILLING TO EAT LESS BEEF AND/OR LAMB
BAD
NUTRITION
CLIMATE
CHANGE
MEAT
LOVER
ANIMAL
WELFARE
BAD FOR
HEALTH
REDUCE
FOOD COST
NO CLIMATE
CHANGE
FASHIONABLE
LIFESTYLE
81.9%
34.5%
45.2%
30.5%
38.9%
28.8%
24%
23.5%
4.15%
4.15%
64.6%: YES
35.4%: NO
FIG. 15: WILLINGNESS TO REDUCE BEEF AND
LAMB CONSUMPTION
64.6%
35.4%
FINDINGS: MOTIVATIONS FINDINGS: BEHAVIOR CHANGE
1 8
5 T O D O T O D AY
Protesters in Britain demand climate action. Photo:
Garry Knight (creative commons).
Halting global warming below the critical
threshold of two degrees Celsius will
require a dramatic decrease in GHG
emissions from all sectors. For a 66%
chance of achieving this goal, we will need
to reduce annual emissions by 30% by
2030, and 60% by 2050. This effort is
complicated by the addition of two billion
more people by 2050. More dramatic
reductions in the short term will ease the
cost and pain of long-term reductions. The
sooner we act, the less dramatic the action
need be.
In late 2015 two key analyses were released
regarding the potential to mitigate climate
change by changing what we eat. Both
studies found that reaching the two degree
Celsius goal may be impoosible without
dietary change. The studies found:
•	 “Immediate and substantial reduction
in wasted food and meat and dairy
intake, particularly ruminant meat
(e.g., beef and lamb), are imperative to
mitigating catastrophic climate
change.”111
DIET FOR A TWO DEGREE WORLD
5
10
ADOPTION OF HEALTHY DIET
15
20
25
30
35
0
FIG. 16: POTENTIAL GHG REDUCTIONS THROUGH GLOBAL DIETARY CHANGE
75% CUT IN MEAT CONSUMPTION 50% CUT IN FOOD WASTE HEALTHY LOW-MEAT DIET + 50%
FOOD WASTE CUT + AG YIELD GAINS
GHG EMISSIONS SAVINGS IN 2050 (GTCO2EQ)
GHG SAVINGS AS % OF 2012 GLOBAL EMISSIONS
1 9
E AT I N G F O R T O M O R R O W
•	 “Left unchecked, current dietary
patterns are incompatible with a two-
degree pathway. If we are to avoid
dangerous climate change, global yearly
emissions must fall rapidly from today’s
levels of 49 GtCO2e to around 23
GtCO2e by 2050. If meat and dairy
consumption continues to rise at
current rates, the agricultural sector
alone will soak up 20 of the 23 GtCO2e
yearly limit in 2050, leaving just 3
GtCO2e for the rest of the global
economy.”112
•	 “Emissions...must be kept at or below
[21 GtCO2eq] per year by 2050... Under
the business-as-usual scenario... the
emissions from agriculture alone would
nearly reach this emissions threshold in
2050.”111
•	 “Global adoption of a healthy diet
would see a yearly emissions saving of 6
GtCO2e in 2050, almost all of which
would result from reduced consumption
of meat and dairy produce.”112
•	 “A global reduction in meat and dairy
intake by 75% by 2050 could reduce
emissions by 7.4 GtCo2e, an amount
greater than the emissions from the
entire transportation sector in 2010...
Smaller reductions in meat intake will
likely not be enough to avoid 2°C.”111
•	 “Halving global wasted food could
reduce emissions by an estimated 4.5
GtCO2e. This is greater than reductions
associated with technological
interventions such as increasing
agricultural yields and technical
mitigation.”111
•	 “Keeping global warming below 2°C
will more than likely require reduction
in both meat and dairy intake and
wasted food, combined with rapid and
dramatic reductions across non-
agricultural sectors. The combined
effect of adopting a healthy, low-meat
diet, reducing wasted food by 50% and
increasing agricultural yields could
reduce agriculture related emissions by
14.3 GtCO2eq by 2050.”111
	
“WORLDWIDE
ADOPTION
OF A HEALTHY DIET
WOULD GENERATE
OVER A QUARTER
OF THE EMISSION
REDUCTIONS NEEDED
BY 2050.”
—CHATHAM HOUSE, “CHANGING
CLIMATE, CHANGING DIETS,” 2015
Image Above: World leaders, including General Secretary of the United Nations Ban Ki Moon, celebrate
the signing of the Paris Climate Agreement in December 2015. The agreement states that nations will set
the goal of keeping global warming “well-below two degrees Celsius.” Photo: Alamy.
2 0
5 T O D O T O D AY
5 TO DO TODAY & THE
CHINESE NUTRITION SOCIETY
BILLBOARD COLLABORATION
In addition to making recommendations for mitigating climate change through diet, both
Johns Hopkins and Chatham House have recommended key steps to catalyzing the
necessary change. Both institutions suggest actions by governments and NGOs to influence
the public. Chatham House notes that “government inaction signals to publics that the
issue is unimportant or undeserving of concern.”113
While Johns Hopkins suggests
“leveraging behavior change campaigns aimed at reducing demand for livestock
production.”114
5 To Do Today has partnered with the Chinese Nutrition Society to help promote its latest
recommended dietary guidelines, released in May 2016. The guidelines are created in
partnership with China’s Ministry of Health and are released every 10 years. The latest
recommendations include a reduction in meat consumption of over 50% compared to
current levels and over 70% compared to projected consumption in 2030. CNS recommends
consuming between 40 and 75 grams per day of meat or between 14.6 and 27.4 kg per year.
5 To Do Today has produced posters and billboards featuring celebrity ambassadors to
disseminate key nutrition messages to all provinces and autonomous regions of China.
New dietary guidelines released by the Chinese Nutrition
Society in May 2016 recommend a 50% reduction in
meat consumption, from current levels of 63 kg annually
to a maximum of 27.4 kg. 5 To Do Today has partnered
with CNS to disseminate key messages (billboard above)
about nutrition to every province and autonomous region
of China.
2 1
E AT I N G F O R T O M O R R O W
DAILY RECOMMENDATION (G) ANNUAL RECOMMENDATION (KG)
GRAIN 250 –400 91.25 – 146
VEGETABLES 300 – 500 109.5 – 182.5
FRUIT 200 – 350 73 – 127.75
SEAFOOD 40 – 75 14.6 – 27.4
MEAT 40 – 75 14.6 – 27.4
EGGS 40 – 50 14.6 – 18.3
DAIRY 300 109.5
BEANS 25 – 35 9.1 – 12.8
OIL 20 – 30 7.3 – 11
SALT 0 – 5 0 – 1.8
CNS DIETARY GUIDELINES 2016POTENTIAL FOR EMISSIONS
REDUCTIONS
Without intervention, GHG emissions from
Chinese meat consumption would rise by
over 50% to total over 1.8 GtCO2eq in 2030,
greater than the current emissions of all but
four countries (China, US, India and
Russia). To establish the potential for GHG
emissions reductions through adoption of
the CNS recommended levels of meat
consumption, 5 To Do Today examined the
following two scenarios:
2015:
In 2015, the nationwide adoption of the
CNS recommended levels of meat
consumption could have lowered emissions
from Chinese meat consumption by 675
MtCO2eq, or 56%. Equivalent to:
•	 Reducing emissions from agriculture
in China by 81%
•	 Reducing global agriculture emissions
by over 12%
•	 Reducing total Chinese emissions by
over 6%
•	 Reducing total global emissions by
over 1.5%
2030:
By 2030, CNS guidelines could achieve
reductions in emissions from Chinese meat
consumption of 1.27 GtCO2eq, or 70.8%
lower than projections. Equivalent to:
•	 Reducing global agriculture emissions
by over 22%.
•	 Reducing total Chinese emissions by
over 9.5%.
•	 Switching to the CNS recommended
levels of meat consumption could
account for 8.5% of the global
reductions necessary to stay on the
pathway to two degrees, which
requires emissions are lowered to
approximately 35 GtCO2eq annually
by 2030.
For full analysis see page 26.
1000
2000
800
1800
600
1600
400
1400
200
1200
0
2015 2030
1191.58
1804.53
516.48 526.98
FIG. 17: GHGS FROM MEAT CONSUMPTION IN CHINA (MTCO2EQ)
CURRENT
CNS
PROJECTED
CNS
2 2
5 T O D O T O D AY
EAT LESS MEAT
While choosing vegan or vegetarian diets
will do the most to reduce GHG emissions,
every bit counts. If cutting out meat com-
pletely is not possible, choosing a diet based
on the Harvard Healthy Eating Plate will
reduce GHG contributions from food to the
same level as a vegetarian diet while still
allowing for limited meat consumption. The
Livewell Plate would also significantly
reduce GHG emission from food and is one
of the only diets that takes GHG into its
calculations. Even eating one or two more
meatless meals per week can help improve
health and reduce environmental impacts.
EAT LESS BEEF AND LAMB
Rumination contributes 40% of global live-
stock emissions and with a thirst for water
over 20 times that of tofu, beef and lamb
are by far the least efficient and most dam-
aging sources of protein.
REDUCE FOOD WASTE
Cutting portion size and cleaning your plate
whether at a restaurant or at home is the
easiest way to reduce GHG emissions from
food. Savings vary from 20 to 50% depend-
ing on the country of residence and person-
al habits.
MEATLESS MONDAY
Meatless Monday is a global movement to
promote adopting a vegetarian diet one day
each week for health and environmental
reasons. Participating in Meatless Monday
not only reduces emissions, it also shows
solidarity with a movement for better,
healthier and more climate friendly food
choices. By familiarizing participants with
delicious plant-based recipes, Meatless
Monday also encourages better eating
during the rest of the week.
EAT LOCAL
Local food has, on average, 5 to 17 times
less GHG emissions than conventionally
produced food.115
Though the exact savings
depend heavily on the on-farm inputs and
transportation involved, local food will cut
out all flown food, which has a footprint
much larger than food that has been trucked,
trained or shipped.
KNOW YOUR DIET
Diets that promote health, weight loss,
environmentalism, animal rights or any
other single perspective are unlikely to
consider GHG emissions or sustainability.
Paleo or Atkins diets may help people lose
weight, but all that meat is unsustainable.
Eating free-range and grass fed beef may
be better for the quality of cattle life, but
also contributes more emissions than its
factory-farmed counterpart. Pescetarianism
is seen as an alternative to the cruelty of
factory farms, but those who choose this
diet will find it hard to calculate their
environmental impact and could in fact be
increasing GHG emissions while depleting
worldwide fisheries.
A vendor sells tofu at an outdoor market in Kunming, China. Replacing meat with plant-based proteins such as tofu uses
less water and land and can help reduce greenhouse gas emissions. Photo: Alamy
CONSUMER RECOMMENDATIONS
2 3
E AT I N G F O R T O M O R R O W
There will be no mitigating climate change
without the commitment of the Chinese
government and the cooperation of its 1.4
billion people. There are three reasons for this:
•	 China is the world’s largest emitter of
greenhouse gas and has yet to hit an
overall emissions peak. As with the
United States, the second largest
emitter, reducing GHG emissions is
impossible globally without China
reducing them locally.
•	 As the country continues to develop,
hundreds of millions of people are set
to join the ranks of the urban middle
class in China. How and what these
individuals consume will have far-
reaching impacts on the planet.
•	 China’s rapid economic development
is considered by many developing
countries as a model for bringing their
own population out of poverty. If
China can show that economic
development can coincide with
decarbonization, other countries will
follow. If China cannot define a path to
low-carbon development for low and
middle income countries, other
nations are more likely to follow the
fossil fuel-driven and export-led model
that China has followed thus far, which
could require further increases in GHG
emissions.
Given its centralized political system, China
has the opportunity to implement
emissions-reduction programs with
unmatched speed and scale. This can be
seen in its transition away from coal and
toward renewable energy sources and in its
record sales of new energy vehicles. It can
also be seen in its government directives. In
2014, the State Council :
Citizens shall enhance environmental
protection awareness and adopt a low-
carbon and energy-saving lifestyle, and
conscientiously fulfill the obligation of
environmental protection.
Professor Yuexin Yang, President of the Chinese Nutrition Society, announces
her organization’s new dietary recommendations at a press conference on May
15, 2016.
It is unsurprising then, that the Chinese
Nutrition Society is leading the world in
advocating for significantly reduced meat
consumption. By 2030, China is projected
to add the equivalent of the entire US
consumption to global demand for meat
and dairy, which will increase related
emissions by over 50%. However, if citizens
follow the CNS guidelines and reduce
consumption to recommended levels,
emissions from meat consumption would
be 56% less than in 2015 and 70% less than
projected in 2030.
While driving down emissions, adoption of
CNS recommendations would help ensure
food security in the face of threats
such as water shortages, pollution and
desertification. With 1.4 billion people,
China has 25% of the arable land of the US
and 33% the global average per capita water
resources. China is likely to feel the effects of
climate change on food security first, fastest
and on the largest scale. Reducing meat
consumption is a clear way to get ahead of
these and other potential resource crises.
If China is able to make progress on the
issue of meat consumption and the issue of
GHG emissions, it could ignite global
competition and ultimately inspire others
to follow suit. Lowering emissions through
competition benefits us all from a
sustainability perspective, while leading
on the issue also benefits China from a
geopolitical one. As a 2015 Chatham House
report suggests, “decisive action in the
West may galvanize belief in China that
change is possible and worthwhile, and
vise versa.”
CHINA IS READY TO LEAD
2 4
5 T O D O T O D AY
ENDNOTES
1.	 Kim, Brent, et. al. “The Importance of Reducing
Animal Product Consumption and Wasted Food in
Mitigating Catastrophic Climate Change.” Johns
Hopkins Center for a Livable Future, Dec. 2015.
2.	 Bailey, et. al., “Livestock – Climate Change’s
Forgotten Sector.” Chatham House, Dec. 2014.
3.	 Avatar Alliance Foundation “Fact Sheet: The
Environmental Impact of Animal-Based Foods.”
4.	 Bailey, et. al. 2014.
5.	Ibid.
6.	 Herrero, Mario, et. al, “Biomass use, production,
feed efficiencies and greenhouse gas emissions
from global livestock systems.” Proceedings of the
National Academy of Sciences of the United States
of America, co. 110 no. 52, 20888-20893, doi:
10.1073/pnas.138149110
7.	 OECD database. https://data.oecd.org/agroutput/
meat-consumption.htm
8.	 Bourne, Joel K. The End of Plenty, 2015.
9.	 California Environmental Associates, “Dietary
Trends in Asia: Environmental Impact and the
Potential to Shift Meat Consumption Trends.” 2013.
10.	 “Kids as Food Heroes: A New Way to Eat in China,”
Joint US-China Cooperation on Clean Energy
(JUCCCE), May 2015.
11.	 US Environmental Protection Agency, https://
www3.epa.gov/climatechange/ghgemissions/gwps.
html
12.	 Bailey, et. al. 2014.
13.	 Oppenlander, Richard, Food Choice and
Sustainability. Langdon Street Press, 2013.
14.	 Kim, et. al., 2015.
15.	 Bailey, et. al. 2014.
16.	 AAF, “Fact Sheet.”
17.	 “Risk Assessment Evaluation for CAFOs,” USEPA,
18. 	 “Counting Chickens,” The Economist, July 27, 2011.
19.	 McSweeney, Robert “Global temperature rise set
to hit 1C of warming this year, Met Office says.”
Carbon Brief, 9 Nov. 2015.
20.	 “Understanding Carbon Budgets,” WWF. 2014.
http://awsassets.wwf.org.za/downloads/
understanding_carbon_budgets_final.pdf
21.	 Oppenlander, 2013.
22.	 49 GtCO2eq (estimated annual emissions) X .145 =
7.105 GtCO2eq.
23.	 Bailey, et. al. 2014.
24.	 AAF, “Fact Sheet.”
25.	 Watson, Elaine, “Is the decline in US meat
consumption terminal?” Food Navigator USA, 12
April 2013. http://www.foodnavigator-usa.com/
Markets/Is-the-decline-in-US-meat-consumption-
terminal
26.	 CEA, 2013.
27.	 United Nations, FAOStat database
28.	 Yan, Yunxiang, “McDonald’s in Beijing: The
Localization of Americana,” New York Times, 1997.
https://www.nytimes.com/books/first/w/watson-
arches.html
29.	 Osnos, Evan, Age of Ambition: Chasing Fortune,
Truth and Faith in the New China. Garrar, Straus
and Giroux, 2015.
30.	 Chinese Nutrition Society
31.	 Osnos, 2015.
32.	 CEA, 2013.
33.	 See notes 7 and 8.
34.	 CEA, 2013.
35.	Ibid.
36.	 See Appendix II.
37.	 Median projections of United Nations Population
Division.
38.	 “The Ecological Consequences of Meat
Consumption,” http://www.vegetarismus.ch/info/
eoeko.htm
39.	 AAF, “Fact Sheet.”
40.	Ibid.
41.	 Valentine, Katie, “Humans Are Set To Wipe an
India-Sized Chunk of Forest Off the Map by
2050.” Climate Progress, Aug. 24, 2015. http://
thinkprogress.org/climate/2015/08/24/3694560/
deforestation-india-sized-chunk/
42.	 Zhang, Moran, “Field of Dreams? 7 Reasons Why
You Don’t Want To Be A Farmer in China.” IBT, 22
August 2013.
43.	 Beardson, Timothy, Stumbling Giant: The Threats
to China’s Future. Yale University Press, 2013.
44.	Ibid.
45.	 Demick, Barbara “China looks abroad for greener
pastures,” The LA Times, 29 March 2014. http://
www.latimes.com/world/asia/la-fg-china-foreign-
farmland-20140329-story.html
46.	 Oppenlander, 2013.
47.	 UNFAO “Livestock’s role in deforestation.”
http://www.fao.org/agriculture/lead/themes0/
deforestation/en/
48.	 Oppenlander, 2013.
49. 	 Gale, Fred, Hansen James, and Jewison, Michael,
“China’s Growing Demand for Agricultural
Imports,” USDA, Feb. 2014.
50.	 UNCCD “Climate change and land degradation:
Bridging knowledge and stakeholders.” 9-12 March
2015.
51.	Ibid.
52.	 Pioneer, “Africa’s Agricultural Opportunities.”
https://www.pioneer.com/CMRoot/Pioneer/
About_Global/news_media/pannar/Africa_Ag_
Opportunities.pdf
53.	UNCCD.
54.	 Herrero, 2013.
55.	 Beardson, 2013.
56.	 Patrick, 2012.
57.	 Bailey, et. al. 2014
58.	 World Bank Group, “Water and Climate Change.”
http://water.worldbank.org/topics/water-
resources-management/water-and-climate-change
59.	 Water and Climate Change: Understanding the
Risks and Making Smart Investment Decisions. The
World Bank, 2009. http://www-wds.worldbank.org/
external/default/WDSContentServer/WDSP/IB/201
0/02/01/000333038_20100201020244/Rendered/
PDF/529110NWP0Box31ge0web0large01128110.pdf
60.	 United Nations Water, “Statistics.” http://
www.unwater.org/statistics/statistics-detail/
en/c/211649/
61.	 Barringer, Felicity, “World’s Aquifers Losing
Replenishing Race, Researchers Say.” The New York
Times, 25 June 2015.
62.	 United Nations Water, “Statistics.” http://
www.unwater.org/statistics/statistics-detail/
en/c/211794/; http://www.unwater.org/statistics/
statistics-detail/en/c/211799/
63.	 Beardson, 2013.
64.	Ibid.
65.	 Beardson, 2013.
66.	 Moore, Scott “Issue Brief: Water Resource
Issues, Policy and Politics in China.” Brookings
Institute http://www.brookings.edu/research/
papers/2013/02/water-politics-china-moore
67.	 Beardson, 2013.
68.	 AgEconSearch, Research in Agricultural and
Applied Economics. (https://fresnostate.digication.
com/nicole_leu/Term_Paper)
69.	 National Bureau of Statistics, China
70. 	 Bailey, et al., 2014.
71.	 WWF “Solving the Soy Problem.” http://wwf.panda.
org/what_we_do/footprint/agriculture/soy/
72.	 Bourne, 2015.
73.	 Oppenlander, Richard, “The World Hunger-
Food Choice Connection.” 22 April 2012. http://
comfortablyunaware.com/blog/the-world-hunger-
food-choice-connection-a-summary/
74.	 “Existing Cropland Could Feed 4 Billlion More” 1
August 2013. http://discover.umn.edu/news/food-
agriculture/existing-cropland-could-feed-4-billion-
more
75.	 Bourne, 2015.
76.	 Shefali, 2014.
77.	Ibid.
78.	Ibid.
79.	Ibid.
80.	 Datz, Todd “Red meat raises red flags.” Harvard
Gazette, 12 March, 2012. http://news.harvard.edu/
gazette/story/2012/03/red-meat-raises-red-flags/
81. 	 “It’s Official, Vegetarians Outlive Meat
Eaters,” Times of India, 16 Oct. 2012. http://
timesofindia.indiatimes.com/home/science/
2 5
E AT I N G F O R T O M O R R O W
Its-official-Vegetarians-outlive-the-meat-eaters/
articleshow/16830925.cms
82.	 Sifferlin, Alexandra, “7 Reasons Vegetarians Live
Longer.” Time February 24, 2014. http://time.
com/9463/7-reasons-vegetarians-live-longer/
83.	 “Cut down on meat to lose weight.” BBC News
July 22, 2010. http://www.bbc.com/news/
health-10726414
84.	 Wilson, Deborah “Eating Meat Is Linked to
Obesity.” http://www.peta.org/issues/animals-
used-for-food/obesity/
85. 	 Yan Min, et. al., “Tackling China’s
Noncommunicable Diseases: Shared Origins, Costly
Consequences and the Need for Action,” Chinese
Medical Journal, 20 Mar 20-15.
86.	 JUCCCE, 2015.
87.	 Hackethal, Veronica, “Diabetes Is a Major Public-
Health Crisis in China,” Medscape, 18 Sept. 2014.
88.	 Levitt, Tom, “China facing bigger dietary health
crisis than the US.” China Dialogue, 4 July 2014.
89.	 Wang, Jeanette “62 million people in China obese,
sparking fears of ‘alarming’ financial burden.”
South China Morning Post, 29 May 2014. http://
www.scmp.com/lifestyle/health/article/1521011/21-
billion-people-are-obese-china-and-us-among-
worlds-fattest-new
90.	 Zero Hedge, “The Sick Man of Asia – China’s
Looming Health Disaster.” 9 June 2015.
91.	 JUCCCE, 2015.
92.	Ibid.
93.	 Levitt, 2014.
94.	 Moore, Malcom “China faces looming health crisis,
warn experts.” Telegraph UK, 29 Aug 2014. http://
www.telegraph.co.uk/news/worldnews/asia/
china/11061559/China-faces-looming-health-crisis-
warn-experts.html
95.	 Watts, Jonathan, “When A Billion Chinese Jump,”
Scribner, 2010.
96. 	 Oppenlander, 2013.
97.	 Zielinski, Sarah “Ocean Dead Zones Are Getting
Worse Globally Due to Climate Change.”
Smithsonian 20 Nov. 2014. http://www.
smithsonianmag.com/science-nature/ocean-dead-
zones-are-getting-worse-globally-due-climate-
change-180953282/?no-ist
98.	 “Dead Zones: How Agricultural Fertilizers Kill our
Rivers, Lakes and Oceans,” Greenpeace, 2008.
99. 	 Zimmer, Carl “A Looming Oxygen Crisis and Its
Impact on World’s Oceans.” Yale Environment
360, 5 Aug. 2010. http://e360.yale.edu/feature/a_
looming_oxygen_crisis_and_its_impact_on_
worlds_oceans/2301/
100.	Center for Biological Diversity, “The Extinction
Crisis,” http://www.biologicaldiversity.org/
programs/biodiversity/elements_of_biodiversity/
extinction_crisis/
101.	 Djoghlaf, Ahmed “Secretariat of the Convention on
Biological Diversity; A Message from the Executive
Secretary.” 22 May 2007. https://www.cbd.int/doc/
speech/2007/sp-2007-05-22-es-en.pdf
102.	 Interview of Simon Stuart, Chair of the
International Union for Conservation of Nature
Species Survival by Dr. Richard Oppenlander, 2004.
Cowspiracy, “Facts” http://www.cowspiracy.com/
facts/
103.	 Jowit, Juliette, “Humans driving extinction faster
than species can evolve, say experts.” The Guardian,
10 March 2010. http://www.theguardian.com/
environment/2010/mar/07/extinction-species-
evolve
104.	 “Extinction crisis continues apace,” IUCN, Nov.
3, 2009. http://www.iucn.org/?4143/Extinction-
crisis-continues-apace
105. 	Roberts, Dexter “Five Reasons China Should Care
About Climate Change.” Bloomberg Business, 24
March 2015. http://www.bloomberg.com/news/
articles/2015-03-24/five-reasons-china-should-
care-about-climate-change
106. Kahn, Brian “Sea Level Could Rise at Least 6
Meters.” Scientific American, 9 July 2015 http://
www.scientificamerican.com/article/sea-level-
could-rise-at-least-6-meters/
107. 	Neumann, Barbara, et. al. “Future Coastal
Population Growth and Exposure to Sea-Level Rise
and Flooding – A Global Assessment.” http://www.
ncbi.nlm.nih.gov/pmc/articles/PMC4367969/
108.	Population Action International, “Climate Change,
Migration, and Population Growth.” http://pai.org/
wp-content/uploads/2012/01/climatemigration.pdf
109.	 Levacher, Cecile “Climate Change in the Tibetan
Plateau Region: Glacial Melt and Future Water
Security.” Future Directions International, 29 May
2014.
110.	 The International Disasters Database (EM-DAT).
111.	 Kim, et. al. 2015.
112.	 Wellesley, Laura; Happer, Catherine; Froggatt,
Antony, Changing Climate, Changing Diets:
Pathways to Lower meat Consumption. Chatham
House, Dec. 2015.
113.	Ibid.
114.	 Kim, et. al. 2015.
115.	 Cho, Renee, “How Green is Local Food?” Earth
Institute: State of the Planet, 4 September 2012.
Columbia University.
116.	 China’s population expected to reach 1.45 bln
by 2030,” China Daily, Oct. 30, 2015. http://
www.chinadaily.com.cn/china/2015-10/30/
content_22329857.htm
117.	 Better Livestock Management Could Rein in Billions
of Tons of Carbon,” Conservation Magazine; March
2016. http://conservationmagazine.org/2016/03/
ways-greenhouse-gases-livestock-production/
A soybean harvest is underway. Compared to livestock products, soy protein requires less land and water
to grow and emits less greenhouse gas. Photo: A Pixabay
2 6
5 T O D O T O D AY
POPULATION:
The National Bureau of Statistics provided
the 2015 population while China Daily
reports on official population projections
for 2030.116
MEAT CONSUMPTION:
Per capita meat consumption in 2015, was
provided by the Chinese Nutrition Society.
For projections of meat consumption in
2030, the California Environmental
Associates (CEA) report “Dietary Trends in
Asia” was used. However, the projection
for lamb was not provided in the CEA
projections and was estimated by the
Chinese Nutrition Society for 2030.
GHGS PER KILO OF MEAT:
In its report Changing Climate, Changing
Diet, Chatham House aggregated several
assessments on the total emissions per kilo
of meat. However, this analysis does not
take into account potential reductions in
emissions intensity through technological
mitigation. Technological mitigation
combined with the stated reductions in
meat consumption could have even greater
potential for overall emissions reductions
by 2030 than stated in this analysis. A
recent study estimates that better feed and
grazing practices could reduce total
emissions from livestock by 2 GtCO2eq
globally, mainly from developing countries
such as China.117
TOTAL GHG EMISSIONS:
Total emissions for the world and China
are from the CAIT database provided by
the World Resources Institute. As 2015
emissions data was not yet available, the
most recent data (2012) was used for the
2015 scenario.
EMISSIONS FROM AGRICULTURE:
Agriculture emissions for 2015 and
projections for 2030 in China are from the
FAOStat database. Unfortunately, as 2015
data was not yet available, and the most
recent data (2012) was used for the 2015
scenario. The emissions data from
agriculture is not a perfect comparison to
emissions from meat consumption, but
provides a useful benchmark. For one,
FAOStat emissions calculate GHGs from
the country of agricultural production, not
the country of consumption. Because of
the large imports of soy and corn to feed its
livestock, much of the emissions associated
with Chinese consumption are attributed
to the country of production. Secondly,
agricultural emissions encompass all
agriculture, not only those limited to
livestock, meat and dairy.
CNS DIETARY GUIDELINES:
The levels of meat consumption used in
these calculations are from the high-end of
the range recommended by CNS,
approximately 27.34 kg per year. As CNS
does not specify the type of meat, the
proportion of meat types in these
calculations is found by using the
breakdown of meat proportions for current
consumption for the 2015 scenario, and
from the CEA projections for the 2030
scenario, then applying those proportions
to the total recommended consumption of
27.34 kg.
OTHER NOTES:
This analysis is limited to emissions from
meat consumption only and does not
include emissions from substitute protein
sources such as soy, seafood or dairy.
GHGS FROM MEAT CONSUMPTION IN CHINA
GHG PER
KILO
ANNUAL
CONSUMPTION
PER CAPITA
2015 (KG)
ANNUAL GHG
PER CAPITA
(KGCO2EQ)
NATIONAL
GHG TOTAL
(MTCO2EQ)
2015
ANNUAL CON-
SUMPTION
PER CAPITA
2030 (KG, CEA
PROJECTION)
GHG PER
CAPITA , 2030
(KGCO2EQ ,
PROJECTED)
NATION-
AL GHG
TOTAL 2030
(MTCO2EQ ,
PROJECTED)
INCREASE
IN GHG,
2015 —2030
(MTCO2EQ)
% INCREASE
IN GHG,
2015 —2030
Poultry 7.00 13.34 93.38 128.36 24.00 168.00 243.60 115.24 89.78%
Pork 8.80 40.97 360.54 495.60 58.00 510.40 740.08 244.48 49.33%
Beef 56.60 5.44 307.90 423.25 8.00 452.80 656.56 233.31 55.12%
Lamb 31.30 3.36 105.17 144.57 3.62 113.31 164.29 19.73 13.65%
TOTAL 63.11 866.99 1191.78 93.62 1244.51 1804.53 612.75 51.42%
APPENDIX
CNS GUIDELINE ANALYSIS IN DETAIL
2 7
E AT I N G F O R T O M O R R O W
GHG FROM CNS RECOMMENDATIONS 2015
ANNUAL CONSUMPTION
PER CAPITA 2015 (KG)
ANNUAL CONSUMPTION
PER CAPITA (KG), CNS
RECOMMENDATION
GHG EMISSIONS PER
KILO (KGC02EQ)
ANNUAL GHG PER
CAPITA (KGCO2EQ)
NATIONAL GHG TOTAL
FROM CNS DIET
(MTCO2EQ), 2015
POULTRY 13.34 5.78 7.00 40.47 55.63
PORK 40.97 17.76 8.80 156.25 214.78
BEEF 5.44 2.36 56.60 133.44 183.42
LAMB 3.36 1.46 31.30 45.58 62.65
TOTAL 63.11 27.35 375.73 516.48
GHG FROM CNS RECOMMENDATIONS 2030
CEA 2030 DIET (KG,
PROJECTED)
ANNUAL CONSUMPTION
PER CAPITA (KG),
CNS RECOMMENDATION
GHG EMISSIONS PER
KILO (KGCO2EQ)
ANNUAL GHG PER
CAPITA (KGCO2EQ)
NATIONAL GHG TOTAL
FROM CNS DIET
(MTCO2EQ), 2030
POULTRY 24.00 7.01 7.00 49.06 71.14
PORK 58.00 16.94 8.80 149.05 216.13
BEEF 8.00 2.34 56.60 132.23 191.74
LAMB 3.62 1.06 31.30 33.09 47.98
TOTAL 93.62 27.34 363.44 526.98
GHG REDUCTIONS FROM CNS RECOMMENDATIONS IN CHINA
ACTUAL GHGS IN
2015 (MTCO2EQ)
PROJECTED GHGS
IN 2030 (MTCO2EQ)
GHGS FROM CNS
RECOMMENDATIONS,
2015 (MTCO2EQ)
GHGS FROM CNS
RECOMMENDATIONS,
2030 (MTCO2EQ)
CNS %
REDUCTION, 2015
CNS %
REDUCTION, 2030
POULTRY 128.36 243.60 55.63 71.14 56.66% 70.80%
PORK 495.60 740.08 214.78 216.13 56.66% 70.80%
BEEF 423.25 656.56 183.42 191.74 56.66% 70.80%
LAMB 144.57 164.29 62.65 47.98 56.66% 70.80%
TOTAL 1191.78 1804.53 516.48 526.98 56.66% 70.80%
TOTAL GHG REDUCTIONS FROM CNS RECOMMENDATIONS
2015 (MTCO2EQ) 2030 (MTCO2EQ , PROJECTED) CNS REDUCTION IN 2015 AS % OF: CNS REDUCTION IN 2030 AS % OF:
WORLD TOTAL
GHG EMISSIONS
43286.2 1.56%
CHINA TOTAL GHG
EMISSIONS
10975.5 13214.98 6.15% 9.67%
AGRICULTURE GHG REDUCTIONS FROM CNS RECOMMENDATIONS
2015 (MTCO2EQ) 2030 (MTCO2EQ , PROJECTED) CNS REDUCTION IN 2015 AS % OF: CNS REDUCTION IN 2030 AS % OF:
WORLD TOTAL GHG
FROM AGRICULTURE 5381.51 5756.07 12.55% 22.19%
CHINA TOTAL GHG
FROM AGRICULTURE 831.56 873.46 81.21% 146.26%
5 TO DO TODAY
333 PINE ST. #300 SAN FRANCISCO, CA 94104
TEL: 415.834.3174
INFO@WILDAID.ORG | www.5TODO.org
This report is printed on 100% recycled paper

Weitere ähnliche Inhalte

Was ist angesagt?

Livestock summary of key points 40-c
Livestock   summary of key points 40-cLivestock   summary of key points 40-c
Livestock summary of key points 40-cPaul Mahony
 
Fat the new health paradigm : credit-suisse
Fat the new health paradigm : credit-suisseFat the new health paradigm : credit-suisse
Fat the new health paradigm : credit-suisseNew Food Innovation Ltd
 
Comments on Meat & Livestock Australia's So-Called "Myth Busters"
Comments on Meat & Livestock Australia's So-Called "Myth Busters"Comments on Meat & Livestock Australia's So-Called "Myth Busters"
Comments on Meat & Livestock Australia's So-Called "Myth Busters"Paul Mahony
 
EAT - Food Plant Health - The Lancet Commission 2019
EAT - Food Plant Health - The Lancet Commission 2019EAT - Food Plant Health - The Lancet Commission 2019
EAT - Food Plant Health - The Lancet Commission 2019New Food Innovation Ltd
 
Climate Smart Livestock Production, by Dr Adil Rasool Paray
Climate Smart Livestock Production, by Dr Adil Rasool ParayClimate Smart Livestock Production, by Dr Adil Rasool Paray
Climate Smart Livestock Production, by Dr Adil Rasool ParayAdil Rasool Paray
 
Dietary Choices and Climate Change
Dietary Choices and Climate Change Dietary Choices and Climate Change
Dietary Choices and Climate Change Kim Nicholas
 
The Electric Cow
The Electric CowThe Electric Cow
The Electric CowPaul Mahony
 
Livestock and Climate Change - Tara Garnett, Food Climate Research Network, U...
Livestock and Climate Change - Tara Garnett, Food Climate Research Network, U...Livestock and Climate Change - Tara Garnett, Food Climate Research Network, U...
Livestock and Climate Change - Tara Garnett, Food Climate Research Network, U...guycollender
 
Environmental Impacts of Animal Agriculture - Part 2
Environmental Impacts of Animal Agriculture - Part 2Environmental Impacts of Animal Agriculture - Part 2
Environmental Impacts of Animal Agriculture - Part 2Paul Mahony
 
IB Extended Essay: Comparison of the Effects of Vegan and Meat Inclusive Diet...
IB Extended Essay: Comparison of the Effects of Vegan and Meat Inclusive Diet...IB Extended Essay: Comparison of the Effects of Vegan and Meat Inclusive Diet...
IB Extended Essay: Comparison of the Effects of Vegan and Meat Inclusive Diet...Laurel Ayuyao
 
Meat: human health and greenhouse gas emissions
Meat: human health and greenhouse gas emissionsMeat: human health and greenhouse gas emissions
Meat: human health and greenhouse gas emissionsPeter Carter
 
Sustainable alternative food Protein - Quorn Sustainability report final july...
Sustainable alternative food Protein - Quorn Sustainability report final july...Sustainable alternative food Protein - Quorn Sustainability report final july...
Sustainable alternative food Protein - Quorn Sustainability report final july...New Food Innovation Ltd
 
Livestock industry and its unethical
Livestock industry and its unethicalLivestock industry and its unethical
Livestock industry and its unethicallouisllget
 
Eat Well Guide : A more sustainable Diet : Carbon Trust UK
Eat Well Guide : A more sustainable Diet : Carbon Trust UKEat Well Guide : A more sustainable Diet : Carbon Trust UK
Eat Well Guide : A more sustainable Diet : Carbon Trust UKNew Food Innovation Ltd
 
Future Forum 2013 - Kurt Schmidinger
Future Forum 2013 - Kurt SchmidingerFuture Forum 2013 - Kurt Schmidinger
Future Forum 2013 - Kurt SchmidingerFriuli Future Forum
 
Knowledge base - detail Title Intensive
Knowledge base - detail Title 	Intensive Knowledge base - detail Title 	Intensive
Knowledge base - detail Title Intensive copppldsecretariat
 
Climate Change Slides
Climate  Change  SlidesClimate  Change  Slides
Climate Change Slidesthilight
 

Was ist angesagt? (20)

Livestock summary of key points 40-c
Livestock   summary of key points 40-cLivestock   summary of key points 40-c
Livestock summary of key points 40-c
 
Fat the new health paradigm : credit-suisse
Fat the new health paradigm : credit-suisseFat the new health paradigm : credit-suisse
Fat the new health paradigm : credit-suisse
 
Comments on Meat & Livestock Australia's So-Called "Myth Busters"
Comments on Meat & Livestock Australia's So-Called "Myth Busters"Comments on Meat & Livestock Australia's So-Called "Myth Busters"
Comments on Meat & Livestock Australia's So-Called "Myth Busters"
 
EAT - Food Plant Health - The Lancet Commission 2019
EAT - Food Plant Health - The Lancet Commission 2019EAT - Food Plant Health - The Lancet Commission 2019
EAT - Food Plant Health - The Lancet Commission 2019
 
Climate Smart Livestock Production, by Dr Adil Rasool Paray
Climate Smart Livestock Production, by Dr Adil Rasool ParayClimate Smart Livestock Production, by Dr Adil Rasool Paray
Climate Smart Livestock Production, by Dr Adil Rasool Paray
 
Dietary Choices and Climate Change
Dietary Choices and Climate Change Dietary Choices and Climate Change
Dietary Choices and Climate Change
 
The Electric Cow
The Electric CowThe Electric Cow
The Electric Cow
 
Livestock and Climate Change - Tara Garnett, Food Climate Research Network, U...
Livestock and Climate Change - Tara Garnett, Food Climate Research Network, U...Livestock and Climate Change - Tara Garnett, Food Climate Research Network, U...
Livestock and Climate Change - Tara Garnett, Food Climate Research Network, U...
 
Environmental Impacts of Animal Agriculture - Part 2
Environmental Impacts of Animal Agriculture - Part 2Environmental Impacts of Animal Agriculture - Part 2
Environmental Impacts of Animal Agriculture - Part 2
 
Honors Capstone 2018
Honors Capstone 2018Honors Capstone 2018
Honors Capstone 2018
 
IB Extended Essay: Comparison of the Effects of Vegan and Meat Inclusive Diet...
IB Extended Essay: Comparison of the Effects of Vegan and Meat Inclusive Diet...IB Extended Essay: Comparison of the Effects of Vegan and Meat Inclusive Diet...
IB Extended Essay: Comparison of the Effects of Vegan and Meat Inclusive Diet...
 
Meat: human health and greenhouse gas emissions
Meat: human health and greenhouse gas emissionsMeat: human health and greenhouse gas emissions
Meat: human health and greenhouse gas emissions
 
Is meat killing us
Is meat killing us Is meat killing us
Is meat killing us
 
Sustainable alternative food Protein - Quorn Sustainability report final july...
Sustainable alternative food Protein - Quorn Sustainability report final july...Sustainable alternative food Protein - Quorn Sustainability report final july...
Sustainable alternative food Protein - Quorn Sustainability report final july...
 
Livestock industry and its unethical
Livestock industry and its unethicalLivestock industry and its unethical
Livestock industry and its unethical
 
Eat Well Guide : A more sustainable Diet : Carbon Trust UK
Eat Well Guide : A more sustainable Diet : Carbon Trust UKEat Well Guide : A more sustainable Diet : Carbon Trust UK
Eat Well Guide : A more sustainable Diet : Carbon Trust UK
 
Future Forum 2013 - Kurt Schmidinger
Future Forum 2013 - Kurt SchmidingerFuture Forum 2013 - Kurt Schmidinger
Future Forum 2013 - Kurt Schmidinger
 
Paper
PaperPaper
Paper
 
Knowledge base - detail Title Intensive
Knowledge base - detail Title 	Intensive Knowledge base - detail Title 	Intensive
Knowledge base - detail Title Intensive
 
Climate Change Slides
Climate  Change  SlidesClimate  Change  Slides
Climate Change Slides
 

Ähnlich wie Eating for tomorrow - China

Shifting Diets and Sustainable Food for Future Generations
Shifting Diets and Sustainable Food for Future Generations Shifting Diets and Sustainable Food for Future Generations
Shifting Diets and Sustainable Food for Future Generations New Food Innovation Ltd
 
impacts of meat industries on environment-1.pptx
impacts of meat industries on environment-1.pptximpacts of meat industries on environment-1.pptx
impacts of meat industries on environment-1.pptxDharmendrakr4
 
Climate change and food
Climate change and foodClimate change and food
Climate change and foodAnna Ternell
 
Why agriculture is a major environmental polluter
Why agriculture is a major environmental polluterWhy agriculture is a major environmental polluter
Why agriculture is a major environmental polluterCSR-in-Action
 
Pigs and the Environment 8Jan
Pigs and the Environment 8JanPigs and the Environment 8Jan
Pigs and the Environment 8Janakleanthous
 
Cow Farts are No Laughing Matter
Cow Farts are No Laughing MatterCow Farts are No Laughing Matter
Cow Farts are No Laughing MatterKlaira Lerma
 
From Farming to Pharmaceuticals
From Farming to PharmaceuticalsFrom Farming to Pharmaceuticals
From Farming to PharmaceuticalsGene Balas, CFA
 
Redefining agricultural yields: from tonnes to people nourished per hectare
Redefining agricultural yields: from tonnes to people nourished per hectareRedefining agricultural yields: from tonnes to people nourished per hectare
Redefining agricultural yields: from tonnes to people nourished per hectareWouter de Heij
 
If Everyone Was a Vegetarian
If Everyone Was a VegetarianIf Everyone Was a Vegetarian
If Everyone Was a Vegetarianbpavic13
 
Vegetarianism tackle
Vegetarianism tackleVegetarianism tackle
Vegetarianism tackleBala0348
 
The protein challenge_2040_summary_report
The protein challenge_2040_summary_reportThe protein challenge_2040_summary_report
The protein challenge_2040_summary_reportNew Food Innovation Ltd
 
Climat echange and food security
Climat echange and food securityClimat echange and food security
Climat echange and food securityShah Awan
 
Ca norganicfeed theworld
Ca norganicfeed theworldCa norganicfeed theworld
Ca norganicfeed theworldwongkaiyuen
 
IFST Journal Winter 2015 .Food Sustainability - Waste not want not.
IFST Journal Winter 2015 .Food  Sustainability -  Waste not want not.IFST Journal Winter 2015 .Food  Sustainability -  Waste not want not.
IFST Journal Winter 2015 .Food Sustainability - Waste not want not.Sterling Crew
 
smart-livestock-farming (1)
smart-livestock-farming (1)smart-livestock-farming (1)
smart-livestock-farming (1)Fred Nijland
 
181017 long version middletonj planetary health or plexit iiphf gibraltar
181017 long version middletonj  planetary health or plexit iiphf gibraltar181017 long version middletonj  planetary health or plexit iiphf gibraltar
181017 long version middletonj planetary health or plexit iiphf gibraltarJohn Middleton
 

Ähnlich wie Eating for tomorrow - China (20)

Quorn -Sustainability 2017 report
Quorn -Sustainability 2017 reportQuorn -Sustainability 2017 report
Quorn -Sustainability 2017 report
 
Shifting Diets and Sustainable Food for Future Generations
Shifting Diets and Sustainable Food for Future Generations Shifting Diets and Sustainable Food for Future Generations
Shifting Diets and Sustainable Food for Future Generations
 
impacts of meat industries on environment-1.pptx
impacts of meat industries on environment-1.pptximpacts of meat industries on environment-1.pptx
impacts of meat industries on environment-1.pptx
 
Climate change and food
Climate change and foodClimate change and food
Climate change and food
 
Why agriculture is a major environmental polluter
Why agriculture is a major environmental polluterWhy agriculture is a major environmental polluter
Why agriculture is a major environmental polluter
 
Pigs and the Environment 8Jan
Pigs and the Environment 8JanPigs and the Environment 8Jan
Pigs and the Environment 8Jan
 
Cow farts ppt
Cow farts pptCow farts ppt
Cow farts ppt
 
Cow Farts are No Laughing Matter
Cow Farts are No Laughing MatterCow Farts are No Laughing Matter
Cow Farts are No Laughing Matter
 
From Farming to Pharmaceuticals
From Farming to PharmaceuticalsFrom Farming to Pharmaceuticals
From Farming to Pharmaceuticals
 
TFTF
TFTFTFTF
TFTF
 
Mike Small S Aconf2010
Mike Small S Aconf2010Mike Small S Aconf2010
Mike Small S Aconf2010
 
Redefining agricultural yields: from tonnes to people nourished per hectare
Redefining agricultural yields: from tonnes to people nourished per hectareRedefining agricultural yields: from tonnes to people nourished per hectare
Redefining agricultural yields: from tonnes to people nourished per hectare
 
If Everyone Was a Vegetarian
If Everyone Was a VegetarianIf Everyone Was a Vegetarian
If Everyone Was a Vegetarian
 
Vegetarianism tackle
Vegetarianism tackleVegetarianism tackle
Vegetarianism tackle
 
The protein challenge_2040_summary_report
The protein challenge_2040_summary_reportThe protein challenge_2040_summary_report
The protein challenge_2040_summary_report
 
Climat echange and food security
Climat echange and food securityClimat echange and food security
Climat echange and food security
 
Ca norganicfeed theworld
Ca norganicfeed theworldCa norganicfeed theworld
Ca norganicfeed theworld
 
IFST Journal Winter 2015 .Food Sustainability - Waste not want not.
IFST Journal Winter 2015 .Food  Sustainability -  Waste not want not.IFST Journal Winter 2015 .Food  Sustainability -  Waste not want not.
IFST Journal Winter 2015 .Food Sustainability - Waste not want not.
 
smart-livestock-farming (1)
smart-livestock-farming (1)smart-livestock-farming (1)
smart-livestock-farming (1)
 
181017 long version middletonj planetary health or plexit iiphf gibraltar
181017 long version middletonj  planetary health or plexit iiphf gibraltar181017 long version middletonj  planetary health or plexit iiphf gibraltar
181017 long version middletonj planetary health or plexit iiphf gibraltar
 

Mehr von New Food Innovation Ltd

Hungry for-plant-based-australian-consumer-insights-oct-2019
Hungry for-plant-based-australian-consumer-insights-oct-2019Hungry for-plant-based-australian-consumer-insights-oct-2019
Hungry for-plant-based-australian-consumer-insights-oct-2019New Food Innovation Ltd
 
The tastiest challenge on the planet the SRA 2019
The tastiest challenge on the planet the SRA 2019 The tastiest challenge on the planet the SRA 2019
The tastiest challenge on the planet the SRA 2019 New Food Innovation Ltd
 
Plant protein is trending with consumers are you ready
Plant protein is trending with consumers are you readyPlant protein is trending with consumers are you ready
Plant protein is trending with consumers are you readyNew Food Innovation Ltd
 
Motivaction presentation green protein - Presentation
Motivaction presentation green protein -  PresentationMotivaction presentation green protein -  Presentation
Motivaction presentation green protein - PresentationNew Food Innovation Ltd
 
Seminar on Emerging Dairy and Food Technologies 2018
Seminar on Emerging Dairy and Food Technologies 2018 Seminar on Emerging Dairy and Food Technologies 2018
Seminar on Emerging Dairy and Food Technologies 2018 New Food Innovation Ltd
 
Insent Taste Sensing System - Its use in cost savings
Insent Taste Sensing System - Its use in cost savings Insent Taste Sensing System - Its use in cost savings
Insent Taste Sensing System - Its use in cost savings New Food Innovation Ltd
 
New Zealand - Future of meat final report
New Zealand -  Future of meat final reportNew Zealand -  Future of meat final report
New Zealand - Future of meat final reportNew Food Innovation Ltd
 
Climate change mitigation beyond agriculture a review of food system_opportun...
Climate change mitigation beyond agriculture a review of food system_opportun...Climate change mitigation beyond agriculture a review of food system_opportun...
Climate change mitigation beyond agriculture a review of food system_opportun...New Food Innovation Ltd
 
Fairr sustainable protein_dd_09_feb_2018
Fairr sustainable protein_dd_09_feb_2018Fairr sustainable protein_dd_09_feb_2018
Fairr sustainable protein_dd_09_feb_2018New Food Innovation Ltd
 
Nutrition and evidence for FODMAP diet management
Nutrition and evidence for  FODMAP diet management Nutrition and evidence for  FODMAP diet management
Nutrition and evidence for FODMAP diet management New Food Innovation Ltd
 
Institute of Brewing and Distilling - Sensory-and-Consumer-science-masterclas...
Institute of Brewing and Distilling - Sensory-and-Consumer-science-masterclas...Institute of Brewing and Distilling - Sensory-and-Consumer-science-masterclas...
Institute of Brewing and Distilling - Sensory-and-Consumer-science-masterclas...New Food Innovation Ltd
 

Mehr von New Food Innovation Ltd (20)

Protein consumption march_2019
Protein consumption march_2019Protein consumption march_2019
Protein consumption march_2019
 
Hungry for-plant-based-australian-consumer-insights-oct-2019
Hungry for-plant-based-australian-consumer-insights-oct-2019Hungry for-plant-based-australian-consumer-insights-oct-2019
Hungry for-plant-based-australian-consumer-insights-oct-2019
 
Meat reimagined Food Frontier report
Meat reimagined  Food Frontier report Meat reimagined  Food Frontier report
Meat reimagined Food Frontier report
 
The tastiest challenge on the planet the SRA 2019
The tastiest challenge on the planet the SRA 2019 The tastiest challenge on the planet the SRA 2019
The tastiest challenge on the planet the SRA 2019
 
Plant protein is trending with consumers are you ready
Plant protein is trending with consumers are you readyPlant protein is trending with consumers are you ready
Plant protein is trending with consumers are you ready
 
Motivaction presentation green protein - Presentation
Motivaction presentation green protein -  PresentationMotivaction presentation green protein -  Presentation
Motivaction presentation green protein - Presentation
 
Seminar on Emerging Dairy and Food Technologies 2018
Seminar on Emerging Dairy and Food Technologies 2018 Seminar on Emerging Dairy and Food Technologies 2018
Seminar on Emerging Dairy and Food Technologies 2018
 
E tongue - bitterness masking
E tongue - bitterness masking E tongue - bitterness masking
E tongue - bitterness masking
 
Insent Taste Sensing System - Its use in cost savings
Insent Taste Sensing System - Its use in cost savings Insent Taste Sensing System - Its use in cost savings
Insent Taste Sensing System - Its use in cost savings
 
New Zealand - Future of meat final report
New Zealand -  Future of meat final reportNew Zealand -  Future of meat final report
New Zealand - Future of meat final report
 
Climate change mitigation beyond agriculture a review of food system_opportun...
Climate change mitigation beyond agriculture a review of food system_opportun...Climate change mitigation beyond agriculture a review of food system_opportun...
Climate change mitigation beyond agriculture a review of food system_opportun...
 
Junior Consultants 2017
Junior Consultants 2017 Junior Consultants 2017
Junior Consultants 2017
 
Fairr sustainable protein_dd_09_feb_2018
Fairr sustainable protein_dd_09_feb_2018Fairr sustainable protein_dd_09_feb_2018
Fairr sustainable protein_dd_09_feb_2018
 
Nutrition and evidence for FODMAP diet management
Nutrition and evidence for  FODMAP diet management Nutrition and evidence for  FODMAP diet management
Nutrition and evidence for FODMAP diet management
 
Global nutrition report 2017
Global nutrition report 2017Global nutrition report 2017
Global nutrition report 2017
 
E..coli.flour.nejmoa1615910
E..coli.flour.nejmoa1615910E..coli.flour.nejmoa1615910
E..coli.flour.nejmoa1615910
 
Diet and climate change
Diet and climate change Diet and climate change
Diet and climate change
 
Global Hunger index Africa edition 2016
Global Hunger index   Africa edition 2016Global Hunger index   Africa edition 2016
Global Hunger index Africa edition 2016
 
The True Cost of American Foods 2016
The True Cost of American Foods  2016The True Cost of American Foods  2016
The True Cost of American Foods 2016
 
Institute of Brewing and Distilling - Sensory-and-Consumer-science-masterclas...
Institute of Brewing and Distilling - Sensory-and-Consumer-science-masterclas...Institute of Brewing and Distilling - Sensory-and-Consumer-science-masterclas...
Institute of Brewing and Distilling - Sensory-and-Consumer-science-masterclas...
 

Kürzlich hochgeladen

Top Call Girls Madhapur (7877925207) High Class sexy models available 24*7
Top Call Girls Madhapur (7877925207) High Class sexy models available 24*7Top Call Girls Madhapur (7877925207) High Class sexy models available 24*7
Top Call Girls Madhapur (7877925207) High Class sexy models available 24*7TANUJA PANDEY
 
Top Rated Pune Call Girls Baner ⟟ 6297143586 ⟟ Call Me For Genuine Sex Servi...
Top Rated  Pune Call Girls Baner ⟟ 6297143586 ⟟ Call Me For Genuine Sex Servi...Top Rated  Pune Call Girls Baner ⟟ 6297143586 ⟟ Call Me For Genuine Sex Servi...
Top Rated Pune Call Girls Baner ⟟ 6297143586 ⟟ Call Me For Genuine Sex Servi...Call Girls in Nagpur High Profile
 
VVIP Pune Call Girls Viman Nagar (7001035870) Pune Escorts Nearby with Comple...
VVIP Pune Call Girls Viman Nagar (7001035870) Pune Escorts Nearby with Comple...VVIP Pune Call Girls Viman Nagar (7001035870) Pune Escorts Nearby with Comple...
VVIP Pune Call Girls Viman Nagar (7001035870) Pune Escorts Nearby with Comple...Call Girls in Nagpur High Profile
 
Shake Shack: A Sustainable Burger Strategy
Shake Shack: A Sustainable Burger StrategyShake Shack: A Sustainable Burger Strategy
Shake Shack: A Sustainable Burger Strategykoolestankit
 
VIP Model Call Girls Handewadi ( Pune ) Call ON 8005736733 Starting From 5K t...
VIP Model Call Girls Handewadi ( Pune ) Call ON 8005736733 Starting From 5K t...VIP Model Call Girls Handewadi ( Pune ) Call ON 8005736733 Starting From 5K t...
VIP Model Call Girls Handewadi ( Pune ) Call ON 8005736733 Starting From 5K t...SUHANI PANDEY
 
Kalyani Nagar & Escort Service in Pune Phone No 8005736733 Elite Escort Servi...
Kalyani Nagar & Escort Service in Pune Phone No 8005736733 Elite Escort Servi...Kalyani Nagar & Escort Service in Pune Phone No 8005736733 Elite Escort Servi...
Kalyani Nagar & Escort Service in Pune Phone No 8005736733 Elite Escort Servi...SUHANI PANDEY
 
The Most Attractive Pune Call Girls Tingre Nagar 8250192130 Will You Miss Thi...
The Most Attractive Pune Call Girls Tingre Nagar 8250192130 Will You Miss Thi...The Most Attractive Pune Call Girls Tingre Nagar 8250192130 Will You Miss Thi...
The Most Attractive Pune Call Girls Tingre Nagar 8250192130 Will You Miss Thi...ranjana rawat
 
VIP Model Call Girls Wakad ( Pune ) Call ON 8005736733 Starting From 5K to 25...
VIP Model Call Girls Wakad ( Pune ) Call ON 8005736733 Starting From 5K to 25...VIP Model Call Girls Wakad ( Pune ) Call ON 8005736733 Starting From 5K to 25...
VIP Model Call Girls Wakad ( Pune ) Call ON 8005736733 Starting From 5K to 25...SUHANI PANDEY
 
Hinjewadi ( Call Girls ) Pune 6297143586 Hot Model With Sexy Bhabi Ready Fo...
Hinjewadi ( Call Girls ) Pune  6297143586  Hot Model With Sexy Bhabi Ready Fo...Hinjewadi ( Call Girls ) Pune  6297143586  Hot Model With Sexy Bhabi Ready Fo...
Hinjewadi ( Call Girls ) Pune 6297143586 Hot Model With Sexy Bhabi Ready Fo...tanu pandey
 
Top Rated Pune Call Girls Yashwant Nagar ⟟ 6297143586 ⟟ Call Me For Genuine ...
Top Rated  Pune Call Girls Yashwant Nagar ⟟ 6297143586 ⟟ Call Me For Genuine ...Top Rated  Pune Call Girls Yashwant Nagar ⟟ 6297143586 ⟟ Call Me For Genuine ...
Top Rated Pune Call Girls Yashwant Nagar ⟟ 6297143586 ⟟ Call Me For Genuine ...Call Girls in Nagpur High Profile
 
Call On 6297143586 Pune Airport Call Girls In All Pune 24/7 Provide Call Wit...
Call On 6297143586  Pune Airport Call Girls In All Pune 24/7 Provide Call Wit...Call On 6297143586  Pune Airport Call Girls In All Pune 24/7 Provide Call Wit...
Call On 6297143586 Pune Airport Call Girls In All Pune 24/7 Provide Call Wit...tanu pandey
 
Top Rated Pune Call Girls JM road ⟟ 6297143586 ⟟ Call Me For Genuine Sex Ser...
Top Rated  Pune Call Girls JM road ⟟ 6297143586 ⟟ Call Me For Genuine Sex Ser...Top Rated  Pune Call Girls JM road ⟟ 6297143586 ⟟ Call Me For Genuine Sex Ser...
Top Rated Pune Call Girls JM road ⟟ 6297143586 ⟟ Call Me For Genuine Sex Ser...Call Girls in Nagpur High Profile
 
Call Girls Uruli Kanchan Call Me 7737669865 Budget Friendly No Advance Booking
Call Girls Uruli Kanchan Call Me 7737669865 Budget Friendly No Advance BookingCall Girls Uruli Kanchan Call Me 7737669865 Budget Friendly No Advance Booking
Call Girls Uruli Kanchan Call Me 7737669865 Budget Friendly No Advance Bookingroncy bisnoi
 
VIP Model Call Girls Alandi ( Pune ) Call ON 8005736733 Starting From 5K to 2...
VIP Model Call Girls Alandi ( Pune ) Call ON 8005736733 Starting From 5K to 2...VIP Model Call Girls Alandi ( Pune ) Call ON 8005736733 Starting From 5K to 2...
VIP Model Call Girls Alandi ( Pune ) Call ON 8005736733 Starting From 5K to 2...SUHANI PANDEY
 
The Most Attractive Pune Call Girls Shikrapur 8250192130 Will You Miss This C...
The Most Attractive Pune Call Girls Shikrapur 8250192130 Will You Miss This C...The Most Attractive Pune Call Girls Shikrapur 8250192130 Will You Miss This C...
The Most Attractive Pune Call Girls Shikrapur 8250192130 Will You Miss This C...ranjana rawat
 
Call Girls Sb Road Call Me 7737669865 Budget Friendly No Advance Booking
Call Girls Sb Road Call Me 7737669865 Budget Friendly No Advance BookingCall Girls Sb Road Call Me 7737669865 Budget Friendly No Advance Booking
Call Girls Sb Road Call Me 7737669865 Budget Friendly No Advance Bookingroncy bisnoi
 
WhatsApp Chat: 📞 8617697112 Call Girl Reasi is experienced
WhatsApp Chat: 📞 8617697112 Call Girl Reasi is experiencedWhatsApp Chat: 📞 8617697112 Call Girl Reasi is experienced
WhatsApp Chat: 📞 8617697112 Call Girl Reasi is experiencedNitya salvi
 
Baner Pashan Link Road [ Escorts in Pune ₹7.5k Pick Up & Drop With Cash Payme...
Baner Pashan Link Road [ Escorts in Pune ₹7.5k Pick Up & Drop With Cash Payme...Baner Pashan Link Road [ Escorts in Pune ₹7.5k Pick Up & Drop With Cash Payme...
Baner Pashan Link Road [ Escorts in Pune ₹7.5k Pick Up & Drop With Cash Payme...SUHANI PANDEY
 
VIP Model Call Girls Mundhwa ( Pune ) Call ON 8005736733 Starting From 5K to ...
VIP Model Call Girls Mundhwa ( Pune ) Call ON 8005736733 Starting From 5K to ...VIP Model Call Girls Mundhwa ( Pune ) Call ON 8005736733 Starting From 5K to ...
VIP Model Call Girls Mundhwa ( Pune ) Call ON 8005736733 Starting From 5K to ...SUHANI PANDEY
 

Kürzlich hochgeladen (20)

Top Call Girls Madhapur (7877925207) High Class sexy models available 24*7
Top Call Girls Madhapur (7877925207) High Class sexy models available 24*7Top Call Girls Madhapur (7877925207) High Class sexy models available 24*7
Top Call Girls Madhapur (7877925207) High Class sexy models available 24*7
 
Top Rated Pune Call Girls Baner ⟟ 6297143586 ⟟ Call Me For Genuine Sex Servi...
Top Rated  Pune Call Girls Baner ⟟ 6297143586 ⟟ Call Me For Genuine Sex Servi...Top Rated  Pune Call Girls Baner ⟟ 6297143586 ⟟ Call Me For Genuine Sex Servi...
Top Rated Pune Call Girls Baner ⟟ 6297143586 ⟟ Call Me For Genuine Sex Servi...
 
VVIP Pune Call Girls Viman Nagar (7001035870) Pune Escorts Nearby with Comple...
VVIP Pune Call Girls Viman Nagar (7001035870) Pune Escorts Nearby with Comple...VVIP Pune Call Girls Viman Nagar (7001035870) Pune Escorts Nearby with Comple...
VVIP Pune Call Girls Viman Nagar (7001035870) Pune Escorts Nearby with Comple...
 
Shake Shack: A Sustainable Burger Strategy
Shake Shack: A Sustainable Burger StrategyShake Shack: A Sustainable Burger Strategy
Shake Shack: A Sustainable Burger Strategy
 
VIP Model Call Girls Handewadi ( Pune ) Call ON 8005736733 Starting From 5K t...
VIP Model Call Girls Handewadi ( Pune ) Call ON 8005736733 Starting From 5K t...VIP Model Call Girls Handewadi ( Pune ) Call ON 8005736733 Starting From 5K t...
VIP Model Call Girls Handewadi ( Pune ) Call ON 8005736733 Starting From 5K t...
 
Kalyani Nagar & Escort Service in Pune Phone No 8005736733 Elite Escort Servi...
Kalyani Nagar & Escort Service in Pune Phone No 8005736733 Elite Escort Servi...Kalyani Nagar & Escort Service in Pune Phone No 8005736733 Elite Escort Servi...
Kalyani Nagar & Escort Service in Pune Phone No 8005736733 Elite Escort Servi...
 
The Most Attractive Pune Call Girls Tingre Nagar 8250192130 Will You Miss Thi...
The Most Attractive Pune Call Girls Tingre Nagar 8250192130 Will You Miss Thi...The Most Attractive Pune Call Girls Tingre Nagar 8250192130 Will You Miss Thi...
The Most Attractive Pune Call Girls Tingre Nagar 8250192130 Will You Miss Thi...
 
All Types👩Of Sex Call Girls In Mohali 9053900678 Romance Service Mohali Call ...
All Types👩Of Sex Call Girls In Mohali 9053900678 Romance Service Mohali Call ...All Types👩Of Sex Call Girls In Mohali 9053900678 Romance Service Mohali Call ...
All Types👩Of Sex Call Girls In Mohali 9053900678 Romance Service Mohali Call ...
 
VIP Model Call Girls Wakad ( Pune ) Call ON 8005736733 Starting From 5K to 25...
VIP Model Call Girls Wakad ( Pune ) Call ON 8005736733 Starting From 5K to 25...VIP Model Call Girls Wakad ( Pune ) Call ON 8005736733 Starting From 5K to 25...
VIP Model Call Girls Wakad ( Pune ) Call ON 8005736733 Starting From 5K to 25...
 
Hinjewadi ( Call Girls ) Pune 6297143586 Hot Model With Sexy Bhabi Ready Fo...
Hinjewadi ( Call Girls ) Pune  6297143586  Hot Model With Sexy Bhabi Ready Fo...Hinjewadi ( Call Girls ) Pune  6297143586  Hot Model With Sexy Bhabi Ready Fo...
Hinjewadi ( Call Girls ) Pune 6297143586 Hot Model With Sexy Bhabi Ready Fo...
 
Top Rated Pune Call Girls Yashwant Nagar ⟟ 6297143586 ⟟ Call Me For Genuine ...
Top Rated  Pune Call Girls Yashwant Nagar ⟟ 6297143586 ⟟ Call Me For Genuine ...Top Rated  Pune Call Girls Yashwant Nagar ⟟ 6297143586 ⟟ Call Me For Genuine ...
Top Rated Pune Call Girls Yashwant Nagar ⟟ 6297143586 ⟟ Call Me For Genuine ...
 
Call On 6297143586 Pune Airport Call Girls In All Pune 24/7 Provide Call Wit...
Call On 6297143586  Pune Airport Call Girls In All Pune 24/7 Provide Call Wit...Call On 6297143586  Pune Airport Call Girls In All Pune 24/7 Provide Call Wit...
Call On 6297143586 Pune Airport Call Girls In All Pune 24/7 Provide Call Wit...
 
Top Rated Pune Call Girls JM road ⟟ 6297143586 ⟟ Call Me For Genuine Sex Ser...
Top Rated  Pune Call Girls JM road ⟟ 6297143586 ⟟ Call Me For Genuine Sex Ser...Top Rated  Pune Call Girls JM road ⟟ 6297143586 ⟟ Call Me For Genuine Sex Ser...
Top Rated Pune Call Girls JM road ⟟ 6297143586 ⟟ Call Me For Genuine Sex Ser...
 
Call Girls Uruli Kanchan Call Me 7737669865 Budget Friendly No Advance Booking
Call Girls Uruli Kanchan Call Me 7737669865 Budget Friendly No Advance BookingCall Girls Uruli Kanchan Call Me 7737669865 Budget Friendly No Advance Booking
Call Girls Uruli Kanchan Call Me 7737669865 Budget Friendly No Advance Booking
 
VIP Model Call Girls Alandi ( Pune ) Call ON 8005736733 Starting From 5K to 2...
VIP Model Call Girls Alandi ( Pune ) Call ON 8005736733 Starting From 5K to 2...VIP Model Call Girls Alandi ( Pune ) Call ON 8005736733 Starting From 5K to 2...
VIP Model Call Girls Alandi ( Pune ) Call ON 8005736733 Starting From 5K to 2...
 
The Most Attractive Pune Call Girls Shikrapur 8250192130 Will You Miss This C...
The Most Attractive Pune Call Girls Shikrapur 8250192130 Will You Miss This C...The Most Attractive Pune Call Girls Shikrapur 8250192130 Will You Miss This C...
The Most Attractive Pune Call Girls Shikrapur 8250192130 Will You Miss This C...
 
Call Girls Sb Road Call Me 7737669865 Budget Friendly No Advance Booking
Call Girls Sb Road Call Me 7737669865 Budget Friendly No Advance BookingCall Girls Sb Road Call Me 7737669865 Budget Friendly No Advance Booking
Call Girls Sb Road Call Me 7737669865 Budget Friendly No Advance Booking
 
WhatsApp Chat: 📞 8617697112 Call Girl Reasi is experienced
WhatsApp Chat: 📞 8617697112 Call Girl Reasi is experiencedWhatsApp Chat: 📞 8617697112 Call Girl Reasi is experienced
WhatsApp Chat: 📞 8617697112 Call Girl Reasi is experienced
 
Baner Pashan Link Road [ Escorts in Pune ₹7.5k Pick Up & Drop With Cash Payme...
Baner Pashan Link Road [ Escorts in Pune ₹7.5k Pick Up & Drop With Cash Payme...Baner Pashan Link Road [ Escorts in Pune ₹7.5k Pick Up & Drop With Cash Payme...
Baner Pashan Link Road [ Escorts in Pune ₹7.5k Pick Up & Drop With Cash Payme...
 
VIP Model Call Girls Mundhwa ( Pune ) Call ON 8005736733 Starting From 5K to ...
VIP Model Call Girls Mundhwa ( Pune ) Call ON 8005736733 Starting From 5K to ...VIP Model Call Girls Mundhwa ( Pune ) Call ON 8005736733 Starting From 5K to ...
VIP Model Call Girls Mundhwa ( Pune ) Call ON 8005736733 Starting From 5K to ...
 

Eating for tomorrow - China

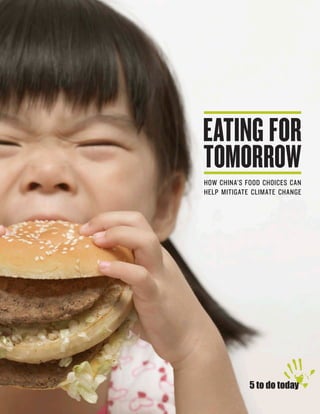
  • 1. 1 E AT I N G F O R T O M O R R O W HOW CHINA’S FOOD CHOICES CAN HELP MITIGATE CLIMATE CHANGE
  • 2. 2 5 T O D O T O D AY ABOUT 5 TO DO TODAY: 5 To Do Today is a campaign initiated in China to influence attitudes, motivate behavioral change and create support for climate action. We believe that individuals can make a significant, collective impact by modifying daily routines to reduce their environmental footprint. Our mission is to minimize the impacts of climate change by urging individuals to reduce their energy use and overall resource consumption. The campaign asks all of us to take five simple actions every day to reduce energy use and consumption. The current focus is on transportation and food choices. 5 To Do Today is a campaign of WildAid, an organization which has a proven track record of success in influencing attitudes, inciting behavioral change, and creating collective support for action to protect endangered wildlife. www.5todo.org CONTACT INFORMATION: 5 To Do Today 333 Pine St. #300 San Francisco, CA 94104 Matt Grager Climate Program Officer grager@wildaid.org PROJECT TEAM: Betty Chong, Climate Program Officer Jenny Du, Climate Program Officer Matt Grager, Climate Program Officer Jaclyn Sherry, Executive Assistant Hugo Ugaz, Graphic Designer SPECIAL THANKS TO Avatar Alliance Foundation, Karen Bouris, Brighter Green, California Environmental Associates, Chatham House, Chinese Nutrition Society, Climate Nexus, The David and Lucile Packard Foundation, Amy Dickie, Flora L. Thornton Foundation, Samuel Lee Gammage, The Grantham Foundation for the Protection of the Environment, Mia MacDonald, My Plate My Planet, Rachel Potter, Walter Reid, Maria Wilhelm, Yi Jian. CONTENTS EXECUTIVE SUMMARY 3 LIVESTOCK & GREENHOUSE GAS 4 DEMAND FOR MEAT & DAIRY 6 LAND USE ISSUES 8 WATER SUPPLY 10 FOOD SUPPLY 11 RISKS TO HUMAN HEALTH 12 OTHER IMPACTS 14 CLIMATE CHANGE IMPACTS IN CHINA 15 SURVEY FINDINGS 16 DIET FOR A TWO-DEGREE WORLD 18 5 TO DO TODAY & CNS 20 CONSUMER RECOMMENDATIONS 22 CHINA IS READY TO LEAD 23 ENDNOTES & APPENDIX 24
  • 3. 3 E AT I N G F O R T O M O R R O W EXECUTIVE SUMMARY WHY EATING LESS MEAT MATTERS: LIVESTOCK AGRICULTURE CONTRIBUTES 14.5% OF ALL GHG Many experts predict that keeping global warming below the critical two degree Celsius threshold is impossible without a significant shift in diet. 1 Livestock agriculture produces more greenhouse gas (GHG) than all global transportation combined.2 By 2050, the predicted increase in meat and dairy consumption would result in a further 80% growth of agriculture-related emissions.3 DEMAND IS RISING FAST By 2050, rising incomes, growing populations and urbanization are projected to increase meat consumption by 76% and dairy consumption by 65%.4 LIVESTOCK AGRICULTURE DRIVES ENVIRONMENTAL CRISES In addition to GHG emissions, livestock agriculture has significant environmental impacts, including deforestation, desertification, soil degradation and pollution, water pollution, ocean warming and acidification, ocean dead zones, and biodiversity loss. Deforestation and ocean warming further exacerbate climate change, while desertification and soil degradation can reduce agricultural output. LIVESTOCK AGRICULTURE IS UNSUSTAINABLE The world cannot meet the water and caloric needs of a growing population if current levels of livestock agriculture are continued. The practice involves 33% of all freshwater use, 30% of all ice-free land, 33% of all calories produced, and 50% of all protein, resources which all may be negatively impacted by climate change.5,6 WE CAN ACT NOW Unlike reducing GHG emissions from energy or transportation, which require developing new technologies and building new infrastructure, reducing emissions from livestock agriculture can be immediately addressed at the individual level. Simple and direct steps, such as reducing portion size, eliminating food waste, substituting lower-carbon meats (e.g. chicken for beef) and increasing the number of meatless meals consumed can all help lower emissions. LOWER EMISSIONS, BETTER HEALTH The benefits of eating less meat go beyond the climate and environment – it can also improve your health. High meat consumption is linked to non-communicable diseases, such as diabetes, obesity, heart disease and cancer. WHY CHINA CAN LEAD: CHINA PLAYS A KEY ROLE Due to its large population and rapid rates of economic growth, China is essential to any efforts to curb GHG emissions, especially from meat consumption, in which it already leads the world. China consumes 28% of meat and 50% of pork, globally.7,8 Beef consumption is expected to rise 47% by 2030. Yet China is new to mass meat consumption. Average per capita meat consumption has risen six-fold since 1978 to reach 63 kg and could rise another 30 kg by 2030.9 IT HAS INCENTIVE TO ACT Reducing meat consumption can benefit China from a health, resource, climate and geopolitical perspective. Over 50% of the population is suffering from environmental-related illnesses, many of which are made worse by higher meat consumption, such as heart disease, obesity, cancer and diabetes. China has 20% of the global population, but 33% of the world’s diabetics.10 Child obesity has quadrupled in a single generation. The rising healthcare costs associated with these emerging crises will be significant. IT HAS POLITICAL AND PUBLIC WILL In May 2016, the Chinese Nutrition Society (CNS) issued its most recent ten-year dietary guidelines, which recommend reducing meat consumption by over 50%. A 2015 5 To Do Today survey showed that 83% of middle-class urban residents are willing to eat vegetarian at least one day each week, with 62% willing to do so at least two days per week. The survey also showed high awareness of the health impacts of meat consumption and moderate awareness of the environmental impacts. AN OPPORTUNITY TO LEAD THE WORLD Were the CNS dietary recommendations to be adopted nationally, emissions from meat consumption in China would decrease by an amount equal to 1.5% of global emissions or 6% of Chinese emissions. Without a dietary shift, emissions from meat consumption in China would rise over 50% by 2030 to equal more GHG than the 2012 national emissions of every country except China, the United States, India and Russia.
  • 4. 4 5 T O D O T O D AY As the main driver of climate change, greenhouse gas (GHG) emissions are typically associated with fossil fuels used for energy, transportation or industry. Greenhouse gases such as carbon dioxide, methane and nitrous oxide trap heat in the Earth’s atmosphere, thus raising the temperature of the planet. Though each of these gases traps heat at different rates, they are all calculated in their equivalent amount of carbon dioxide, known as the carbon equivalent (CO2eq). For example, methane and nitrous oxide, two GHGs emitted during the livestock agriculture process, are 25 and 298 times more p o w e r f u l t h a n c a r b o n d i o x i d e , respectively.11 Many people will be surprised to learn that burning fossil fuels is not the only major source of GHGs. Emissions from livestock are calculated to be at least 14.5% of the global total.12,13 That is greater emissions than all of global transportation – more than every car, truck, train, plane and ship on Earth combined. Animal feed production and the land-use change required for it accounts for 30% of all livestock emissions.14 The largest source (39%) is from enteric fermentation–the gaseous releases of cows and sheep. Per unit of protein, beef, pork, and chicken emit 150, 25, and 20 times the GHG of soybeans.15 Because livestock emissions come mainly from large ruminant animals, the 60 billion chickens each year contribute only 10% of livestock emissions while the 1.4 billion cows contribute 66%.16 In addition to being less flatulent than cows or sheep, chickens convert feed more efficiently and use less land, both of which reduce their overall emissions. LIVESTOCK & GREENHOUSE GAS FIG. 1: GHG EMISSIONS FROM LIVESTOCK Source: Gerber, et. al. “Tackling Climate Change Through Livestock,” 2013 5% ENERGY USE 6% PASTURE 24% FEED CROPS 26% MANURE 39% ENTERIC FERMENTATION “THE GHG CONTRIBUTIONS FROM LIVESTOCK ARE GREATER THAN EVERY CAR, TRUCK, TRAIN, PLANE AND SHIP ON EARTH COMBINED.”
  • 5. 5 E AT I N G F O R T O M O R R O W A single factory farm with 1,000 head of cattle produces waste equivalent to a city of 164,500 people. 17 In 2011, there were 1.4 billion cows on Earth.18 Photo: Alamy MEAT ALONE CAN BUST THE CARBON BUDGET Governments and experts, including the Intergovernmental Panel on Climate Change, have determined that the worst impacts of climate change are likely to be avoided if warming is stopped below two degrees Celsius above 19th century levels. Reducing emissions from our meat and dairy consumption is important not only because it represents a significant proportion of total emissions, but also because of how little GHG we can emit in the future while keeping warming below this limit. As it stands now, the world has already warmed a full one degree Celsius.19 In order to understand how much GHG can be released and still stay below two degrees, the carbon budget was created. In order to have a likely chance (>66%) of staying below two degrees warming, the world can emit only 870 gigatonnes of CO2eq (GtCO2eq) between 2009 and 2100.20 With current annual global emissions hovering around 50 GtCO2eq, the world will push past the two-degree threshold by 2030 without significant changes. One expert, Dr. Richard Oppenlander, goes so far as to say that even if livestock were the only source of GHG emissions, we would exceed the carbon budget as early as the 2030s.21 While many people understand the importance of transitioning away from fossil fuels for energy production or transportation, few publicly suggest a similar shift away from meat consumption despite its annual contribution of at least 7 GtCo2eq.22 Compared to reducing the same amount from transportation, energy or industry, reducing emissions from a g r i c u l t u r e r e q u i r e s l i t t l e n e w infrastructure or technology. It could be accomplished immediately with a worldwide decision to shift away from meat consumption. For more information on mitigation scenarios in agriculture please see page 26. *Soybean calculation reflects a no-tillage cultivation in moderately degraded savannah. FIG. 2: GHG EMISSIONS PER KG OF MEAT(KGCO2EQ) Source: Chatham House “Changing Climate, Changing Diets,” 2015 10 20 BEEF 56.6 31.3 8.8 7 3.9 2.6 5* PORK EGGS CATTLE MILK SOYBEANLAMB CHICKEN 30 40 50 60 70 80 0
  • 6. 6 5 T O D O T O D AY Due to the growing population, rising incomes and urbanization, meat and dairy consumption are increasing around the globe. By 2050, meat and dairy consumption are expected to rise by 76 and 65% respectively,23 contributing to an 80% increase in agricultural emissions.24 These emissions, plus the requirements for large amounts of land, water and crops to raise livestock, makes the growth of meat consumption unsustainable. This increase is happening fastest in developing countries as a part of a larger trend known as the nutrition transition. Meat consumption in western countries remains higher per capita, but has mostly plateaued or even declined slightly.25 The nutrition transition occurs because rising incomes allow developing countries to afford higher-priced food, which often includes less whole foods and more food prepared outside the home. Urbanization combined with global trade also makes Western-style diets more common, as they are better marketed and cheaper than ever before. Due to the combination of high population and increasing per capita consumption, China will be the largest source of increased demand. It currently consumes twice the amount of the second place United States and is projected to triple the US total by 2030. Even Brazil, where per capita consumption doubled from 40 kg to over 80 kg since 1980, represents only a small fraction of the total demand in China.26 Increased demand for livestock is not new. Over the fifty years between 1960 and 2010, global meat production rose from 150 million tonnes to 300 million tonnes, while average consumption quadrupled from 10kg to over 40kg.27 In order to meet rising demand for livestock products, the world has had to produce more crops by DEMAND FOR MEAT & DAIRY 10,000 20,000 2010 2014 2018 2022 2026 2030 30,000 40,000 50,000 60,000 70,000 90,000 100,000 110,000 120,000 130,000 80,000 0 FIG. 3: ANNUAL MEAT & DAIRY CONSUMPTION BY COUNTRY (1,000S OF TONNES) Source: California Environmental Associates, “Dietary Trends in Asia,” 2013 CHINA UNITED STATES BRAZIL INDIA “CHINA WILL BE THE LARGEST SOURCE OF INCREASED DEMAND. IT CURRENTLY CONSUMES TWICE THE AMOUNT OF THE SECOND PLACE US AND IS PROJECTED TRIPLE THE US TOTAL BY 2030.”
  • 7. 7 E AT I N G F O R T O M O R R O W increasing yields per hectare and cultivating more land, neither of which will be feasible in the near future. The Green Revolution increased yields in the 1960-80s by creating and mainstreaming genetically modified crops, pesticides and chemical fertilizers, while deforestation made the necessary farmland available. Further deforestation will cost the planet vital carbon sinks and storage, while additional chemical inputs could degrade critical topsoil that is already overstressed in addition to contributing its own GHG emissions. MEAT CONSUMPTION IN CHINA Since 1978, the average annual income in China has grown from $200 to $6,000.29 The average Chinese consumer now eats 63kg per year,30 six times as much as in 1978,31 and consumption is predicted to rise an additional 30 kg by 2030.32 This growth is happening four times faster than the next fastest-growing consumer, Brazil. China now consumes 28% of the world’s meat and dairy products and half of its pork.33 The predicted rise in per capita consumption would be the equivalent of adding another United States to total global demand for meat and dairy products by 2030.34 The study that predicts a 30 kg increase also predicts that beef consumption will make up 10% of that rise, from 5 kg per year per person in 2010 to 8 kg in 2030.35 This rise would mean an additional 233 megatonnes (MtCO2eq) in GHG emissions annually. The predicted 20 kg rise in pork consumption by 2030 would add an estimated 244 MtCO2eq to annual GHG emissions.36 Out of three recent projections for per capita demand for meat in China in 2030, two would result in an increase in GHG emissions from meat consumption of over 50%. For more information on GHGs from meat consumption in China see page 26. In 1992, the first McDonalds to opened in Beijing. Today, there more than 2,000 McDonalds locations across China. 28 Photo: Alamy
  • 8. 8 5 T O D O T O D AY LAND USE ISSUES With demand for meat and dairy set to rise by 76 and 65%, what will it take in terms of land, crops and water to meet the demand for livestock of 9.7 billion people in 2050 and 11.2 billion by 2100?37 Whether looking at land, water and crops individually or as an ecosystem it is clear that there will not be enough resources to meet the growing demand for livestock agriculture if feeding the growing population is also to be achieved. As with the crop and water inputs, more land is required to produce beef than any other meat, at 30 square meters per kilo. Both chicken and pork require approximately 20 square meters, still much higher than soy, fruits, potatoes and vegetables, which require less than two square meters.38 In aggregate, the large land use requirements for livestock presents many challenges, especially as demand for meat and dairy grows. Livestock agriculture uses 70% of all agricultural land and 30% of all the ice- free land on Earth.39 If the entire global population were to eat the average North American diet, the resulting tripling of animal-based protein consumption would require at minimum a doubling of cropland.40 By 2050 an area of forests the size of India will have been purposefully deforested mainly for agriculture, releasing over 100 GtCO2eq, or one-sixth of the planet’s remaining carbon budget.41 LAND USE ISSUES IN CHINA: • China has 20% of the world’s population but only 7% of its arable land.42 • Each year, 400 million people in China are affected by desertification, which caused 24,000 towns and villages to vanish between 1950 and 2000.43 • In 2008, an official survey estimated that China was losing 4.5 billion tons FIG. 4: LAND NEEDED FOR PRODUCTION OF 1 KG FOOD (SQUARE METERS) Source: Okologie + Landbau 159, 3/2011, p40–42 www.soel.de 5 10 BEEF PORK EGGSCHICKEN 15 20 25 30 35 0 FRUITS VEGETABLES of topsoil annually due to wind and water erosion, or five times as much as was lost annually during the US dustbowl of the 1930s.44 China now has half the arable land per person compared with 50 years ago. • As China has run out of arable land to grow feed at home, it has begun buying and leasing farmland overseas. In 2012, the International Institute for Sustainable Development reported that it identified 54 Chinese overseas agricultural projects totalling over 18,000 square miles–an area 40% larger than Taiwan–in countries ranging from Ukraine to Zimbabwe.45 DEFORESTATION Livestock agriculture contributes to deforestation in three ways. First, forests are often cleared for grazing. This is the number one cause of deforestation in nearly every Amazon country, and accounts for at least 70% of Amazon forest loss.46 Second, forests must be cleared to grow crops, mainly soy, used to feed livestock. Lastly, by causing general climate change, the GHG emissions from livestock accelerate forest loss already underway. Livestock agriculture has had a significant impact on the world’s forests, particularly in Central and South America. In the past 40 years, over 40% of Central American forests have been cut down and an area of rainforest twenty times larger than Taiwan has been cleared from the Amazon, predominantly for livestock and its feed.47 A further seven football fields worth of land is cleared every minute to make room for livestock.48
  • 9. 9 E AT I N G F O R T O M O R R O W FIG. 5: CAUSES OF DEFORESTATION IN THE BRAZILIAN AMAZON 2000-2005 Source: H.K. Gibbs, 2009 “BY 2050 AN AREA OF FORESTS THE SIZE OF INDIA WILL HAVE BEEN PURPOSEFULLY DEFORESTED MAINLY FOR AGRICULTURE.” A soy plantation intrudes into the Brazilian Amazon rainforest. Chinese imports account for 64% of the global soy trade and grew 253% between 2003 and 2012. Soybean meal, an ingredient in animal feed represents nearly 80% of Chinese soy imports.49 Photo: Alamy LAND DEGRADATION Livestock agriculture contributes to other forms of land degradation, including desert- ification and soil degradation, which reduce the available space and nutrients needed for growing food. Each year, 20 million acres of arable land are lost to desertification, 35 times the historical rate.50 Livestock agriculture is responsible for about one-third of this total loss, or an area only slightly smaller than Hainan Island. In that last 40 years, nearly one-third of the world’s arable land has been lost, and 25% of the Earth’s total land area is now either highly degraded or currently undergoing high rates of degradation.51 The land lost to desertification and degradation directly diminishes a key resource for food production. Total land lost to degradation dating back to only 1995 would be sufficient to feed the current global population a plant-based diet year- round.52, 53 65–70% CATTLING RANCHING 20–25% SMALL-SCALE AGRICULTURE 5–10% LARGE-SCALE AGRICULTURE 2–3% LOGGING 1–2% OTHER
  • 10. 1 0 5 T O D O T O D AY WATER SUPPLY In total, one-third of all freshwater used globally is for animal agriculture.54 Agriculture overall is responsible for 70% of all freshwater use and 93% of global water depletion. By 2030 humanity’s annual global water requirements will rise by 50% and exceed sustainable water supplies by 40%.55, 56 The meat and dairy we put on our plate are inextricably linked with the exploitation of this resource. As with all other inputs, water usage varies depending on the type of livestock. Switching from beef, the largest user at over 15,000 liters of water per kilogram of meat, to any other type of meat does more for the planet than switching from any other type of meat to plant-based proteins. Compared to cereals, beef, pork and chicken use 9, 4 and 3 times as much water per kilogram.57 The World Bank predicts that 2.8 billion people will live in regions with absolute water scarcity by 2025.58 Yields from rainfed agriculture, which supplies 60% of the world’s food,59 are predicted to be down by 50% as early as 2020 due to climate change.60 Up to one third of the world’s largest aquifers are already being drained faster than they are replenished, most of them concentrated in food producing regions that support over 25% of the planet.61 The food sector is responsible for about half of all organic water pollutants. In developing countries, up to 90% of waste water, including that which results from agriculture, flows untreated into oceans, lakes, rivers and streams.62 WATER ISSUES IN CHINA • China irrigates over half its farmland, five times as much as the US.63 Agriculture uses more than 60% of water in China. Official government estimates say that 55% of this water is lost through leakage in the system, meaning as much as 33% of all China’s water is wasted through leakage in an inefficient agricultural system.64 Many major cities in China, including Beijing, which has experienced 31 consecutive years of drought, are suffering from rapidly falling water tables and subsidence.65 • China has less than one-third the global average of per capita water resources.66 • One-third of all major rivers and 60% of all groundwater are polluted, which has resulted in 300 million people drinking contaminated water and almost 200 million suffering from water-related illnesses annually between 2007 and 2012.67 • Agriculture is responsible for 42% of water pollution in China, and 67% of both nitrogen and phosphorous discharge, pointing to over-use of fertilizer and pesticides as well as poor manure management practices.68 FIG. 6: LITERS OF WATER PER KG OF MEAT Source: Institution of Mechanical Engineers CHICKEN CHEESEBEEF SHEEP PORK BUTTER 15,400 10,400 6,000 5,500 4,300 3,200 A farmer tills a drought affected field in Shanxi Province, China. In 2010, agriculture used 61% of all freshwater in the country.69 Photo: Alamy FIG. 7: WATER USE BY SECTOR IN CHINA 2010 Source: National Bureau of Statistics, China 61% AGRICULTURE 2% OTHER 24% INDUSTRY 13% MUNICIPAL
  • 11. 1 1 E AT I N G F O R T O M O R R O W FOOD SUPPLY Currently, 25% of all crops, 33% of all calories and 50% of all protein globally go to feed livestock. 70 Livestock animals consume 40-50% of global corn production and 80% of soy.71 By 2050, as much as 50% of crops will be fed to livestock while climate change threatens to reduce yields by between 13 and 50% in the same time frame. 72 In the context of world hunger and food security, grains fed to livestock are misallocated. 82% of undernourished people live in countries that export livestock or export crops for livestock feed.73 In 2013, scientists from the University of Minnesota concluded that if all food crops were fed directly to humans rather than livestock, 70% more food could be added to the global supply. This supply would be enough to feed an additional four billion people - the same number of people the UN estimates will be added to the global population by 2100.74 The world currently produces enough crops to provide every person with a daily diet of 2,700 calories.75 CROP ISSUES IN CHINA FIG. 8: GRAIN REQUIRED FOR 1 KG OF MEAT Source: USDA 1KG CHICKEN = 2.3KG 1KG: PORK = 5.9KG 1KG: BEEF = 13KG 1KG: LAMB = 21KG MILLIONTONS FIG. 9: SOYBEAN PRODUCTION, CONSUMPTION, AND IMPORTS IN CHINA, 1974-2011 Source: USDA 10 20 20041974 1984 1994 30 40 50 60 70 90 80 0 CONSUMPTION IMPORTS PRODUCTION • In 2011, China used approximately 70% of its total corn production for livestock feed and only 5% for food.76 • China will have a deficit of 19-32 million tons of corn by 2022, requiring imports approximately equal to a third of the entire world corn trade today.77 • China will account for 40% of the growth in agricultural imports between now and 2050.78 • Only 12% of total cereals are traded on the global market, of which China is the largest buyer. Total soy imports increased by 253% from 2003-2012, making China the largest importer of soy, with purchases on the global market 5 times larger than the next largest importer, the EU.79
  • 12. 1 2 5 T O D O T O D AY Meat plays a central role in most traditional and modern food cultures, and consumption continues to grow in many developing coun- tries. With that growth comes a number of related health issues. Risks of cardiovascular disease, obesity, diabetes and cancer all in- crease with higher levels of meat consump- tion. Dr. Frank Hu of Harvard University School of Public Health wrote that there is “clear evidence that regular consumption of red meat, especially processed meat, contrib- utes substantially to premature death.”80 On average, vegetarian men live 9.5 years longer than male meat-eaters, and women 6.1 years longer.81 Vegetarians have also been shown to be 32% less likely to develop heart disease, 40% less likely to develop cancer, have a lower risk of diabetes and have a lower body mass index (BMI). 82 The lower BMI is not attributable to eating less overall, as a 2010 study showed that even between people who consume the same amount of calories, the meat consumer will gain an additional 2kg over five years compared to the vegetarian.83 This helps explain why on average adult vegans are 4.5 to 9 kg lighter than adult meat-eaters.84 HEALTH IMPACTS IN CHINA As meat consumption grows in China, so too do the related health problems. According to the Chinese Nutrition Society, the biggest health problems in China are obesity, diabetes, hypertension, high salt intake, and nutrient deficiency. In 2010, 85% of deaths in China were the result of non-communicable diseases,85 including many of those listed above. Globally, the average is 60%. Many of these diseases, such as high blood pressure, heart disease, diabetes and several forms of cancer are linked with the over consumption of meat. China is home to over 100 million diabetic patients, more than any other country. In the adult population, 11% suffer from RISKS TO HUMAN HEALTH FIG. 10: OVERWEIGHT POPULATION IN CHINA Source: University of Washington, Institute of Health Metrics and Evaluation 5% 10% BOYS WOMEN MEN 15% 20% 25% 30% 0 GIRLS 2013 1980 “LIKE THEIR AMERICAN COUNTERPARTS, MORE PROCESSED FOOD, MORE MEAT, MORE OILS, FATS AND SUGARS ARE MAKING CHINESE CHILDREN DANGEROUSLY OVERWEIGHT.”
  • 13. 1 3 E AT I N G F O R T O M O R R O W Non-communicable diseases such as diabetes, cancer, hypertension and obesity cause 85% of deaths in China, 25 percentage points higher than the global average.85 Photo: World Health Organization diabetes, while another 50% are pre- diabetic, putting them at increased risk for cardiovascular disease, kidney disease and cancer.86 As a result, the percentage of national healthcare expenses used to treat diabetes in China rose from 1.96% in 1983 to 18.2% in 2007.87 The average Chinese person is now 8 to 15 kg heavier than a generation ago.88 Obesity is defined as a BMI of over 30, while overweight falls between 25 and 30. China is now home to the second most obese individuals after the US, which has 62 million.89 Meat consumption can also combine with environmental factors to undermine human health. In China, at least half of the population is suffering from chronic and environmental related illnesses while 200 million more are directly exposed to occupational hazards.90 Like their American counterparts, more processed food, more meat, more oils, fats and sugars are making Chinese children dangerously overweight. In Beijing, Chongqing and Shanghai, children now consume nearly 30% of their calories from processed packaged foods.91 Between 1980 and 2013 the rate of children that are overweight quadrupled to 20% and the rate of pre-diabetic children rose to 15%.92 Chinese adolescents now have a diabetes rate three times that of their US peers.93 Partly due to the growth in childhood obesity, China could be home to 800 million overweight or obese citizens by 2030.94 “ON AVERAGE, VEGETARIAN MEN LIVE 9.5 YEARS LONGER THAN MALE MEAT- EATERS, AND WOMEN 6.1 YEARS LONGER.”
  • 14. 1 4 5 T O D O T O D AY OTHER IMPACTS OF LIVESTOCK OCEAN DEAD ZONES Modern livestock agriculture has not only transformed the terrestrial landscape, it is also rapidly changing our oceans. In addition to the problem of overfishing, the planet’s marine ecosystems are coping with acidifi- cation and a growing number of dead zones, the primary cause of which is nitrogen and phosphorous from agricultural runoff.96 Dead zones have doubled in frequency every 10 years since the 1960s and now number more than 400 worldwide, including a 5,000 square mile dead zone in the Gulf of Mexico caused by agricultural and industrial runoff from the Mississippi River; and, a 145,000 square mile dead zone in the Baltic Sea.97 China’s Bohai Sea is also considered a dead zone. Despite the fact that 20% of the nations sewage is dumped there, its main pollutant source is runoff from fertilizer. 98 In total, ocean dead zones now cover over 1.7 million square miles,99 or an area the size of South Asia, including Bangladesh, India, Nepal, Pakistan and Sri Lanka. BIODIVERSITY LOSS Over the 3.5 billion year history of life on Earth, there have been five major extinction events in which the variety and number of living species have dropped dramatically, up to 90%. Scientists now agree that the planet is currently in the middle of the sixth major extinction event, and tellingly, that humans are its cause. Scientists call this the Anthropocene, the epoch where humans have wielded the power to alter the environment on Earth significantly. Humans have transformed the landscape, added GHG and pollutants to the air, changed weather patterns, and increased the temperature and sea level. In this process, we increased the rate of The Bohai Sea in Northern China, once known as the “Emperor’s Fishery,” is now considered the most polluted waterway in China. 95 Photo: European Space Agency.
  • 15. 1 5 E AT I N G F O R T O M O R R O W An endangered golden snub-nosed monkey bares its teeth in the Qinling Mountains of China. It is estimated that only 3,000 of the species remain due to habitat loss, including deforestation. Photo: Alamy CLIMATE CHANGE IMPACTS IN CHINA The combination of a large population concentrated on the coast, a relative lack of arable land and persistent water issues make China particularly vulnerable to climate change, especially as it relates to food security. China’s own National Development and Reform Commission acknowledged the following in a December 2013 Report: “Our country is a developing nation with a large population, complex climate conditions and a weak environment (situation). The mission to deal with climate change is very arduous, but knowledge in society and ability to do this are weak across the board.”105 Zheng Guoguang, director of China’s meteorological administration, reported in early 2015 that among the most pressing climate related issues in China will be food insecurity, extreme weather, cities at risk of submersion, and the spread of illnesses, including dengue fever and malaria. Other climate change impacts in China include: • Approximately 85 million people in China currently live on land that will be submerged or chronically flooded by 2100. 106 Due to urbanization, the population growth of coastal cities is occurring three times the national rate and could reach between 200 and 245 million by 2060.107 • By 2050, 40 to 200 million people could be internally displaced within China due to climate change. 108 • Temperatures on the Tibetan Plateau are rising at a rate over four times faster than the global average, partially due to its arid elevation and partially due to the loss of reflectivity from rapidly melting glaciers, which are expected to be 50% depleted by 2100. The 1.5 billion people who receive their water supply from these glaciers will increase to 2.2 billion by mid-century. 109 In the short term this glacial melt will increase the outflow of some of the world’s major rivers, including the Yangtze and Yellow rivers in China, the Brahmaputra, Ganges and Indus in India, and the Irrawaddy and Mekong in Southeast Asia, until approximately 2050. However, combined with more unpredictable monsoon seasons, an increase in glacial melt will likely result in substantial flooding rather than alleviating water shortages. • Globally, climate change will increase the frequency, severity and unpredictability of natural disasters that include floods, droughts and storms. Recent experiences can be expected to continue in China where the number of natural disasters from 2000-2014 rose 57% from the previous 15-year period. 110 extinction to between 1,000 and 10,000 times its predicted level without human interference (the background rate).100 This is the largest extinction event since a meteor wiped out the dinosaurs 65 million years ago and continues to exterminate 137 species every day.101 Habitat destruction from grazing livestock and feed crops impacts 86% of threatened mammals, 88% of amphibians and 86% of all birds.102 Further estimates are that one in eight birds, one in four mammals and one in three amphibians are facing an extremely high risk of extinction in the near future.103 According to the Alliance for Global Conservation, 36% of all species on Earth are now threatened with extinction.104 Livestock agriculture also contributes to biodiversity loss in other ways, including the hunting of predator species, such as wolves or jaguars, to protect livestock and the use of pesticides, herbicides and chemical fertilizers that pollute the environment, interfere with animal reproduction and poison waterways.
  • 16. 1 6 5 T O D O T O D AY SURVEY FINDINGS FIG. 11: FACTORS CONSIDERED IN FOOD CHOICES FINDINGS: DECISION-MAKING NUTRITION TASTE FOOD SAFETY IN-SEASONPRICE GMOORGANIC LOCATION 60 40 20 0 43.4% 15.7% 29% 2.1% 0.6%1.2%6% 1.5% FINDINGS: IMPACT AWARENESS 88.1 59.7 67 49.8 39.5 36.7 35.6 35.6 54 50 48 49 63 86 HEALTH CROP & LAND RESOURCES WATER RESOURCES MITIGATING CLIMATE CHANGE GHG EMISSIONS DEFORESTATION OCEAN DEAD ZONES, HABITAT LOSS, SPECIES EXTINCTION FIG. 12: PERCENTAGE OF RESPONDENTS AWARE OF THE IMPACT OF LIVESTOCK ON THE FOLLOWING ISSUES: 100 80 60 40 20 0 OFFLINE ONLINE AWARENESS, ATTITUDES & HABITS IN CHINA: In December 2015, 5 To Do Today commissioned Ipsos to conduct a direct interview 700-person survey across 11 Tier 1 and Tier 2 cities in China, and Intage to conduct a broader online survey of 5,000 people across 13 Tier 1, Tier 2 and Tier 3 cities. KEY FINDINGS: • 98% of survey respondents had eaten meat in the last month. 95.3% had eaten eggs, while 87.2% had consumed dairy products. • Online, 6% reported being vegetarian. Of the non-vegetarians, 64% considered their meat consumption to be at “normal levels.” • 19.2% of men and 13.7% of women dined out more often than they dined at home. Younger people reported dining out more often than older ones. • Beef and lamb are more likely to be eaten by men than by women and more likely to be eaten at home than while dining out. • 78.6% report consuming 1 kg of beef or less each week. 75.1% report consuming 1 kg of lamb or less per week. • Nutrition, taste, and food safety were the highest ranked factors in food choice. • 88.1% of respondents were aware of the negative health impacts of eating meat. • Based on health, environment or resource factors, 83.7% were willing to adopt a vegetarian diet for at least one day each week. 62.4% were willing to do so two or more days each week. • 22.4% were unwilling to reduce beef or lamb consumption based on the belief that it would be bad for their personal health or nutrition. Men were twice as likely to refuse to reduce consumption as women.
  • 17. 1 7 E AT I N G F O R T O M O R R O W Employees line up for lunch at the Huawei cafeteria in Hong Kong. Photo: Alex Hofford HEALTH FIG. 14: WHY PEOPLE REFUSE TO EAT LESS BEEF AND/OR LAMB FIG. 13: WHY PEOPLE ARE WILLING TO EAT LESS BEEF AND/OR LAMB BAD NUTRITION CLIMATE CHANGE MEAT LOVER ANIMAL WELFARE BAD FOR HEALTH REDUCE FOOD COST NO CLIMATE CHANGE FASHIONABLE LIFESTYLE 81.9% 34.5% 45.2% 30.5% 38.9% 28.8% 24% 23.5% 4.15% 4.15% 64.6%: YES 35.4%: NO FIG. 15: WILLINGNESS TO REDUCE BEEF AND LAMB CONSUMPTION 64.6% 35.4% FINDINGS: MOTIVATIONS FINDINGS: BEHAVIOR CHANGE
  • 18. 1 8 5 T O D O T O D AY Protesters in Britain demand climate action. Photo: Garry Knight (creative commons). Halting global warming below the critical threshold of two degrees Celsius will require a dramatic decrease in GHG emissions from all sectors. For a 66% chance of achieving this goal, we will need to reduce annual emissions by 30% by 2030, and 60% by 2050. This effort is complicated by the addition of two billion more people by 2050. More dramatic reductions in the short term will ease the cost and pain of long-term reductions. The sooner we act, the less dramatic the action need be. In late 2015 two key analyses were released regarding the potential to mitigate climate change by changing what we eat. Both studies found that reaching the two degree Celsius goal may be impoosible without dietary change. The studies found: • “Immediate and substantial reduction in wasted food and meat and dairy intake, particularly ruminant meat (e.g., beef and lamb), are imperative to mitigating catastrophic climate change.”111 DIET FOR A TWO DEGREE WORLD 5 10 ADOPTION OF HEALTHY DIET 15 20 25 30 35 0 FIG. 16: POTENTIAL GHG REDUCTIONS THROUGH GLOBAL DIETARY CHANGE 75% CUT IN MEAT CONSUMPTION 50% CUT IN FOOD WASTE HEALTHY LOW-MEAT DIET + 50% FOOD WASTE CUT + AG YIELD GAINS GHG EMISSIONS SAVINGS IN 2050 (GTCO2EQ) GHG SAVINGS AS % OF 2012 GLOBAL EMISSIONS
  • 19. 1 9 E AT I N G F O R T O M O R R O W • “Left unchecked, current dietary patterns are incompatible with a two- degree pathway. If we are to avoid dangerous climate change, global yearly emissions must fall rapidly from today’s levels of 49 GtCO2e to around 23 GtCO2e by 2050. If meat and dairy consumption continues to rise at current rates, the agricultural sector alone will soak up 20 of the 23 GtCO2e yearly limit in 2050, leaving just 3 GtCO2e for the rest of the global economy.”112 • “Emissions...must be kept at or below [21 GtCO2eq] per year by 2050... Under the business-as-usual scenario... the emissions from agriculture alone would nearly reach this emissions threshold in 2050.”111 • “Global adoption of a healthy diet would see a yearly emissions saving of 6 GtCO2e in 2050, almost all of which would result from reduced consumption of meat and dairy produce.”112 • “A global reduction in meat and dairy intake by 75% by 2050 could reduce emissions by 7.4 GtCo2e, an amount greater than the emissions from the entire transportation sector in 2010... Smaller reductions in meat intake will likely not be enough to avoid 2°C.”111 • “Halving global wasted food could reduce emissions by an estimated 4.5 GtCO2e. This is greater than reductions associated with technological interventions such as increasing agricultural yields and technical mitigation.”111 • “Keeping global warming below 2°C will more than likely require reduction in both meat and dairy intake and wasted food, combined with rapid and dramatic reductions across non- agricultural sectors. The combined effect of adopting a healthy, low-meat diet, reducing wasted food by 50% and increasing agricultural yields could reduce agriculture related emissions by 14.3 GtCO2eq by 2050.”111 “WORLDWIDE ADOPTION OF A HEALTHY DIET WOULD GENERATE OVER A QUARTER OF THE EMISSION REDUCTIONS NEEDED BY 2050.” —CHATHAM HOUSE, “CHANGING CLIMATE, CHANGING DIETS,” 2015 Image Above: World leaders, including General Secretary of the United Nations Ban Ki Moon, celebrate the signing of the Paris Climate Agreement in December 2015. The agreement states that nations will set the goal of keeping global warming “well-below two degrees Celsius.” Photo: Alamy.
  • 20. 2 0 5 T O D O T O D AY 5 TO DO TODAY & THE CHINESE NUTRITION SOCIETY BILLBOARD COLLABORATION In addition to making recommendations for mitigating climate change through diet, both Johns Hopkins and Chatham House have recommended key steps to catalyzing the necessary change. Both institutions suggest actions by governments and NGOs to influence the public. Chatham House notes that “government inaction signals to publics that the issue is unimportant or undeserving of concern.”113 While Johns Hopkins suggests “leveraging behavior change campaigns aimed at reducing demand for livestock production.”114 5 To Do Today has partnered with the Chinese Nutrition Society to help promote its latest recommended dietary guidelines, released in May 2016. The guidelines are created in partnership with China’s Ministry of Health and are released every 10 years. The latest recommendations include a reduction in meat consumption of over 50% compared to current levels and over 70% compared to projected consumption in 2030. CNS recommends consuming between 40 and 75 grams per day of meat or between 14.6 and 27.4 kg per year. 5 To Do Today has produced posters and billboards featuring celebrity ambassadors to disseminate key nutrition messages to all provinces and autonomous regions of China. New dietary guidelines released by the Chinese Nutrition Society in May 2016 recommend a 50% reduction in meat consumption, from current levels of 63 kg annually to a maximum of 27.4 kg. 5 To Do Today has partnered with CNS to disseminate key messages (billboard above) about nutrition to every province and autonomous region of China.
  • 21. 2 1 E AT I N G F O R T O M O R R O W DAILY RECOMMENDATION (G) ANNUAL RECOMMENDATION (KG) GRAIN 250 –400 91.25 – 146 VEGETABLES 300 – 500 109.5 – 182.5 FRUIT 200 – 350 73 – 127.75 SEAFOOD 40 – 75 14.6 – 27.4 MEAT 40 – 75 14.6 – 27.4 EGGS 40 – 50 14.6 – 18.3 DAIRY 300 109.5 BEANS 25 – 35 9.1 – 12.8 OIL 20 – 30 7.3 – 11 SALT 0 – 5 0 – 1.8 CNS DIETARY GUIDELINES 2016POTENTIAL FOR EMISSIONS REDUCTIONS Without intervention, GHG emissions from Chinese meat consumption would rise by over 50% to total over 1.8 GtCO2eq in 2030, greater than the current emissions of all but four countries (China, US, India and Russia). To establish the potential for GHG emissions reductions through adoption of the CNS recommended levels of meat consumption, 5 To Do Today examined the following two scenarios: 2015: In 2015, the nationwide adoption of the CNS recommended levels of meat consumption could have lowered emissions from Chinese meat consumption by 675 MtCO2eq, or 56%. Equivalent to: • Reducing emissions from agriculture in China by 81% • Reducing global agriculture emissions by over 12% • Reducing total Chinese emissions by over 6% • Reducing total global emissions by over 1.5% 2030: By 2030, CNS guidelines could achieve reductions in emissions from Chinese meat consumption of 1.27 GtCO2eq, or 70.8% lower than projections. Equivalent to: • Reducing global agriculture emissions by over 22%. • Reducing total Chinese emissions by over 9.5%. • Switching to the CNS recommended levels of meat consumption could account for 8.5% of the global reductions necessary to stay on the pathway to two degrees, which requires emissions are lowered to approximately 35 GtCO2eq annually by 2030. For full analysis see page 26. 1000 2000 800 1800 600 1600 400 1400 200 1200 0 2015 2030 1191.58 1804.53 516.48 526.98 FIG. 17: GHGS FROM MEAT CONSUMPTION IN CHINA (MTCO2EQ) CURRENT CNS PROJECTED CNS
  • 22. 2 2 5 T O D O T O D AY EAT LESS MEAT While choosing vegan or vegetarian diets will do the most to reduce GHG emissions, every bit counts. If cutting out meat com- pletely is not possible, choosing a diet based on the Harvard Healthy Eating Plate will reduce GHG contributions from food to the same level as a vegetarian diet while still allowing for limited meat consumption. The Livewell Plate would also significantly reduce GHG emission from food and is one of the only diets that takes GHG into its calculations. Even eating one or two more meatless meals per week can help improve health and reduce environmental impacts. EAT LESS BEEF AND LAMB Rumination contributes 40% of global live- stock emissions and with a thirst for water over 20 times that of tofu, beef and lamb are by far the least efficient and most dam- aging sources of protein. REDUCE FOOD WASTE Cutting portion size and cleaning your plate whether at a restaurant or at home is the easiest way to reduce GHG emissions from food. Savings vary from 20 to 50% depend- ing on the country of residence and person- al habits. MEATLESS MONDAY Meatless Monday is a global movement to promote adopting a vegetarian diet one day each week for health and environmental reasons. Participating in Meatless Monday not only reduces emissions, it also shows solidarity with a movement for better, healthier and more climate friendly food choices. By familiarizing participants with delicious plant-based recipes, Meatless Monday also encourages better eating during the rest of the week. EAT LOCAL Local food has, on average, 5 to 17 times less GHG emissions than conventionally produced food.115 Though the exact savings depend heavily on the on-farm inputs and transportation involved, local food will cut out all flown food, which has a footprint much larger than food that has been trucked, trained or shipped. KNOW YOUR DIET Diets that promote health, weight loss, environmentalism, animal rights or any other single perspective are unlikely to consider GHG emissions or sustainability. Paleo or Atkins diets may help people lose weight, but all that meat is unsustainable. Eating free-range and grass fed beef may be better for the quality of cattle life, but also contributes more emissions than its factory-farmed counterpart. Pescetarianism is seen as an alternative to the cruelty of factory farms, but those who choose this diet will find it hard to calculate their environmental impact and could in fact be increasing GHG emissions while depleting worldwide fisheries. A vendor sells tofu at an outdoor market in Kunming, China. Replacing meat with plant-based proteins such as tofu uses less water and land and can help reduce greenhouse gas emissions. Photo: Alamy CONSUMER RECOMMENDATIONS
  • 23. 2 3 E AT I N G F O R T O M O R R O W There will be no mitigating climate change without the commitment of the Chinese government and the cooperation of its 1.4 billion people. There are three reasons for this: • China is the world’s largest emitter of greenhouse gas and has yet to hit an overall emissions peak. As with the United States, the second largest emitter, reducing GHG emissions is impossible globally without China reducing them locally. • As the country continues to develop, hundreds of millions of people are set to join the ranks of the urban middle class in China. How and what these individuals consume will have far- reaching impacts on the planet. • China’s rapid economic development is considered by many developing countries as a model for bringing their own population out of poverty. If China can show that economic development can coincide with decarbonization, other countries will follow. If China cannot define a path to low-carbon development for low and middle income countries, other nations are more likely to follow the fossil fuel-driven and export-led model that China has followed thus far, which could require further increases in GHG emissions. Given its centralized political system, China has the opportunity to implement emissions-reduction programs with unmatched speed and scale. This can be seen in its transition away from coal and toward renewable energy sources and in its record sales of new energy vehicles. It can also be seen in its government directives. In 2014, the State Council : Citizens shall enhance environmental protection awareness and adopt a low- carbon and energy-saving lifestyle, and conscientiously fulfill the obligation of environmental protection. Professor Yuexin Yang, President of the Chinese Nutrition Society, announces her organization’s new dietary recommendations at a press conference on May 15, 2016. It is unsurprising then, that the Chinese Nutrition Society is leading the world in advocating for significantly reduced meat consumption. By 2030, China is projected to add the equivalent of the entire US consumption to global demand for meat and dairy, which will increase related emissions by over 50%. However, if citizens follow the CNS guidelines and reduce consumption to recommended levels, emissions from meat consumption would be 56% less than in 2015 and 70% less than projected in 2030. While driving down emissions, adoption of CNS recommendations would help ensure food security in the face of threats such as water shortages, pollution and desertification. With 1.4 billion people, China has 25% of the arable land of the US and 33% the global average per capita water resources. China is likely to feel the effects of climate change on food security first, fastest and on the largest scale. Reducing meat consumption is a clear way to get ahead of these and other potential resource crises. If China is able to make progress on the issue of meat consumption and the issue of GHG emissions, it could ignite global competition and ultimately inspire others to follow suit. Lowering emissions through competition benefits us all from a sustainability perspective, while leading on the issue also benefits China from a geopolitical one. As a 2015 Chatham House report suggests, “decisive action in the West may galvanize belief in China that change is possible and worthwhile, and vise versa.” CHINA IS READY TO LEAD
  • 24. 2 4 5 T O D O T O D AY ENDNOTES 1. Kim, Brent, et. al. “The Importance of Reducing Animal Product Consumption and Wasted Food in Mitigating Catastrophic Climate Change.” Johns Hopkins Center for a Livable Future, Dec. 2015. 2. Bailey, et. al., “Livestock – Climate Change’s Forgotten Sector.” Chatham House, Dec. 2014. 3. Avatar Alliance Foundation “Fact Sheet: The Environmental Impact of Animal-Based Foods.” 4. Bailey, et. al. 2014. 5. Ibid. 6. Herrero, Mario, et. al, “Biomass use, production, feed efficiencies and greenhouse gas emissions from global livestock systems.” Proceedings of the National Academy of Sciences of the United States of America, co. 110 no. 52, 20888-20893, doi: 10.1073/pnas.138149110 7. OECD database. https://data.oecd.org/agroutput/ meat-consumption.htm 8. Bourne, Joel K. The End of Plenty, 2015. 9. California Environmental Associates, “Dietary Trends in Asia: Environmental Impact and the Potential to Shift Meat Consumption Trends.” 2013. 10. “Kids as Food Heroes: A New Way to Eat in China,” Joint US-China Cooperation on Clean Energy (JUCCCE), May 2015. 11. US Environmental Protection Agency, https:// www3.epa.gov/climatechange/ghgemissions/gwps. html 12. Bailey, et. al. 2014. 13. Oppenlander, Richard, Food Choice and Sustainability. Langdon Street Press, 2013. 14. Kim, et. al., 2015. 15. Bailey, et. al. 2014. 16. AAF, “Fact Sheet.” 17. “Risk Assessment Evaluation for CAFOs,” USEPA, 18. “Counting Chickens,” The Economist, July 27, 2011. 19. McSweeney, Robert “Global temperature rise set to hit 1C of warming this year, Met Office says.” Carbon Brief, 9 Nov. 2015. 20. “Understanding Carbon Budgets,” WWF. 2014. http://awsassets.wwf.org.za/downloads/ understanding_carbon_budgets_final.pdf 21. Oppenlander, 2013. 22. 49 GtCO2eq (estimated annual emissions) X .145 = 7.105 GtCO2eq. 23. Bailey, et. al. 2014. 24. AAF, “Fact Sheet.” 25. Watson, Elaine, “Is the decline in US meat consumption terminal?” Food Navigator USA, 12 April 2013. http://www.foodnavigator-usa.com/ Markets/Is-the-decline-in-US-meat-consumption- terminal 26. CEA, 2013. 27. United Nations, FAOStat database 28. Yan, Yunxiang, “McDonald’s in Beijing: The Localization of Americana,” New York Times, 1997. https://www.nytimes.com/books/first/w/watson- arches.html 29. Osnos, Evan, Age of Ambition: Chasing Fortune, Truth and Faith in the New China. Garrar, Straus and Giroux, 2015. 30. Chinese Nutrition Society 31. Osnos, 2015. 32. CEA, 2013. 33. See notes 7 and 8. 34. CEA, 2013. 35. Ibid. 36. See Appendix II. 37. Median projections of United Nations Population Division. 38. “The Ecological Consequences of Meat Consumption,” http://www.vegetarismus.ch/info/ eoeko.htm 39. AAF, “Fact Sheet.” 40. Ibid. 41. Valentine, Katie, “Humans Are Set To Wipe an India-Sized Chunk of Forest Off the Map by 2050.” Climate Progress, Aug. 24, 2015. http:// thinkprogress.org/climate/2015/08/24/3694560/ deforestation-india-sized-chunk/ 42. Zhang, Moran, “Field of Dreams? 7 Reasons Why You Don’t Want To Be A Farmer in China.” IBT, 22 August 2013. 43. Beardson, Timothy, Stumbling Giant: The Threats to China’s Future. Yale University Press, 2013. 44. Ibid. 45. Demick, Barbara “China looks abroad for greener pastures,” The LA Times, 29 March 2014. http:// www.latimes.com/world/asia/la-fg-china-foreign- farmland-20140329-story.html 46. Oppenlander, 2013. 47. UNFAO “Livestock’s role in deforestation.” http://www.fao.org/agriculture/lead/themes0/ deforestation/en/ 48. Oppenlander, 2013. 49. Gale, Fred, Hansen James, and Jewison, Michael, “China’s Growing Demand for Agricultural Imports,” USDA, Feb. 2014. 50. UNCCD “Climate change and land degradation: Bridging knowledge and stakeholders.” 9-12 March 2015. 51. Ibid. 52. Pioneer, “Africa’s Agricultural Opportunities.” https://www.pioneer.com/CMRoot/Pioneer/ About_Global/news_media/pannar/Africa_Ag_ Opportunities.pdf 53. UNCCD. 54. Herrero, 2013. 55. Beardson, 2013. 56. Patrick, 2012. 57. Bailey, et. al. 2014 58. World Bank Group, “Water and Climate Change.” http://water.worldbank.org/topics/water- resources-management/water-and-climate-change 59. Water and Climate Change: Understanding the Risks and Making Smart Investment Decisions. The World Bank, 2009. http://www-wds.worldbank.org/ external/default/WDSContentServer/WDSP/IB/201 0/02/01/000333038_20100201020244/Rendered/ PDF/529110NWP0Box31ge0web0large01128110.pdf 60. United Nations Water, “Statistics.” http:// www.unwater.org/statistics/statistics-detail/ en/c/211649/ 61. Barringer, Felicity, “World’s Aquifers Losing Replenishing Race, Researchers Say.” The New York Times, 25 June 2015. 62. United Nations Water, “Statistics.” http:// www.unwater.org/statistics/statistics-detail/ en/c/211794/; http://www.unwater.org/statistics/ statistics-detail/en/c/211799/ 63. Beardson, 2013. 64. Ibid. 65. Beardson, 2013. 66. Moore, Scott “Issue Brief: Water Resource Issues, Policy and Politics in China.” Brookings Institute http://www.brookings.edu/research/ papers/2013/02/water-politics-china-moore 67. Beardson, 2013. 68. AgEconSearch, Research in Agricultural and Applied Economics. (https://fresnostate.digication. com/nicole_leu/Term_Paper) 69. National Bureau of Statistics, China 70. Bailey, et al., 2014. 71. WWF “Solving the Soy Problem.” http://wwf.panda. org/what_we_do/footprint/agriculture/soy/ 72. Bourne, 2015. 73. Oppenlander, Richard, “The World Hunger- Food Choice Connection.” 22 April 2012. http:// comfortablyunaware.com/blog/the-world-hunger- food-choice-connection-a-summary/ 74. “Existing Cropland Could Feed 4 Billlion More” 1 August 2013. http://discover.umn.edu/news/food- agriculture/existing-cropland-could-feed-4-billion- more 75. Bourne, 2015. 76. Shefali, 2014. 77. Ibid. 78. Ibid. 79. Ibid. 80. Datz, Todd “Red meat raises red flags.” Harvard Gazette, 12 March, 2012. http://news.harvard.edu/ gazette/story/2012/03/red-meat-raises-red-flags/ 81. “It’s Official, Vegetarians Outlive Meat Eaters,” Times of India, 16 Oct. 2012. http:// timesofindia.indiatimes.com/home/science/
  • 25. 2 5 E AT I N G F O R T O M O R R O W Its-official-Vegetarians-outlive-the-meat-eaters/ articleshow/16830925.cms 82. Sifferlin, Alexandra, “7 Reasons Vegetarians Live Longer.” Time February 24, 2014. http://time. com/9463/7-reasons-vegetarians-live-longer/ 83. “Cut down on meat to lose weight.” BBC News July 22, 2010. http://www.bbc.com/news/ health-10726414 84. Wilson, Deborah “Eating Meat Is Linked to Obesity.” http://www.peta.org/issues/animals- used-for-food/obesity/ 85. Yan Min, et. al., “Tackling China’s Noncommunicable Diseases: Shared Origins, Costly Consequences and the Need for Action,” Chinese Medical Journal, 20 Mar 20-15. 86. JUCCCE, 2015. 87. Hackethal, Veronica, “Diabetes Is a Major Public- Health Crisis in China,” Medscape, 18 Sept. 2014. 88. Levitt, Tom, “China facing bigger dietary health crisis than the US.” China Dialogue, 4 July 2014. 89. Wang, Jeanette “62 million people in China obese, sparking fears of ‘alarming’ financial burden.” South China Morning Post, 29 May 2014. http:// www.scmp.com/lifestyle/health/article/1521011/21- billion-people-are-obese-china-and-us-among- worlds-fattest-new 90. Zero Hedge, “The Sick Man of Asia – China’s Looming Health Disaster.” 9 June 2015. 91. JUCCCE, 2015. 92. Ibid. 93. Levitt, 2014. 94. Moore, Malcom “China faces looming health crisis, warn experts.” Telegraph UK, 29 Aug 2014. http:// www.telegraph.co.uk/news/worldnews/asia/ china/11061559/China-faces-looming-health-crisis- warn-experts.html 95. Watts, Jonathan, “When A Billion Chinese Jump,” Scribner, 2010. 96. Oppenlander, 2013. 97. Zielinski, Sarah “Ocean Dead Zones Are Getting Worse Globally Due to Climate Change.” Smithsonian 20 Nov. 2014. http://www. smithsonianmag.com/science-nature/ocean-dead- zones-are-getting-worse-globally-due-climate- change-180953282/?no-ist 98. “Dead Zones: How Agricultural Fertilizers Kill our Rivers, Lakes and Oceans,” Greenpeace, 2008. 99. Zimmer, Carl “A Looming Oxygen Crisis and Its Impact on World’s Oceans.” Yale Environment 360, 5 Aug. 2010. http://e360.yale.edu/feature/a_ looming_oxygen_crisis_and_its_impact_on_ worlds_oceans/2301/ 100. Center for Biological Diversity, “The Extinction Crisis,” http://www.biologicaldiversity.org/ programs/biodiversity/elements_of_biodiversity/ extinction_crisis/ 101. Djoghlaf, Ahmed “Secretariat of the Convention on Biological Diversity; A Message from the Executive Secretary.” 22 May 2007. https://www.cbd.int/doc/ speech/2007/sp-2007-05-22-es-en.pdf 102. Interview of Simon Stuart, Chair of the International Union for Conservation of Nature Species Survival by Dr. Richard Oppenlander, 2004. Cowspiracy, “Facts” http://www.cowspiracy.com/ facts/ 103. Jowit, Juliette, “Humans driving extinction faster than species can evolve, say experts.” The Guardian, 10 March 2010. http://www.theguardian.com/ environment/2010/mar/07/extinction-species- evolve 104. “Extinction crisis continues apace,” IUCN, Nov. 3, 2009. http://www.iucn.org/?4143/Extinction- crisis-continues-apace 105. Roberts, Dexter “Five Reasons China Should Care About Climate Change.” Bloomberg Business, 24 March 2015. http://www.bloomberg.com/news/ articles/2015-03-24/five-reasons-china-should- care-about-climate-change 106. Kahn, Brian “Sea Level Could Rise at Least 6 Meters.” Scientific American, 9 July 2015 http:// www.scientificamerican.com/article/sea-level- could-rise-at-least-6-meters/ 107. Neumann, Barbara, et. al. “Future Coastal Population Growth and Exposure to Sea-Level Rise and Flooding – A Global Assessment.” http://www. ncbi.nlm.nih.gov/pmc/articles/PMC4367969/ 108. Population Action International, “Climate Change, Migration, and Population Growth.” http://pai.org/ wp-content/uploads/2012/01/climatemigration.pdf 109. Levacher, Cecile “Climate Change in the Tibetan Plateau Region: Glacial Melt and Future Water Security.” Future Directions International, 29 May 2014. 110. The International Disasters Database (EM-DAT). 111. Kim, et. al. 2015. 112. Wellesley, Laura; Happer, Catherine; Froggatt, Antony, Changing Climate, Changing Diets: Pathways to Lower meat Consumption. Chatham House, Dec. 2015. 113. Ibid. 114. Kim, et. al. 2015. 115. Cho, Renee, “How Green is Local Food?” Earth Institute: State of the Planet, 4 September 2012. Columbia University. 116. China’s population expected to reach 1.45 bln by 2030,” China Daily, Oct. 30, 2015. http:// www.chinadaily.com.cn/china/2015-10/30/ content_22329857.htm 117. Better Livestock Management Could Rein in Billions of Tons of Carbon,” Conservation Magazine; March 2016. http://conservationmagazine.org/2016/03/ ways-greenhouse-gases-livestock-production/ A soybean harvest is underway. Compared to livestock products, soy protein requires less land and water to grow and emits less greenhouse gas. Photo: A Pixabay
  • 26. 2 6 5 T O D O T O D AY POPULATION: The National Bureau of Statistics provided the 2015 population while China Daily reports on official population projections for 2030.116 MEAT CONSUMPTION: Per capita meat consumption in 2015, was provided by the Chinese Nutrition Society. For projections of meat consumption in 2030, the California Environmental Associates (CEA) report “Dietary Trends in Asia” was used. However, the projection for lamb was not provided in the CEA projections and was estimated by the Chinese Nutrition Society for 2030. GHGS PER KILO OF MEAT: In its report Changing Climate, Changing Diet, Chatham House aggregated several assessments on the total emissions per kilo of meat. However, this analysis does not take into account potential reductions in emissions intensity through technological mitigation. Technological mitigation combined with the stated reductions in meat consumption could have even greater potential for overall emissions reductions by 2030 than stated in this analysis. A recent study estimates that better feed and grazing practices could reduce total emissions from livestock by 2 GtCO2eq globally, mainly from developing countries such as China.117 TOTAL GHG EMISSIONS: Total emissions for the world and China are from the CAIT database provided by the World Resources Institute. As 2015 emissions data was not yet available, the most recent data (2012) was used for the 2015 scenario. EMISSIONS FROM AGRICULTURE: Agriculture emissions for 2015 and projections for 2030 in China are from the FAOStat database. Unfortunately, as 2015 data was not yet available, and the most recent data (2012) was used for the 2015 scenario. The emissions data from agriculture is not a perfect comparison to emissions from meat consumption, but provides a useful benchmark. For one, FAOStat emissions calculate GHGs from the country of agricultural production, not the country of consumption. Because of the large imports of soy and corn to feed its livestock, much of the emissions associated with Chinese consumption are attributed to the country of production. Secondly, agricultural emissions encompass all agriculture, not only those limited to livestock, meat and dairy. CNS DIETARY GUIDELINES: The levels of meat consumption used in these calculations are from the high-end of the range recommended by CNS, approximately 27.34 kg per year. As CNS does not specify the type of meat, the proportion of meat types in these calculations is found by using the breakdown of meat proportions for current consumption for the 2015 scenario, and from the CEA projections for the 2030 scenario, then applying those proportions to the total recommended consumption of 27.34 kg. OTHER NOTES: This analysis is limited to emissions from meat consumption only and does not include emissions from substitute protein sources such as soy, seafood or dairy. GHGS FROM MEAT CONSUMPTION IN CHINA GHG PER KILO ANNUAL CONSUMPTION PER CAPITA 2015 (KG) ANNUAL GHG PER CAPITA (KGCO2EQ) NATIONAL GHG TOTAL (MTCO2EQ) 2015 ANNUAL CON- SUMPTION PER CAPITA 2030 (KG, CEA PROJECTION) GHG PER CAPITA , 2030 (KGCO2EQ , PROJECTED) NATION- AL GHG TOTAL 2030 (MTCO2EQ , PROJECTED) INCREASE IN GHG, 2015 —2030 (MTCO2EQ) % INCREASE IN GHG, 2015 —2030 Poultry 7.00 13.34 93.38 128.36 24.00 168.00 243.60 115.24 89.78% Pork 8.80 40.97 360.54 495.60 58.00 510.40 740.08 244.48 49.33% Beef 56.60 5.44 307.90 423.25 8.00 452.80 656.56 233.31 55.12% Lamb 31.30 3.36 105.17 144.57 3.62 113.31 164.29 19.73 13.65% TOTAL 63.11 866.99 1191.78 93.62 1244.51 1804.53 612.75 51.42% APPENDIX CNS GUIDELINE ANALYSIS IN DETAIL
  • 27. 2 7 E AT I N G F O R T O M O R R O W GHG FROM CNS RECOMMENDATIONS 2015 ANNUAL CONSUMPTION PER CAPITA 2015 (KG) ANNUAL CONSUMPTION PER CAPITA (KG), CNS RECOMMENDATION GHG EMISSIONS PER KILO (KGC02EQ) ANNUAL GHG PER CAPITA (KGCO2EQ) NATIONAL GHG TOTAL FROM CNS DIET (MTCO2EQ), 2015 POULTRY 13.34 5.78 7.00 40.47 55.63 PORK 40.97 17.76 8.80 156.25 214.78 BEEF 5.44 2.36 56.60 133.44 183.42 LAMB 3.36 1.46 31.30 45.58 62.65 TOTAL 63.11 27.35 375.73 516.48 GHG FROM CNS RECOMMENDATIONS 2030 CEA 2030 DIET (KG, PROJECTED) ANNUAL CONSUMPTION PER CAPITA (KG), CNS RECOMMENDATION GHG EMISSIONS PER KILO (KGCO2EQ) ANNUAL GHG PER CAPITA (KGCO2EQ) NATIONAL GHG TOTAL FROM CNS DIET (MTCO2EQ), 2030 POULTRY 24.00 7.01 7.00 49.06 71.14 PORK 58.00 16.94 8.80 149.05 216.13 BEEF 8.00 2.34 56.60 132.23 191.74 LAMB 3.62 1.06 31.30 33.09 47.98 TOTAL 93.62 27.34 363.44 526.98 GHG REDUCTIONS FROM CNS RECOMMENDATIONS IN CHINA ACTUAL GHGS IN 2015 (MTCO2EQ) PROJECTED GHGS IN 2030 (MTCO2EQ) GHGS FROM CNS RECOMMENDATIONS, 2015 (MTCO2EQ) GHGS FROM CNS RECOMMENDATIONS, 2030 (MTCO2EQ) CNS % REDUCTION, 2015 CNS % REDUCTION, 2030 POULTRY 128.36 243.60 55.63 71.14 56.66% 70.80% PORK 495.60 740.08 214.78 216.13 56.66% 70.80% BEEF 423.25 656.56 183.42 191.74 56.66% 70.80% LAMB 144.57 164.29 62.65 47.98 56.66% 70.80% TOTAL 1191.78 1804.53 516.48 526.98 56.66% 70.80% TOTAL GHG REDUCTIONS FROM CNS RECOMMENDATIONS 2015 (MTCO2EQ) 2030 (MTCO2EQ , PROJECTED) CNS REDUCTION IN 2015 AS % OF: CNS REDUCTION IN 2030 AS % OF: WORLD TOTAL GHG EMISSIONS 43286.2 1.56% CHINA TOTAL GHG EMISSIONS 10975.5 13214.98 6.15% 9.67% AGRICULTURE GHG REDUCTIONS FROM CNS RECOMMENDATIONS 2015 (MTCO2EQ) 2030 (MTCO2EQ , PROJECTED) CNS REDUCTION IN 2015 AS % OF: CNS REDUCTION IN 2030 AS % OF: WORLD TOTAL GHG FROM AGRICULTURE 5381.51 5756.07 12.55% 22.19% CHINA TOTAL GHG FROM AGRICULTURE 831.56 873.46 81.21% 146.26%
  • 28. 5 TO DO TODAY 333 PINE ST. #300 SAN FRANCISCO, CA 94104 TEL: 415.834.3174 INFO@WILDAID.ORG | www.5TODO.org This report is printed on 100% recycled paper