The document is an Excel spreadsheet containing the annual returns over 15 years for 12 stock investments. It provides instructions to analyze the data to: 1) Calculate the annual and overall returns of an equally weighted portfolio, 2) Determine the correlation, covariance and beta of Company #12 vs the portfolio, 3) Use the CAPM model to calculate the required return for Company #12 based on its beta and given market/risk-free rates, and 4) Assess if Company #12 should be bought based on its estimated future return.
2. Risk and Return Study
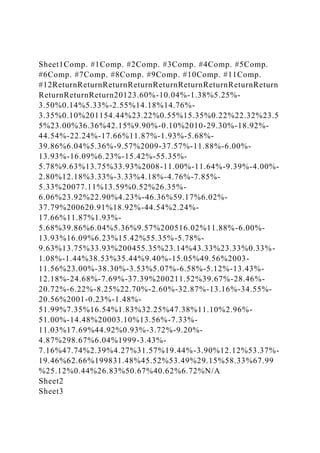
Attached is a excel spreadsheet that has the annual return
measured for 12 different stock investments. The spreadsheet
shows the average return and standard deviation of the return
for the past 15 years. Use this spreadsheet and spreadsheet
commands to do the following:
1. Compute the return for each year on a portfolio that contains
an equal investment in all 12 securities.
2. Compute the 15-year average return and standard deviation of
return for the portfolio that consists of all 12 securities with
equally weighted investment.
3. Compute the correlation and covariance between the return
on company #12 and the return on the equally-weighted
portfolio. Hint: There is a spreadsheet command that does this
calculation.
4. Compute the beta of Company #12 using the information you
have collected.
5. Now using the beta you created for Company #12, compute
the required rate of return using the Capital Asset Pricing
Model (CAPM), assuming that the average market return is the
return of your equally-weighted portfolio and the risk-free rate
of return is 2.5%.
6. If you were told analysts estimate that Company #12 will
have a 5% rate of return next year, would you buy the stock?
Why or why not?
Your submission should meet the following requirements:
· Complete your work on the Excel sheet provided.
· Be sure to keep your formulas or commands in the cells on
your Excel sheet.
· Include any brief explanatory remarks needed, on the Excel
sheet.