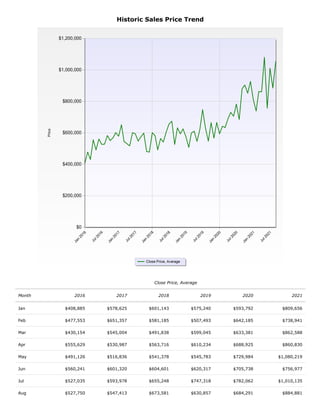
Historic Sales Price Trend Of Lake Lanier Waterfront Homes For The Past 5 Years!
•
0 gefällt mir•1,159 views

Historic Sales Price Trend Of Lake Lanier Waterfront Homes For The Past 5 Years! Wow! These numbers are startling! www.LakeSidneyLanierHomes.com www.LakeSidneyLanierHomes.Blogspot.com www.LakeLanierLotsAndLand.com

Empfohlen
Weitere ähnliche Inhalte
Was ist angesagt?
Ähnlich wie Historic Sales Price Trend Of Lake Lanier Waterfront Homes For The Past 5 Years!
Ähnlich wie Historic Sales Price Trend Of Lake Lanier Waterfront Homes For The Past 5 Years! (20)
Mehr von Arthur Prescott
Mehr von Arthur Prescott (20)
Kürzlich hochgeladen
Kürzlich hochgeladen (20)
Historic Sales Price Trend Of Lake Lanier Waterfront Homes For The Past 5 Years!
- 1. Historic Sales Price Trend Close Price, Average Month 2016 2017 2018 2019 2020 2021 Jan $408,885 $578,625 $601,143 $575,240 $593,792 $809,656 Feb $477,553 $651,357 $581,185 $507,493 $642,185 $738,941 Mar $430,154 $545,004 $491,838 $599,045 $633,381 $862,588 Apr $555,629 $530,987 $563,716 $610,234 $688,925 $860,830 May $491,126 $516,836 $541,378 $545,783 $729,984 $1,080,219 Jun $560,241 $601,320 $604,601 $620,317 $705,738 $756,977 Jul $527,035 $593,978 $655,248 $747,318 $782,062 $1,010,135 Aug $527,750 $547,413 $673,581 $630,857 $684,291 $884,881
- 2. Close Price, Average Month 2016 2017 2018 2019 2020 2021 Sep $582,940 $575,599 $526,472 $546,946 $880,443 $1,053,031 Oct $550,854 $598,358 $631,939 $665,024 $903,761 Nov $568,156 $481,261 $593,620 $566,572 $851,970 Dec $601,700 $477,625 $625,106 $665,575 $926,836 Search Criteria Time frame is from Jan 2016 to Sep 2021 Property is 'Residential Detached' Lake Name is 'Lanier' Waterfront Features is 'Lake Front' Results calculated from 1,990 listings The accuracy of all information, regardless of its source, including but not limited to square footage, is deemed reliable but not guaranteed and should be verified through personal inspection by and/or with the appropriate professionals. Copyright 2021 FMLS