State Bridge Profile Rhode Island 2014
•
0 gefällt mir•370 views

State Bridge Profile Rhode Island 2014

Empfohlen
Weitere ähnliche Inhalte
Was ist angesagt?
Was ist angesagt? (20)
Andere mochten auch
Andere mochten auch (18)
Ähnlich wie State Bridge Profile Rhode Island 2014
Ähnlich wie State Bridge Profile Rhode Island 2014 (12)
Mehr von artba
Mehr von artba (20)
Kürzlich hochgeladen
Kürzlich hochgeladen (20)
State Bridge Profile Rhode Island 2014
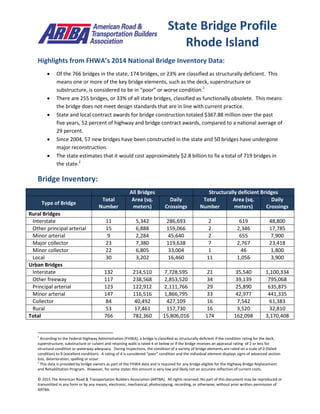
- 1. © 2015 The American Road & Transportation Builders Association (ARTBA). All rights reserved. No part of this document may be reproduced or transmitted in any form or by any means, electronic, mechanical, photocopying, recording, or otherwise, without prior written permission of ARTBA. Highlights from FHWA’s 2014 National Bridge Inventory Data: Of the 766 bridges in the state, 174 bridges, or 23% are classified as structurally deficient. This means one or more of the key bridge elements, such as the deck, superstructure or substructure, is considered to be in “poor” or worse condition.1 There are 255 bridges, or 33% of all state bridges, classified as functionally obsolete. This means the bridge does not meet design standards that are in line with current practice. State and local contract awards for bridge construction totaled $367.88 million over the past five years, 52 percent of highway and bridge contract awards, compared to a national average of 29 percent. Since 2004, 57 new bridges have been constructed in the state and 50 bridges have undergone major reconstruction. The state estimates that it would cost approximately $2.8 billion to fix a total of 719 bridges in the state.2 Bridge Inventory: All Bridges Structurally deficient Bridges Type of Bridge Total Number Area (sq. meters) Daily Crossings Total Number Area (sq. meters) Daily Crossings Rural Bridges Interstate 11 5,342 286,693 2 619 48,800 Other principal arterial 15 6,888 159,066 2 2,346 17,785 Minor arterial 9 2,284 45,640 2 655 7,900 Major collector 23 7,380 119,638 7 2,767 23,418 Minor collector 22 6,805 33,004 1 46 1,800 Local 30 3,202 16,460 11 1,056 3,900 Urban Bridges Interstate 132 214,510 7,728,595 21 35,540 1,100,334 Other freeway 117 238,568 2,853,520 34 39,139 795,068 Principal arterial 123 122,912 2,111,766 29 25,890 635,875 Minor arterial 147 116,516 1,866,795 33 42,977 441,335 Collector 84 40,492 427,109 16 7,542 61,383 Rural 53 17,461 157,730 16 3,520 32,810 Total 766 782,360 15,806,016 174 162,098 3,170,408 1 According to the Federal Highway Administration (FHWA), a bridge is classified as structurally deficient if the condition rating for the deck, superstructure, substructure or culvert and retaining walls is rated 4 or below or if the bridge receives an appraisal rating of 2 or less for structural condition or waterway adequacy. During inspections, the condition of a variety of bridge elements are rated on a scale of 0 (failed condition) to 9 (excellent condition). A rating of 4 is considered “poor” condition and the individual element displays signs of advanced section loss, deterioration, spalling or scour. 2 This data is provided by bridge owners as part of the FHWA data and is required for any bridge eligible for the Highway Bridge Replacement and Rehabilitation Program. However, for some states this amount is very low and likely not an accurate reflection of current costs. State Bridge Profile Rhode Island
- 2. © 2015 The American Road & Transportation Builders Association (ARTBA). All rights reserved. No part of this document may be reproduced or transmitted in any form or by any means, electronic, mechanical, photocopying, recording, or otherwise, without prior written permission of ARTBA. Proposed bridge work: Type of Work Number Cost (millions) Daily Crossings Area (sq. meters) Bridge replacement 2 $6.0 6,000 818 Widening & rehabilitation 0 $0.0 0 0 Rehabilitation 715 $2,760.9 14,897,718 702,766 Deck rehabilitation/replacement 0 $0.0 0 0 Other work 2 $0.1 3,050 3,633 Top 10 Most Traveled Structurally Deficient Bridges in the State: County Year Built Daily Crossings Type of Bridge Location Providence 1965 186,500 Urban Interstate I-95 NB & SB over US-1 (Elmwood Avenue) Providence 1964 179,600 Urban other principal arterial Broad Street over I-95 NB & SB and the P&W Railroad Providence 1964 159,200 Urban Interstate I-95 NB & SB over Amtrak Kent 1966 156,400 Urban Interstate I-95 NB & SB over Jefferson Boulevard Providence 1964 147,934 Urban Interstate I-95 NB & SB over Wellington Avenue Kent 1958 77,800 Urban Interstate I-95 NB & SB over RI-2/Quaker Lane Providence 1969 76,700 Urban Interstate I-195 WB over the Seekonk River Providence 1957 72,800 Urban freeway/expressway RI-146/Ed Dowl Highway over RI-15/Mineral Spring Avenue Providence 1956 72,800 Urban freeway/expressway RI-146/Ed Dowl Highway over RI-246/Charles Street Providence 1969 52,678 Urban minor arterial US-6 EB & WB over US-6A/Hartford Avenue Sources: All data is from the 2014 National Bridge Inventory, released by the Federal Highway Administration in January 2015. Note that specific conditions on bridge may have changed as a result of recent work. Cost estimates of bridge work provided as part of the data and have been adjusted to 2014$ for inflation and estimated project costs. Contract awards data is for state and local government awards and comes from McGraw Hill. Note that additional bridge investment may be a part of other contract awards if a smaller bridge project is included with a highway project, and that would not be accounted for in the total in this profile.