1. 1
INDONESIA INVESTMENT COORDINATING BOARD
Press Release
Domestic and Foreign Direct Investment Realization
Steadily Increased, Beyond The Annual Target of 2014
Jakarta, January 28, 2015 – The Investment Coordinating Board of the Republic of
Indonesia (BKPM) today announces the fourth Quarter/Q4 (October-December) 2014
of investment realization figures for both domestic (PMDN) and foreign direct
investment (PMA) based on the Investment Activity Report (LKPM) received by BKPM.
The total investment realization in Q4-2014 was Rp 120.4 trillion, again the new high
record, a 14.3% increase compared to the same period of 2013 (Rp 105.3 trillion).
Furthermore, the domestic direct investment realization amounted as Rp 41.7 trillion,
increased by 22.3% from Rp 34.1 trillion. Meanwhile the total foreign direct
investment realization amounted as much as Rp 78.7 trillion, increased by 10.5% from
Rp 71.2 trillion.
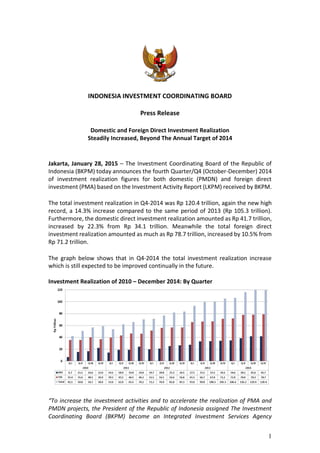
The graph below shows that in Q4-2014 the total investment realization increase
which is still expected to be improved continually in the future.
Investment Realization of 2010 – December 2014: By Quarter
“To increase the investment activities and to accelerate the realization of PMA and
PMDN projects, the President of the Republic of Indonesia assigned The Investment
Coordinating Board (BKPM) become an Integrated Investment Services Agency
2. 2
(namely: Pelayanan Terpadu Satu Pintu/PTSP) at the national (central) level, which
was launched on last Monday, 26 January 2015 by the President. This PTSP model shall
be implemented as well in all provinces, regencies, and cities in Indonesia”, said
Chairman of the Indonesia Investment Coordinating Board, Franky Sibarani.
Investment Realization in Quarter IV 2014
The highlights of the investment realization of the domestic and foreign direct
investment in Q4-2014 were as follows:
1. Domestic Direct Investment Realization
Domestic Direct Investment realization based on sector (five leading sectors)
were: Transportation, Warehouse and Telecommunication (Rp 5.9 trillion); Food
Industry (Rp 5.7 trillion); Food Crops and Plantation (Rp 4.7 trillion); Construction
(Rp 4.5 trillion) and Chemical and Pharmaceutical Industry (Rp 4.3 trillion).
Whereas, should all industrial sectors be combined, it can be seen that industrial
sectors contribute Rp 17.2 trillion or 41.2% of total domestic direct investment
realization.
Domestic Direct Investment realization based on location (five leading locations)
were: East Java (Rp 8.5 trillion); Special Territory of Jakarta (Rp 7.3 trillion); West
Java (Rp 4.9 trillion); Central Java (Rp 3.4 trillion) and South Sumatera (Rp 3.0
trillion).
2. Foreign Direct Investment Realization
Foreign Direct Investment realization based on sector (five leading sectors) were:
Metal, Machinery, and Electronic Industry (US$ 0.9 billion); Mining (US$ 0.9
billion); Construction (US$ 0.8 billion); Food Industry (US$ 0.6 billion) and Food
Crops and Plantation (US$ 0.6 billion). Whereas, should all industrial sectors be
combined, it can be seen that industrial sectors contribute US$ 2.9 billion or
42.3% of total foreign direct investment realization.
Foreign Direct Investment realization based on location (five leading locations)
were: West Java (US$ 1.9 billion); Special Territory of Jakarta (US$ 0.9 billion);
Banten (US$ 0.5 billion); Central Sulawesi (US$ 0.4 billion) and South Sulawesi
(US$ 0.4 billion).
Foreign Direct Investment realization based on country of origin (five leading
countries) were: Singapore (US$ 0.9 billion); Malaysia (US$ 0.8 billion); Japan
(US$ 0.7 billion); China (US$ 0.5 billion); and South Korea (US$ 0.4 billion).
3. Distribution of Project Location
Distribution of project location in Q4-2014 in Java Island is Rp 70.0 trillion and
outside Java Island was Rp 50.4 trillion. The portion of outside Java Island was
increased by 15.6% compared to the same period in 2013 (Rp 43.6 trillion).
3. 3
4. Labor Absorption
Indonesian labor absorption for investment project in Q4-2014 was 470,510
people, consisting of 180,626 people from domestic direct investment and
289,884 people from foreign direct investment.
The Cumulative of Investment Realization in January-December of 2014
The cumulative investment realization in January-December 2014 is Rp 463.1 trillion,
an increase of 16.2% compared to the same period in 2013, consist of the DDI
realization of Rp 156.1 trillion with an increase of 21.8% and the FDI realization of Rp
307.0 trillion with an increase of 13.5%.
The highlights of the investment realization of the Domestic and Foreign Direct
Investment from January to December of 2014, as follows:
1. Domestic Direct Investment Realization
The DDI realization based on sectors (five biggest sectors) were: Electricity, Gas
and Water Supply (Rp 36.3 trillion); Food Industry (Rp 19.6 trillion);
Transportation, Warehouse and Telecommunication (Rp 15.7 trillion); Chemical
and Pharmaceutical Industry (Rp 13.3 trillion) and Real Estate, Industrial Estate,
and Business Activities (Rp 13.1 trillion). Whereas, should all industrial sectors be
combined, it can be seen that industrial sectors contributed as much as Rp 59.0
trillion (37.8%).
Meanwhile, the DDI realization based on locations (five biggest locations) were:
East Java (Rp 38.1 trillion); West Java (Rp 18.7 trillion); Special Territory of Jakarta
(Rp 17.8 trillion); Central Java (Rp 13.6 trillion) and East Kalimantan (Rp 12.9
trillion).
2. Foreign Direct Investment Realization
FDI realization based on sectors (five biggest sectors) were: Mining (US$ 4.7
billion); Food Industry (US$ 3.1 billion); Transportation, Warehouse and
Telecommunication (US$ 3.0 billion); Metal, Machinery and Electronic Industry
(US$ 2.5 billion) and Chemical and Pharmaceutical Industry (US$ 2.3 billion) .
Whereas, should all industrial sectors be combined, it can be seen that industrial
sectors contributed as much as US$ 13.0 billion (45.6%).
Meanwhile, FDI realization based on locations (five biggest locations) were: West
Java (US$ 6.6 billion); Special Territory of Jakarta (US$ 4.5 billion); East Kalimantan
(US$ 2.1 billion); Banten (US$ 2.0 billion) and East Java (US$ 1.8 billion).
FDI realization based on country of origin (five biggest countries) were: Singapore
(US$ 5.8 billion); Japan (US$ 2.7 billion); Malaysia (US$ 1.8 billion); Netherland
(US$ 1.7 billion); United Kingdom (US$ 1.6 billion).
4. 4
3. Distribution of Project Location
The distribution of project location in January until December of 2014 in Java
Island was Rp 263.3 trillion (56.9%), and outside Java Island was Rp 199.8 trillion
(43.1%). Investment in outside Java Island increased by 18.7% compared to the
same period in 2013 (Rp 168.3 trillion).
4. The investment realization based on Economic Corridors in January to December
2014 can be figured as follows:
a. The investment realization of Sumatera Economic Corridor was Rp 70.9 trillion
(15.3%), consist of Rp 29.6 trillion of DDI and US$ 3.8 billion of FDI. The
dominant sectors for DDI were Electricity, Gas and Water Supply (Rp 9.5
trillion); Chemical and Pharmaceutical Industry (Rp 8.3 trillion); Food Crops and
Plantation (Rp 3.4 trillion); Food Industry (Rp 2.9 trillion) and Paper and
Printing Industry (Rp 2.4 trillion); and for FDI were Food Crops and Plantation
(US$ 0.9 billion); Livestock (US$ 0.6 billion); Forestry (US$ 0.6 billion); Fishery
(US$ 0.5 billion) and Mining (US$ 0.5 billion).
b. The investment realization of Java Economic Corridor was Rp 263.3 trillion
(56.8%), consist of Rp 97.1 trillion of DDI and US$ 15.4 billion of FDI. The
dominant sectors for DDI were Electricity, Gas and Water Supply (Rp 23.4
trillion); Transportation, Warehouse and Telecommunication (Rp 13.3 trillion,)
Real Estate, Industrial Estate and Business Activities (Rp 13.1 trillion), Food
Industry (Rp 12.6 trillion) and Construction (Rp 12.1 trillion) and for FDI were
Transportation, Warehouse and Telecommunication (US$ 2.5 billion);
Transport Equipment and Other Transport Industry (US$ 2.0 billion); Food
Industry (US$ 1.7 billion); Metal, Machinery and Electronic Industry (US$ 1.7
billion); Construction (US$ 1.4 billion).
c. The investment realization of Kalimantan Economic Corridor was Rp 71.7
trillion (15.5%), consist of Rp 21.4 trillion of DDI and US$ 4.7 billion of FDI. The
dominant sectors for DDI were Food Crops and Plantation (Rp 8.3 trillion);
Chemical and Pharmaceutical Industry (Rp 3.2 trillion); Food Industry (US$ 3.0
trillion); Electricity, Gas and Water Supply (Rp 2.8 trillion); Transportation,
Warehouse and Telecommunication (US$ 2.1 trillion) and for FDI were Mining
(US$ 1.9 billion); Food Crops and Plantation (US$ 1.6 billion); Food Industry
(US$ 0.5 billion); Transportation, Warehouse and Telecommunication (US$ 0.2
billion); Metal, Machinery and Electronic Industry (US$ 0.2 billion).
d. The investment realization of Sulawesi Economic Corridor was Rp 29.2 trillion
(6.3%), consist of Rp 7.1 trillion DDI and US$ 2.1 billion of FDI. The dominant
sectors for DDI were Non Metallic Mineral Industry (Rp 3.1 trillion); Metal,
Machinery and Electronic Industry (Rp 1.1 trillion); Food Industry (Rp 1.0
trillion); Food Crops and Plantation (Rp 0.7 trillion); Electricity, Gas and Water
Supply (Rp 0.4 trillion); and for FDI were Chemical and Pharmaceutical Industry
(US$ 0.9 billion); Metal, Machinery and Electronic Industry (US$ 0.5 billion);
5. 5
Mining (US$ 0.3 billion); Real Estate, Industrial Estate and Business Activities
(US$ 0.2 billion).
e. The investment realization of Bali and Nusa Tenggara Economic Corridor was
Rp 11.1 trillion (2.4%), consist of Rp 0.5 trillion DDI and US$ 0.9 billion of FDI.
The dominant sectors for DDI were Hotel and Restaurant (Rp 0.2 trillion);
Electricity, Gas and Water Supply (Rp 0.1 trillion); and Real Estate, Industrial
Estate and Business Activities (Rp 0.05 trillion); and for FDI were Mining (US$
0.5 billion); Electricity, Gas and Water Supply (US$ 0.3 billion); and Hotel and
Restaurant (US$ 0.1 billion).
f. The investment realization of Maluku and Papua Economic Corridor was Rp
16.9 trillion (3.7%), consist of Rp 0.5 trillion DDI and US$ 1.5 billion of FDI. The
dominant sectors for DDI were Food Crops and Plantation (Rp 0.3 trillion);
Metal, Machinery and Electronic Industry (Rp 0.2 trillion); and Food Industry
(Rp 0.07 trillion); and for FDI were Mining (US$ 1.3 billion); Food Crops and
Plantation (US$ 0.1 billion); Transportation, Warehouse and
Telecommunication (US$ 0.1 billion) and Fishery (US$ 0.01 billion).
Trend of Investment Realization from 2010 to December 2014
Based on the investment realization data from the period of 2010 until December
2014, there was a significant growth in each quarter for domestic as well as foreign
direct investment. It underlines that investment in Indonesia is on a high level of
sustainable performance.
From the data of investment realization 2010 until 2014, both domestic and foreign
companies are able to run well their bussiness in Indonesia and around 42% of total
investment realization is derived from the expansion of existing bussiness.
“BKPM has also identified and assessed a number of PMA and PMDN companies that
have some obstacles or even cases during their investment realization stages.
Therefore, BKPM will facilitate and coordinate how to find solution of those obstacles
or cases through inter-ministerial meetings as well as meetings with regional
government concerned”, said Franky Sibarani, Chairman of BKPM.
For further information, please contact:
M. M. Azhar Lubis
Deputy Chairman of Investment Monitoring and Implementation
Indonesia Investment Coordinating Board (BKPM)
Jl. Jend. Gatot Subroto 44, Jakarta 12190,
Indonesia Phone: 62-21-5252008 ext.7001
Mobile: 62-8159525035 e-mail : azhar@bkpm.go.id