
Empfohlen
Weitere ähnliche Inhalte
Was ist angesagt?
Was ist angesagt? (17)
Andere mochten auch
Ähnlich wie Glc Market Matters July 2012
Ähnlich wie Glc Market Matters July 2012 (12)
Glc Market Matters July 2012
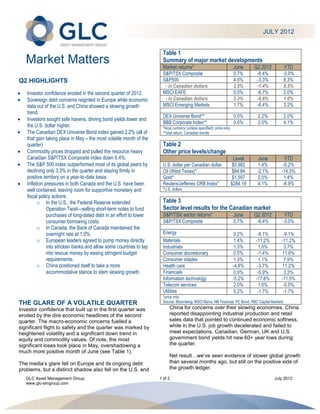
- 1. JULY 2012 Table 1 Market Matters Summary of major market developments Market returns* June Q2 2012 YTD S&P/TSX Composite 0.7% -6.4% -3.0% Q2 HIGHLIGHTS S&P500 4.0% -3.3% 8.3% - in Canadian dollars 2.5% -1.4% 8.5% Investor confidence eroded in the second quarter of 2012. MSCI EAFE 5.0% -6.7% 2.0% Sovereign debt concerns reignited in Europe while economic - in Canadian dollars 5.3% -6.6% 1.0% data out of the U.S. and China showed a slowing growth MSCI Emerging Markets 1.7% -6.4% 3.2% trend. DEX Universe Bond** 0.0% 2.2% 2.0% Investors sought safe havens, driving bond yields lower and BBB Corporate Index** 0.0% 2.0% 4.1% the U.S. dollar higher. *local currency (unless specified); price only The Canadian DEX Universe Bond index gained 2.2% (all of **total return, Canadian bonds that gain taking place in May – the most volatile month of the quarter) Table 2 Commodity prices dropped and pulled the resource heavy Other price levels/change Canadian S&P/TSX Composite index down 6.4%. Level June YTD The S&P 500 index outperformed most of its global peers by U.S. dollar per Canadian dollar $0.982 1.4% -0.2% declining only 3.3% in the quarter and staying firmly in Oil (West Texas)* $84.84 -2.1% -14.3% positive territory on a year-to-date basis. Gold* $1,597 2.0% 1.4% Inflation pressures in both Canada and the U.S. have been Reuters/Jefferies CRB Index* $284.19 4.1% -6.9% well contained, leaving room for supportive monetary and *U.S. dollars fiscal policy actions: o In the U.S., the Federal Reserve extended Table 3 Operation Twist—selling short-term notes to fund Sector level results for the Canadian market purchases of long-dated debt in an effort to lower S&P/TSX sector returns* June Q2 2012 YTD consumer borrowing costs. S&P/TSX Composite 0.7% -6.4% -3.0% o In Canada, the Bank of Canada maintained the overnight rate at 1.0%. Energy 0.2% -8.1% -9.1% o European leaders agreed to pump money directly Materials 1.4% -11.2% -11.2% into stricken banks and allow some countries to tap Industrials 1.3% 1.0% 3.7% into rescue money by easing stringent budget Consumer discretionary 0.5% -1.4% 11.6% requirements. Consumer staples 1.3% 1.1% 7.9% o China positioned itself to take a more Health care -4.8% -3.7% 11.2% accommodative stance to stem slowing growth. Financials 0.9% -5.9% 3.3% Information technology -5.2% -17.8% -11.5% Telecom services 2.0% 1.6% -0.5% Utilities 0.2% -1.7% -1.7% *price only THE GLARE OF A VOLATILE QUARTER Source: Bloomberg, MSCI Barra, NB Financial, PC Bond, RBC Capital Markets Investor confidence that built up in the first quarter was China for concerns over their slowing economies. China eroded by the dire economic headlines of the second reported disappointing industrial production and retail quarter. The macro-economic concerns fuelled a sales data that pointed to continued economic softness, significant flight to safety and the quarter was marked by while in the U.S. job growth decelerated and failed to heightened volatility and a significant down trend in meet expectations. Canadian, German, UK and U.S. equity and commodity values. Of note, the most government bond yields hit new 60+ year lows during significant loses took place in May, overshadowing a the quarter. much more positive month of June (see Table 1). Net result…we’ve seen evidence of slower global growth The media’s glare fell on Europe and its ongoing debt than several months ago, but still on the positive side of problems, but a distinct shadow also fell on the U.S. and the growth ledger. GLC Asset Management Group 1 of 2 July 2012 www.glc-amgroup.com
- 2. CANADIAN MARKET A BALANCED DIET TO DEAL WITH The cyclical nature of the Canadian S&P/TSX composite MARKET FATIGUE index resulted in a rockier quarter than for most global The current fundamentals of the stock market show markets as commodity prices (tied closely to global corporate earnings (particularly those in North America) economic growth trends) declined on slowing growth that continue to demonstrate considerable resiliency prospects for China and the U.S. Canada’s commodity- overall. Even if revenue and earnings growth rates slow link goes a long way in explaining the recent (as one might expect after the sharp economic recovery underperformance of our equity market versus our that we’ve witnessed) many companies are in good neighbour’s to the south. shape with debt/leverage ratios at historic lows and cash balances close to record highs. To find evidence of the Taking a deeper look into the Canadian equity market, solid health of companies in general you need look no the resource sectors were the significant laggards in the further than the continual stream of dividend hike quarter (see Table 3). Energy and Materials sectors announcements, including such announcements from were down 8.1% and 11.2% respectively for the second the less-traditional dividend-paying industries such as quarter of 2012. Oil prices in particular had a tough Energy and Technology. In terms of valuation, stock quarter, dropping close to 18%. Higher oil prices had prices are attractive and they remain well below their been supported by unrest in the Middle East, but we saw longer term averages. Overall market fundamentals that take a back seat to global growth concerns in the compel us to remain constructive on equity markets in second quarter, and the give-back has been quite the long-term, even with the recognition that volatility in dramatic. The stronger U.S. dollar also played a role in the near term is likely. dampening commodity prices (see Table 2). Aluminum, nickel, copper, zinc and gold all declined over the We also recognize that the low bond yields that fixed- quarter. While tough on our stock market, it is worthwhile income investors are experiencing are largely sentiment to remember that lower commodity prices can result in driven. While we continue to see the value of fixed- an indirect tax cut for consumers (e.g. at the gas pumps) income in mitigating volatility in a diversified portfolio, and should help support retail spending. bond markets are exposed to similar market risks as sentiment can quickly shift. Canada’s fallen Information Technology star, Research in Motion, continues to struggle with weakening market Feelings of ‘market fatigue’ are certainly understandable share, poor corporate results and news of layoffs. The as these are challenging times for investors in terms of litany of hard knocks for the company pulled share both very low interest rates, and very low confidence in prices lower, and brought the sector down a sharp equity markets. However, we believe this is no time to 17.8% for the quarter. hide in the shadows (cash or fixed income only) as a compelling case for long term investors to maintain a Not surprisingly, some of the more defensive sectors balanced portfolio continues to build. (Telecommunications and Consumer Staples) led the way in Canada and posted positive results for the quarter. Canadian industrials stocks also fared well even though they tend to be more cyclical in nature. Copyright GLC, You may not reproduce, distribute, or otherwise use any of this article without the prior written consent of GLC Asset Management Group The views expressed in this commentary are those of GLC Asset Management Group Ltd. (GLC) as at the date of publication and are subject to change without notice. This commentary is presented only as a general source of information and is not intended as a solicitation to buy or sell specific investments, nor is it intended to provide tax or legal advice. Prospective investors should review the offering documents relating to any investment carefully before making an investment decision and should ask their advisor for advice based on their specific circumstances. GLC Asset Management Group 2 of 2 July 2012 www.glc-amgroup.com