Visualize and analyze dynamics crm data on heatmap
•
0 gefällt mir•23 views

Heatmaps make it much easier to visualize data. You can get a much clearer picture of what works where and use that to take your business further.

Empfohlen
Empfohlen
Weitere ähnliche Inhalte
Ähnlich wie Visualize and analyze dynamics crm data on heatmap
Ähnlich wie Visualize and analyze dynamics crm data on heatmap (20)
Mehr von AppJetty
Mehr von AppJetty (20)
Kürzlich hochgeladen
Kürzlich hochgeladen (20)
Visualize and analyze dynamics crm data on heatmap
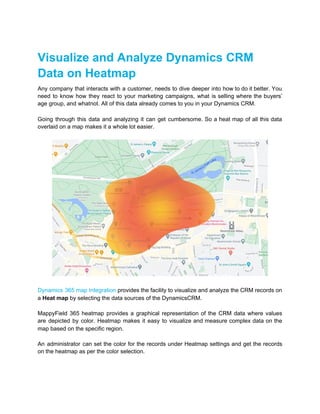
- 1. Visualize and Analyze Dynamics CRM Data on Heatmap Any company that interacts with a customer, needs to dive deeper into how to do it better. You need to know how they react to your marketing campaigns, what is selling where the buyers’ age group, and whatnot. All of this data already comes to you in your Dynamics CRM. Going through this data and analyzing it can get cumbersome. So a heat map of all this data overlaid on a map makes it a whole lot easier. Dynamics 365 map Integration provides the facility to visualize and analyze the CRM records on a Heat map by selecting the data sources of the DynamicsCRM. MappyField 365 heatmap provides a graphical representation of the CRM data where values are depicted by color. Heatmap makes it easy to visualize and measure complex data on the map based on the specific region. An administrator can set the color for the records under Heatmap settings and get the records on the heatmap as per the color selection.
- 2. Please follow the below steps to analyze the specific data sources using MappyFiled 365 heatmap: - Navigate to the MappyField 365 → Heat Map Step-1: Heat Map Settings Configure Color for Heatmap from the MappyField 365 Configuration. You can select Color for High, Medium, and Low values data for the heat map. You can differentiate the records as per the selected region/area by selecting the color as per the High/Medium/Low. Step-2: Navigate to the MappyField 365 → Heat Map Navigate to the MappyField 365 app from the Dynamics dashboard or from the app list.
- 3. From MappyField 365, click on the Heat Map.
- 4. Once the Heat Map is loaded you can select the required options to visualize the values of the records on the map. Step-3: Visualize the CRM Records on the Heat Map To visualize and analyze the CRM Records on the Heatmap, you need to select the below fields: Select Datasource: - Select the Entity and its View for which you want to visualize data as a heat map. You will only be able to use those entities which are configured from the “Entity Mappings”. Select Measure: - The measure will determine how you want to filter the records and create a heat map. Select the aggregation method (CRM data) to be used to color-code the region. - By default, the color code would be based on the number of records (ex. Annual Revenue, Market Capitalization, etc)
- 5. Select Filter: - Select the category in which you want to differentiate the measured data. (ex. Account Name, Business Type, etc). Select a category to filter the data results. Select Display: - Select the ‘Display’ to visualize the selected Datasource and measures on Heatmap.
- 6. - Here, you can select the type of display from the available options to create a Heatmap using Boundary, No Boundary, Pie Chart, Column Chart. Select Region Type: - Select any ‘Region Type’ to display the Heatmap for the Boundary, Pie Chart, or Column Chart. Define the geographical variant in Region Type: City, State, Country, or Postal Code. After selecting all the details, click on the Search button to create a Heatmap
- 7. Step 3A: Heatmap by State wise Boundary: - If you have selected the Boundary as “Display” and State as “Region Type”, the heatmap will display the selected Datasource as State- wise with Boundary and color visualization as per High/Medium/Low level.
- 8. Step 3B: Heat Map by State with No Boundary: - If you have selected the “No Boundary” as Display and “State” as Region Type, it will create a heat map based on the density of the measure without geographical boundaries.
- 9. - By clicking on the “Summary Card”, all the account details will be listed in the detail card with the selected data sources.
- 10. Step 3C: Heatmap by State wise Pie Chart - If you have selected the “Pie Chart” as Display and “State” as Region Type, it will display the Heatmap in the form of pie charts of the selected data sources. - By moving a mouse cursor over any Pie Chart, you will see the tooltip detail, and by clicking on any PieChart, the records will be displayed in the summary card.
- 11. Step 3D: Heatmap by State wise Column Chart - If you have selected the “Column Chart” as Display and “State” as Region Type, it will display the Heatmap in the form of a column chart of the selected data sources.
- 12. - By moving a mouse cursor over any Column Chart, you will see the tooltip detail, and by clicking on any Column Chart, the records will be displayed in the summary card.
- 13. Here only the Statewise Heat maps are shown. But a salesperson or an administrator can visualize the heatmap as per other regions by inserting the County, City, or Postal Code and selecting the different data sources with a relevant measure & category. Being a sales manager with DynamcisCRM administrator rights, visualize any records like Sales Revenue, Travel Expenses, Service-based activities, etc. as heatmaps and geographical displays and numerics will tell you what further planning should be done for your sales team. Source : https://www.appjetty.com/blog/visualize-and-analyze-dynamics-crm-data-on-heatmap/