SlideShare ist ein Scribd-Unternehmen logo
1 von 4
Name:                           __________________ Period:_______ Date:_______________

                                      Making A Contour Map I
Directions:
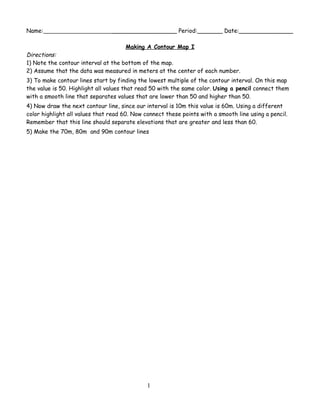
1) Note the contour interval at the bottom of the map.
2) Assume that the data was measured in meters at the center of each number.
3) To make contour lines start by finding the lowest multiple of the contour interval. On this map
the value is 50. Highlight all values that read 50 with the same color. Using a pencil connect them
with a smooth line that separates values that are lower than 50 and higher than 50.
4) Now draw the next contour line, since our interval is 10m this value is 60m. Using a different
color highlight all values that read 60. Now connect these points with a smooth line using a pencil.
Remember that this line should separate elevations that are greater and less than 60.
5) Make the 70m, 80m and 90m contour lines


                                              1
42      45       50        51        49      48          48     47       46       44

        44      47        51       55        51      49          48     48       48       45

        46      49       55        57        56      50          49     49       50       45

        47      50       56        62        60      54          50     53       54       50

        48      55       60        65        63      57          54     58       57       53

        50      57       64        67        67      60          58     62       60       55

        52      58       67        73        73      65          60     63       60       55

        53      60       69        78        80      70          65     68       60       55

        54      60       70        79        85      72          72     74       64       54

        55      61       69        79        90      75          80     75       66       55

        55      60       67        77        80      75          80     75       65       55

        53      60       67        73        75      72          75     70       65       55

        52      57       65        68        68      68          69     69       61       54

        50      56       62        64        63       61         60     64       60       54

        48      51       58        57        59      50          48     54       56       53

        45      47       52        53        51      49          46     49       51       51

        43      45       48        46        49      46          44     45       49       48

                                        Contour Interval = 10m
Name:             _______                  __________ Period:_______ Date:_______________

                                      Making A Contour Map II
Directions:
1) Note the contour interval at the bottom of the map.
2) Assume that the data was measured in meters at the center of each number.
3) To make contour lines start by finding the lowest multiple of the contour interval. On this map
the lowest value is ____. Highlight these with the same color. Using a pencil connect them with a
smooth line that separates values that are lower and higher.
4) Now draw the next contour line, since our interval is 10m this value is _____. Using a different
color highlight all these values. Now connect these points with a smooth line using a pencil.
Remember that this line should separate elevations that are greater and less.
5) Make the remaining contour lines


                                              2
11   13   12   11        13       14         12   15   13   11

13   15   13   12        14       16         22   20   16   12

15   17   20   18        15      25          32   28   21   15

17   16   22   31        36      39          40   33   27   20

18   18   20   37        41      43          40   40   30   22

26   25   25   37        38      30          32   42   34   26

31   31   31   27        24      26          27   40   39   27

25   19   18   15        19      25          30   41   39   28

17   17   17   18        21      29          33   41   38   27

14   15   17   20        30      35          36   43   35   26

13   17   20   32        40       41         43   40   31   22

12   15   25   36        42      42          40   33   25   18

12   16   24   35        38      35          28   26   18   15

11   14   20   26        30      27          21   19   16   14

11   13   15   19        21      20          17   14   13   11

                    Contour Interval = 10m


                          3
Name:                           __________________ Period:_______ Date:_______________

                                      Making A Contour Map III
Directions:
1) Note the contour interval at the bottom of the map.
2) Assume that the data was measured in meters at the center of each number.
3) To make contour lines start by finding the lowest multiple of the contour interval. On this map
the lowest value is ____. Highlight these with the same color. Using a pencil connect them with a
smooth line that separates values that are lower and higher.
4) Now draw the next contour line, since our interval is 10m this value is _____. Using a different
color highlight all these values. Now connect these points with a smooth line using a pencil.
Remember that this line should separate elevations that are greater and less.
5) Make the remaining contour lines


      61    62    63    64    64      65    66       68    67    67    68   68   65   66    64

      62    62    64    67    67      69    70       71    72    72    72   70   68   67    65

      62    62    67    69    72      74    76       78    78    78    78   76   73   70    66

      64    65    70    74    77      80    81       82    84    84    84   82   80   72    67

      65    68    73    77    82      86    88       89    90    90    89   87   82   75    68

      66    72    78    82    87      90    93       95    96    96    95   91   83   76    69

      67    74    81    85    89      93    98       100   102   103   99   90   81   74    68

      66    76    82    88    92      98    105      109   110   100   92   84   78   72    67

      68    77    82    89    96      103   110      112   107   93    84   78   74   70    66

      69    78    82    89    91      91    94       97    100   85    75   70   68   67    66

      70    77    83    82    81      82    85       90    91    74    69   68   67   66    65

      70    78    79    78    74      76    80       84    88    75    68   67   66   65    64

      69    73    71    68    67      70    73       80    83    83    76   70   67   66    65

      68    70    68    67    66      68    68       73    79    81    80   75   71   69    67

      66    68    67    66    65      67    66       67    68    69    70   71   71   70    68
                                       Contour Interval = 10m


                                                 4

Weitere ähnliche Inhalte

Andere mochten auch

Imperialism day9.2012
Imperialism day9.2012Imperialism day9.2012
Imperialism day9.2012Meg
 
Protean-Techbazaar Presentation
Protean-Techbazaar PresentationProtean-Techbazaar Presentation
Protean-Techbazaar PresentationRohit Agarwal
 
No Panic workshop
No Panic workshopNo Panic workshop
No Panic workshopNo Panic
 
20091221_Personal data_03
20091221_Personal data_0320091221_Personal data_03
20091221_Personal data_03sbur
 
Pim marketing trend report russian version
Pim marketing trend report   russian versionPim marketing trend report   russian version
Pim marketing trend report russian versionPim van Geest
 
PodCamp 2010 Toronto: @CBarger: The Social Web, Crisis Response & Reputation ...
PodCamp 2010 Toronto: @CBarger: The Social Web, Crisis Response & Reputation ...PodCamp 2010 Toronto: @CBarger: The Social Web, Crisis Response & Reputation ...
PodCamp 2010 Toronto: @CBarger: The Social Web, Crisis Response & Reputation ...General Motors of Canada
 
Nuffnang Blogopolis 2011 - Bloggers working with brands
Nuffnang Blogopolis 2011 - Bloggers working with brandsNuffnang Blogopolis 2011 - Bloggers working with brands
Nuffnang Blogopolis 2011 - Bloggers working with brandsLouder
 
LeafRunningSustBusinessFinal
LeafRunningSustBusinessFinalLeafRunningSustBusinessFinal
LeafRunningSustBusinessFinalAlice Facincani
 

Andere mochten auch (20)

latest slide
latest slidelatest slide
latest slide
 
ttttt
tttttttttt
ttttt
 
Poetry
PoetryPoetry
Poetry
 
Sedimentary
SedimentarySedimentary
Sedimentary
 
Rain Garden
Rain GardenRain Garden
Rain Garden
 
Imperialism day9.2012
Imperialism day9.2012Imperialism day9.2012
Imperialism day9.2012
 
College
CollegeCollege
College
 
Di jan 28th
Di jan 28thDi jan 28th
Di jan 28th
 
Protean-Techbazaar Presentation
Protean-Techbazaar PresentationProtean-Techbazaar Presentation
Protean-Techbazaar Presentation
 
No Panic workshop
No Panic workshopNo Panic workshop
No Panic workshop
 
20091221_Personal data_03
20091221_Personal data_0320091221_Personal data_03
20091221_Personal data_03
 
Mi Slideshare
Mi SlideshareMi Slideshare
Mi Slideshare
 
Cell structures
Cell structuresCell structures
Cell structures
 
Be Happy!!
Be  Happy!!Be  Happy!!
Be Happy!!
 
Pim marketing trend report russian version
Pim marketing trend report   russian versionPim marketing trend report   russian version
Pim marketing trend report russian version
 
PodCamp 2010 Toronto: @CBarger: The Social Web, Crisis Response & Reputation ...
PodCamp 2010 Toronto: @CBarger: The Social Web, Crisis Response & Reputation ...PodCamp 2010 Toronto: @CBarger: The Social Web, Crisis Response & Reputation ...
PodCamp 2010 Toronto: @CBarger: The Social Web, Crisis Response & Reputation ...
 
Nuffnang Blogopolis 2011 - Bloggers working with brands
Nuffnang Blogopolis 2011 - Bloggers working with brandsNuffnang Blogopolis 2011 - Bloggers working with brands
Nuffnang Blogopolis 2011 - Bloggers working with brands
 
Pp Lect9 10 1
Pp Lect9 10 1Pp Lect9 10 1
Pp Lect9 10 1
 
tiwari
tiwaritiwari
tiwari
 
LeafRunningSustBusinessFinal
LeafRunningSustBusinessFinalLeafRunningSustBusinessFinal
LeafRunningSustBusinessFinal
 

Ähnlich wie Contours123 (20)

Lit101 b
Lit101 bLit101 b
Lit101 b
 
Calculating Final Trimster Grade
Calculating Final Trimster GradeCalculating Final Trimster Grade
Calculating Final Trimster Grade
 
D wotd
D wotdD wotd
D wotd
 
Magic S
Magic SMagic S
Magic S
 
入侵物種管理與防制推動 990814-1
入侵物種管理與防制推動 990814-1入侵物種管理與防制推動 990814-1
入侵物種管理與防制推動 990814-1
 
101 c
101 c101 c
101 c
 
101 c
101 c101 c
101 c
 
Snap%202010%20 answer%20keys
Snap%202010%20 answer%20keysSnap%202010%20 answer%20keys
Snap%202010%20 answer%20keys
 
Slideshow group4
Slideshow group4Slideshow group4
Slideshow group4
 
Sexto
SextoSexto
Sexto
 
Lit101 d
Lit101 dLit101 d
Lit101 d
 
D
DD
D
 
Escudos
EscudosEscudos
Escudos
 
Bolt details
Bolt detailsBolt details
Bolt details
 
Times table practice
Times table practiceTimes table practice
Times table practice
 
Stations lab
Stations labStations lab
Stations lab
 
Multiplication 20 square
Multiplication 20 squareMultiplication 20 square
Multiplication 20 square
 
Peso ideal tabla distripronavit
Peso ideal tabla distripronavitPeso ideal tabla distripronavit
Peso ideal tabla distripronavit
 
到都市的權利
到都市的權利到都市的權利
到都市的權利
 
Nilai Kelas Iii Sd Merak
Nilai Kelas Iii Sd MerakNilai Kelas Iii Sd Merak
Nilai Kelas Iii Sd Merak
 

Mehr von West Hollow MS Ms. Gill (20)

Welcome to Regents Earth Science
Welcome to Regents Earth ScienceWelcome to Regents Earth Science
Welcome to Regents Earth Science
 
Syllabus earth science
Syllabus earth scienceSyllabus earth science
Syllabus earth science
 
Prologue pp1 2012
Prologue pp1 2012Prologue pp1 2012
Prologue pp1 2012
 
Prologue np1 2012
Prologue np1 2012Prologue np1 2012
Prologue np1 2012
 
Geologic History Note Packet
Geologic History Note PacketGeologic History Note Packet
Geologic History Note Packet
 
Geologic History Powerpoint Notes
Geologic History Powerpoint NotesGeologic History Powerpoint Notes
Geologic History Powerpoint Notes
 
Earthquakes final
Earthquakes finalEarthquakes final
Earthquakes final
 
Dynamic earth np1
Dynamic earth np1Dynamic earth np1
Dynamic earth np1
 
Earthquakes final
Earthquakes finalEarthquakes final
Earthquakes final
 
Plates ex2
Plates ex2Plates ex2
Plates ex2
 
Plates Lab
Plates LabPlates Lab
Plates Lab
 
Oceans and Basin Do Now
Oceans and Basin Do NowOceans and Basin Do Now
Oceans and Basin Do Now
 
Pangaea lab
Pangaea labPangaea lab
Pangaea lab
 
Ocean bottom profiles
Ocean bottom profilesOcean bottom profiles
Ocean bottom profiles
 
Global Tectonic Plates HW
Global Tectonic Plates HWGlobal Tectonic Plates HW
Global Tectonic Plates HW
 
Earths Interior Questions HW
Earths Interior Questions HWEarths Interior Questions HW
Earths Interior Questions HW
 
Dynamic Earth Note Packet
Dynamic Earth Note PacketDynamic Earth Note Packet
Dynamic Earth Note Packet
 
Dynamic Earth
Dynamic EarthDynamic Earth
Dynamic Earth
 
Earths dimension sci 8 ppt np1
Earths dimension sci 8 ppt np1Earths dimension sci 8 ppt np1
Earths dimension sci 8 ppt np1
 
Metamorphic Rocks
Metamorphic RocksMetamorphic Rocks
Metamorphic Rocks
 

Contours123

  • 1. Name: __________________ Period:_______ Date:_______________ Making A Contour Map I Directions: 1) Note the contour interval at the bottom of the map. 2) Assume that the data was measured in meters at the center of each number. 3) To make contour lines start by finding the lowest multiple of the contour interval. On this map the value is 50. Highlight all values that read 50 with the same color. Using a pencil connect them with a smooth line that separates values that are lower than 50 and higher than 50. 4) Now draw the next contour line, since our interval is 10m this value is 60m. Using a different color highlight all values that read 60. Now connect these points with a smooth line using a pencil. Remember that this line should separate elevations that are greater and less than 60. 5) Make the 70m, 80m and 90m contour lines 1
  • 2. 42 45 50 51 49 48 48 47 46 44 44 47 51 55 51 49 48 48 48 45 46 49 55 57 56 50 49 49 50 45 47 50 56 62 60 54 50 53 54 50 48 55 60 65 63 57 54 58 57 53 50 57 64 67 67 60 58 62 60 55 52 58 67 73 73 65 60 63 60 55 53 60 69 78 80 70 65 68 60 55 54 60 70 79 85 72 72 74 64 54 55 61 69 79 90 75 80 75 66 55 55 60 67 77 80 75 80 75 65 55 53 60 67 73 75 72 75 70 65 55 52 57 65 68 68 68 69 69 61 54 50 56 62 64 63 61 60 64 60 54 48 51 58 57 59 50 48 54 56 53 45 47 52 53 51 49 46 49 51 51 43 45 48 46 49 46 44 45 49 48 Contour Interval = 10m Name: _______ __________ Period:_______ Date:_______________ Making A Contour Map II Directions: 1) Note the contour interval at the bottom of the map. 2) Assume that the data was measured in meters at the center of each number. 3) To make contour lines start by finding the lowest multiple of the contour interval. On this map the lowest value is ____. Highlight these with the same color. Using a pencil connect them with a smooth line that separates values that are lower and higher. 4) Now draw the next contour line, since our interval is 10m this value is _____. Using a different color highlight all these values. Now connect these points with a smooth line using a pencil. Remember that this line should separate elevations that are greater and less. 5) Make the remaining contour lines 2
  • 3. 11 13 12 11 13 14 12 15 13 11 13 15 13 12 14 16 22 20 16 12 15 17 20 18 15 25 32 28 21 15 17 16 22 31 36 39 40 33 27 20 18 18 20 37 41 43 40 40 30 22 26 25 25 37 38 30 32 42 34 26 31 31 31 27 24 26 27 40 39 27 25 19 18 15 19 25 30 41 39 28 17 17 17 18 21 29 33 41 38 27 14 15 17 20 30 35 36 43 35 26 13 17 20 32 40 41 43 40 31 22 12 15 25 36 42 42 40 33 25 18 12 16 24 35 38 35 28 26 18 15 11 14 20 26 30 27 21 19 16 14 11 13 15 19 21 20 17 14 13 11 Contour Interval = 10m 3
  • 4. Name: __________________ Period:_______ Date:_______________ Making A Contour Map III Directions: 1) Note the contour interval at the bottom of the map. 2) Assume that the data was measured in meters at the center of each number. 3) To make contour lines start by finding the lowest multiple of the contour interval. On this map the lowest value is ____. Highlight these with the same color. Using a pencil connect them with a smooth line that separates values that are lower and higher. 4) Now draw the next contour line, since our interval is 10m this value is _____. Using a different color highlight all these values. Now connect these points with a smooth line using a pencil. Remember that this line should separate elevations that are greater and less. 5) Make the remaining contour lines 61 62 63 64 64 65 66 68 67 67 68 68 65 66 64 62 62 64 67 67 69 70 71 72 72 72 70 68 67 65 62 62 67 69 72 74 76 78 78 78 78 76 73 70 66 64 65 70 74 77 80 81 82 84 84 84 82 80 72 67 65 68 73 77 82 86 88 89 90 90 89 87 82 75 68 66 72 78 82 87 90 93 95 96 96 95 91 83 76 69 67 74 81 85 89 93 98 100 102 103 99 90 81 74 68 66 76 82 88 92 98 105 109 110 100 92 84 78 72 67 68 77 82 89 96 103 110 112 107 93 84 78 74 70 66 69 78 82 89 91 91 94 97 100 85 75 70 68 67 66 70 77 83 82 81 82 85 90 91 74 69 68 67 66 65 70 78 79 78 74 76 80 84 88 75 68 67 66 65 64 69 73 71 68 67 70 73 80 83 83 76 70 67 66 65 68 70 68 67 66 68 68 73 79 81 80 75 71 69 67 66 68 67 66 65 67 66 67 68 69 70 71 71 70 68 Contour Interval = 10m 4