The figure below shows a scatterplot of some data together with a l.pdf
•
0 gefällt mir•2 views
The scatterplot shows data with a line claimed to be the least squares line fitted to the data. However, the least squares line must pass through the average x and y values given as 4.4 and 9.9, respectively. The plotted line does not pass through this point, so it cannot be the true least squares line fitted to the data.
Melden
Teilen
Melden
Teilen
Downloaden Sie, um offline zu lesen
Empfohlen
Empfohlen
Weitere ähnliche Inhalte
Mehr von amrahlifestyle
Mehr von amrahlifestyle (17)
The field of quotients of any fieldDis isomorphic toD.WhySoluti.pdf
The field of quotients of any fieldDis isomorphic toD.WhySoluti.pdf
The feeding habits of two species of net-casting spiders are studied.pdf
The feeding habits of two species of net-casting spiders are studied.pdf
The Federal Reserve uses the federal funds rate as an operating targe.pdf
The Federal Reserve uses the federal funds rate as an operating targe.pdf
The feeding habits of two-species of net-casting spiders, DEINOPIS a.pdf
The feeding habits of two-species of net-casting spiders, DEINOPIS a.pdf
The FASB requires probable contingent losses that can be reasonably .pdf
The FASB requires probable contingent losses that can be reasonably .pdf
The Erie Canal has been called America’s first school of engineeri.pdf
The Erie Canal has been called America’s first school of engineeri.pdf
The factors of inflation in Malaysia. ( with literature review)T.pdf
The factors of inflation in Malaysia. ( with literature review)T.pdf
The family is the most basic of all human groups.ATrueSolution.pdf
The family is the most basic of all human groups.ATrueSolution.pdf
The events X and Y are mutually exclusive. Suppose P(X)=.05 and P(Y.pdf
The events X and Y are mutually exclusive. Suppose P(X)=.05 and P(Y.pdf
the events X and Y are mutually exculsive. Suppose P(X)=.05 and P(Y.pdf
the events X and Y are mutually exculsive. Suppose P(X)=.05 and P(Y.pdf
The EU and its common market are characterized by four liberties. .pdf
The EU and its common market are characterized by four liberties. .pdf
The error of rejecting a true null hypothesis is A a Type I erro.pdf
The error of rejecting a true null hypothesis is A a Type I erro.pdf
The Environmental Protection Agency must inspect nine factories for .pdf
The Environmental Protection Agency must inspect nine factories for .pdf
The entire SDLC process can be very lengthy and require a lot of pla.pdf
The entire SDLC process can be very lengthy and require a lot of pla.pdf
The engineering profession is similar to medicine and law in that en.pdf
The engineering profession is similar to medicine and law in that en.pdf
The Ebola crisis brought many moral and ethical and safety dilemmas .pdf
The Ebola crisis brought many moral and ethical and safety dilemmas .pdf
The duties of the Federal Reserve include all of the following excep.pdf
The duties of the Federal Reserve include all of the following excep.pdf
Kürzlich hochgeladen
Kürzlich hochgeladen (20)
Micro-Scholarship, What it is, How can it help me.pdf
Micro-Scholarship, What it is, How can it help me.pdf
UGC NET Paper 1 Mathematical Reasoning & Aptitude.pdf
UGC NET Paper 1 Mathematical Reasoning & Aptitude.pdf
Kodo Millet PPT made by Ghanshyam bairwa college of Agriculture kumher bhara...
Kodo Millet PPT made by Ghanshyam bairwa college of Agriculture kumher bhara...
Food safety_Challenges food safety laboratories_.pdf
Food safety_Challenges food safety laboratories_.pdf
Salient Features of India constitution especially power and functions
Salient Features of India constitution especially power and functions
On National Teacher Day, meet the 2024-25 Kenan Fellows
On National Teacher Day, meet the 2024-25 Kenan Fellows
HMCS Max Bernays Pre-Deployment Brief (May 2024).pptx
HMCS Max Bernays Pre-Deployment Brief (May 2024).pptx
Basic Civil Engineering first year Notes- Chapter 4 Building.pptx
Basic Civil Engineering first year Notes- Chapter 4 Building.pptx
The figure below shows a scatterplot of some data together with a l.pdf
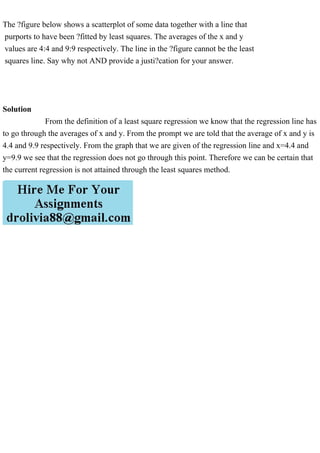
- 1. The ?figure below shows a scatterplot of some data together with a line that purports to have been ?fitted by least squares. The averages of the x and y values are 4:4 and 9:9 respectively. The line in the ?figure cannot be the least squares line. Say why not AND provide a justi?cation for your answer. Solution From the definition of a least square regression we know that the regression line has to go through the averages of x and y. From the prompt we are told that the average of x and y is 4.4 and 9.9 respectively. From the graph that we are given of the regression line and x=4.4 and y=9.9 we see that the regression does not go through this point. Therefore we can be certain that the current regression is not attained through the least squares method.