SlideShare ist ein Scribd-Unternehmen logo
1 von 2
Downloaden Sie, um offline zu lesen
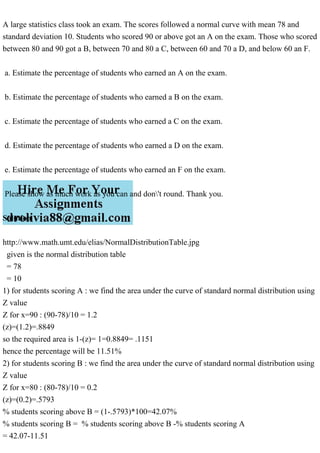
A large statistics class took an exam. The scores followed a normal curve with mean 78 and
standard deviation 10. Students who scored 90 or above got an A on the exam. Those who scored
between 80 and 90 got a B, between 70 and 80 a C, between 60 and 70 a D, and below 60 an F.
a. Estimate the percentage of students who earned an A on the exam.
b. Estimate the percentage of students who earned a B on the exam.
c. Estimate the percentage of students who earned a C on the exam.
d. Estimate the percentage of students who earned a D on the exam.
e. Estimate the percentage of students who earned an F on the exam.
Please show as much work as you can and don't round. Thank you.
Solution
http://www.math.umt.edu/elias/NormalDistributionTable.jpg
given is the normal distribution table
= 78
= 10
1) for students scoring A : we find the area under the curve of standard normal distribution using
Z value
Z for x=90 : (90-78)/10 = 1.2
(z)=(1.2)=.8849
so the required area is 1-(z)= 1=0.8849= .1151
hence the percentage will be 11.51%
2) for students scoring B : we find the area under the curve of standard normal distribution using
Z value
Z for x=80 : (80-78)/10 = 0.2
(z)=(0.2)=.5793
% students scoring above B = (1-.5793)*100=42.07%
% students scoring B = % students scoring above B -% students scoring A
= 42.07-11.51
= 30.56%
3) for students scoring C : we find the area under the curve of standard normal distribution using
Z value
Z for x=70 : (70-78)/10 = -0.8
(z)=(-0.8)=.2119
% students scoring above C = (1-.2119)*100=78.81%
% students scoring C = % students scoring above C -% students scoring above B
= 78.81-42.07
= 36.74%
4) for students scoring D : we find the area under the curve of standard normal distribution using
Z value
Z for x=60 : (60-78)/10 = -1.8
(z)=(-1.8)=.0359
% students scoring above D = (1-.0359)*100=96.41%
% students scoring D = % students scoring above D -% students scoring above C
= 96.41-78.81
= 17.60%
5) for students scoring F : we find the area under the curve of standard normal distribution using
Z value
Z for x=60 : (60-78)/10 = -1.8
(z)=(-1.8)=.0359
% students scoring F =100- % students scoring above D
% students scoring D = % students scoring above D -% students scoring above C = = 100 -
96.41
= 3.59%
Verification: Sum of all 5 percentages = 100

Weitere ähnliche Inhalte

Ähnlich wie A large statistics class took an exam. The scores followed a normal .pdf

Qnt 351 final exam mcq`s correct answers 100%
Qnt 351 final exam mcq`s correct answers 100%Qnt 351 final exam mcq`s correct answers 100%
Qnt 351 final exam mcq`s correct answers 100%
Austing_3
 
Qnt 351 final exam mcq`s correct answers 100%
Qnt 351 final exam mcq`s correct answers 100%Qnt 351 final exam mcq`s correct answers 100%
Qnt 351 final exam mcq`s correct answers 100%
liamSali
 
(New) final exam for qnt 351 all correct answers 100%
(New) final exam for qnt 351 all correct answers 100%(New) final exam for qnt 351 all correct answers 100%
(New) final exam for qnt 351 all correct answers 100%
quikly11
 
(New) final exam for qnt 351 qnt 351 all correct answers 100%
(New) final exam for qnt 351 qnt 351 all correct answers 100%(New) final exam for qnt 351 qnt 351 all correct answers 100%
(New) final exam for qnt 351 qnt 351 all correct answers 100%
ri0908O0o
 

Ähnlich wie A large statistics class took an exam. The scores followed a normal .pdf (20)

QRB 501 Final Exam 2015 version
QRB 501 Final Exam 2015 versionQRB 501 Final Exam 2015 version
QRB 501 Final Exam 2015 version
 
QRB 501 Final Exam 2015 version
QRB 501 Final Exam 2015 versionQRB 501 Final Exam 2015 version
QRB 501 Final Exam 2015 version
 
Problem statement mathematical foundations
Problem statement mathematical foundationsProblem statement mathematical foundations
Problem statement mathematical foundations
 
Quantitative Aptitude Concepts
Quantitative Aptitude ConceptsQuantitative Aptitude Concepts
Quantitative Aptitude Concepts
 
Statistics for interpreting test scores
Statistics for interpreting test scoresStatistics for interpreting test scores
Statistics for interpreting test scores
 
3. Application of Normal Distribution@Dr. Vsingh.pdf
3. Application of Normal Distribution@Dr. Vsingh.pdf3. Application of Normal Distribution@Dr. Vsingh.pdf
3. Application of Normal Distribution@Dr. Vsingh.pdf
 
Lecture 10.4 bt
Lecture 10.4 btLecture 10.4 bt
Lecture 10.4 bt
 
GenEd_math.pdf
GenEd_math.pdfGenEd_math.pdf
GenEd_math.pdf
 
Ged Mathematical Test
Ged Mathematical TestGed Mathematical Test
Ged Mathematical Test
 
Applied 40S April 7, 2009
Applied 40S April 7, 2009Applied 40S April 7, 2009
Applied 40S April 7, 2009
 
Csci101 lect08b matlab_programs
Csci101 lect08b matlab_programsCsci101 lect08b matlab_programs
Csci101 lect08b matlab_programs
 
Statistics+-+11th+Elite+(1).pdf
Statistics+-+11th+Elite+(1).pdfStatistics+-+11th+Elite+(1).pdf
Statistics+-+11th+Elite+(1).pdf
 
Qnt 351 final exam mcq`s correct answers 100%
Qnt 351 final exam mcq`s correct answers 100%Qnt 351 final exam mcq`s correct answers 100%
Qnt 351 final exam mcq`s correct answers 100%
 
Qnt 351 final exam mcq`s correct answers 100%
Qnt 351 final exam mcq`s correct answers 100%Qnt 351 final exam mcq`s correct answers 100%
Qnt 351 final exam mcq`s correct answers 100%
 
(New) final exam for qnt 351 all correct answers 100%
(New) final exam for qnt 351 all correct answers 100%(New) final exam for qnt 351 all correct answers 100%
(New) final exam for qnt 351 all correct answers 100%
 
(New) final exam for qnt 351 qnt 351 all correct answers 100%
(New) final exam for qnt 351 qnt 351 all correct answers 100%(New) final exam for qnt 351 qnt 351 all correct answers 100%
(New) final exam for qnt 351 qnt 351 all correct answers 100%
 
Cumulative Frequency Revision
Cumulative Frequency RevisionCumulative Frequency Revision
Cumulative Frequency Revision
 
Measures of Dispersion: Standard Deviation and Co- efficient of Variation
Measures of Dispersion: Standard Deviation and Co- efficient of Variation Measures of Dispersion: Standard Deviation and Co- efficient of Variation
Measures of Dispersion: Standard Deviation and Co- efficient of Variation
 
Statistics Assignment Help
Statistics Assignment HelpStatistics Assignment Help
Statistics Assignment Help
 
Statistics and Probability Reviewer.pptx
Statistics and Probability Reviewer.pptxStatistics and Probability Reviewer.pptx
Statistics and Probability Reviewer.pptx
 

Mehr von amonkarsatish99

Mehr von amonkarsatish99 (12)

A major corporation has branch offices in eight major cities in the .pdf
A major corporation has branch offices in eight major cities in the .pdfA major corporation has branch offices in eight major cities in the .pdf
A major corporation has branch offices in eight major cities in the .pdf
 
A major advantage of community trials is that they are A. able .pdf
A major advantage of community trials is that they are A. able .pdfA major advantage of community trials is that they are A. able .pdf
A major advantage of community trials is that they are A. able .pdf
 
A machine has 9 identical components that function independently. T.pdf
A machine has 9 identical components that function independently.  T.pdfA machine has 9 identical components that function independently.  T.pdf
A machine has 9 identical components that function independently. T.pdf
 
A machine fills soda cans with amounts X, in ounces, that vary norma.pdf
A machine fills soda cans with amounts X, in ounces, that vary norma.pdfA machine fills soda cans with amounts X, in ounces, that vary norma.pdf
A machine fills soda cans with amounts X, in ounces, that vary norma.pdf
 
A loan is offered with monthly payments and a 10.50 percent APR. Wha.pdf
A loan is offered with monthly payments and a 10.50 percent APR. Wha.pdfA loan is offered with monthly payments and a 10.50 percent APR. Wha.pdf
A loan is offered with monthly payments and a 10.50 percent APR. Wha.pdf
 
A list of 50 subjects is entered into a computer file and then sorte.pdf
A list of 50 subjects is entered into a computer file and then sorte.pdfA list of 50 subjects is entered into a computer file and then sorte.pdf
A list of 50 subjects is entered into a computer file and then sorte.pdf
 
A legislative committee consists of 7 Democrats, 10 Republicans and .pdf
A legislative committee consists of 7 Democrats, 10 Republicans and .pdfA legislative committee consists of 7 Democrats, 10 Republicans and .pdf
A legislative committee consists of 7 Democrats, 10 Republicans and .pdf
 
A leverage point is a data point that 1. has an unusual respons.pdf
A leverage point is a data point that 1. has an unusual respons.pdfA leverage point is a data point that 1. has an unusual respons.pdf
A leverage point is a data point that 1. has an unusual respons.pdf
 
A large wooden floor is laid with strips 2 inches wide and with ne.pdf
A large wooden floor is laid with strips 2 inches wide and with ne.pdfA large wooden floor is laid with strips 2 inches wide and with ne.pdf
A large wooden floor is laid with strips 2 inches wide and with ne.pdf
 
A line has x and y intercepts as 5 and 2. What is the slope of the l.pdf
A line has x and y intercepts as 5 and 2. What is the slope of the l.pdfA line has x and y intercepts as 5 and 2. What is the slope of the l.pdf
A line has x and y intercepts as 5 and 2. What is the slope of the l.pdf
 
A large normal sample was used to construct two-sided (symmetric) 97.pdf
A large normal sample was used to construct two-sided (symmetric) 97.pdfA large normal sample was used to construct two-sided (symmetric) 97.pdf
A large normal sample was used to construct two-sided (symmetric) 97.pdf
 
A large Midwestern university is interested in estimating the mean t.pdf
A large Midwestern university is interested in estimating the mean t.pdfA large Midwestern university is interested in estimating the mean t.pdf
A large Midwestern university is interested in estimating the mean t.pdf
 

Kürzlich hochgeladen

The basics of sentences session 3pptx.pptx
The basics of sentences session 3pptx.pptxThe basics of sentences session 3pptx.pptx
The basics of sentences session 3pptx.pptx
heathfieldcps1
 
Russian Escort Service in Delhi 11k Hotel Foreigner Russian Call Girls in Delhi
Russian Escort Service in Delhi 11k Hotel Foreigner Russian Call Girls in DelhiRussian Escort Service in Delhi 11k Hotel Foreigner Russian Call Girls in Delhi
Russian Escort Service in Delhi 11k Hotel Foreigner Russian Call Girls in Delhi
kauryashika82
 
Spellings Wk 3 English CAPS CARES Please Practise
Spellings Wk 3 English CAPS CARES Please PractiseSpellings Wk 3 English CAPS CARES Please Practise
Spellings Wk 3 English CAPS CARES Please Practise
AnaAcapella
 

Kürzlich hochgeladen (20)

ComPTIA Overview | Comptia Security+ Book SY0-701
ComPTIA Overview | Comptia Security+ Book SY0-701ComPTIA Overview | Comptia Security+ Book SY0-701
ComPTIA Overview | Comptia Security+ Book SY0-701
 
UGC NET Paper 1 Mathematical Reasoning & Aptitude.pdf
UGC NET Paper 1 Mathematical Reasoning & Aptitude.pdfUGC NET Paper 1 Mathematical Reasoning & Aptitude.pdf
UGC NET Paper 1 Mathematical Reasoning & Aptitude.pdf
 
Food safety_Challenges food safety laboratories_.pdf
Food safety_Challenges food safety laboratories_.pdfFood safety_Challenges food safety laboratories_.pdf
Food safety_Challenges food safety laboratories_.pdf
 
The basics of sentences session 3pptx.pptx
The basics of sentences session 3pptx.pptxThe basics of sentences session 3pptx.pptx
The basics of sentences session 3pptx.pptx
 
Holdier Curriculum Vitae (April 2024).pdf
Holdier Curriculum Vitae (April 2024).pdfHoldier Curriculum Vitae (April 2024).pdf
Holdier Curriculum Vitae (April 2024).pdf
 
Basic Civil Engineering first year Notes- Chapter 4 Building.pptx
Basic Civil Engineering first year Notes- Chapter 4 Building.pptxBasic Civil Engineering first year Notes- Chapter 4 Building.pptx
Basic Civil Engineering first year Notes- Chapter 4 Building.pptx
 
Explore beautiful and ugly buildings. Mathematics helps us create beautiful d...
Explore beautiful and ugly buildings. Mathematics helps us create beautiful d...Explore beautiful and ugly buildings. Mathematics helps us create beautiful d...
Explore beautiful and ugly buildings. Mathematics helps us create beautiful d...
 
Introduction to Nonprofit Accounting: The Basics
Introduction to Nonprofit Accounting: The BasicsIntroduction to Nonprofit Accounting: The Basics
Introduction to Nonprofit Accounting: The Basics
 
PROCESS RECORDING FORMAT.docx
PROCESS      RECORDING        FORMAT.docxPROCESS      RECORDING        FORMAT.docx
PROCESS RECORDING FORMAT.docx
 
Russian Escort Service in Delhi 11k Hotel Foreigner Russian Call Girls in Delhi
Russian Escort Service in Delhi 11k Hotel Foreigner Russian Call Girls in DelhiRussian Escort Service in Delhi 11k Hotel Foreigner Russian Call Girls in Delhi
Russian Escort Service in Delhi 11k Hotel Foreigner Russian Call Girls in Delhi
 
SKILL OF INTRODUCING THE LESSON MICRO SKILLS.pptx
SKILL OF INTRODUCING THE LESSON MICRO SKILLS.pptxSKILL OF INTRODUCING THE LESSON MICRO SKILLS.pptx
SKILL OF INTRODUCING THE LESSON MICRO SKILLS.pptx
 
Spellings Wk 3 English CAPS CARES Please Practise
Spellings Wk 3 English CAPS CARES Please PractiseSpellings Wk 3 English CAPS CARES Please Practise
Spellings Wk 3 English CAPS CARES Please Practise
 
Accessible Digital Futures project (20/03/2024)
Accessible Digital Futures project (20/03/2024)Accessible Digital Futures project (20/03/2024)
Accessible Digital Futures project (20/03/2024)
 
Spatium Project Simulation student brief
Spatium Project Simulation student briefSpatium Project Simulation student brief
Spatium Project Simulation student brief
 
Making communications land - Are they received and understood as intended? we...
Making communications land - Are they received and understood as intended? we...Making communications land - Are they received and understood as intended? we...
Making communications land - Are they received and understood as intended? we...
 
Kodo Millet PPT made by Ghanshyam bairwa college of Agriculture kumher bhara...
Kodo Millet  PPT made by Ghanshyam bairwa college of Agriculture kumher bhara...Kodo Millet  PPT made by Ghanshyam bairwa college of Agriculture kumher bhara...
Kodo Millet PPT made by Ghanshyam bairwa college of Agriculture kumher bhara...
 
SOC 101 Demonstration of Learning Presentation
SOC 101 Demonstration of Learning PresentationSOC 101 Demonstration of Learning Presentation
SOC 101 Demonstration of Learning Presentation
 
General Principles of Intellectual Property: Concepts of Intellectual Proper...
General Principles of Intellectual Property: Concepts of Intellectual  Proper...General Principles of Intellectual Property: Concepts of Intellectual  Proper...
General Principles of Intellectual Property: Concepts of Intellectual Proper...
 
Unit-IV- Pharma. Marketing Channels.pptx
Unit-IV- Pharma. Marketing Channels.pptxUnit-IV- Pharma. Marketing Channels.pptx
Unit-IV- Pharma. Marketing Channels.pptx
 
Magic bus Group work1and 2 (Team 3).pptx
Magic bus Group work1and 2 (Team 3).pptxMagic bus Group work1and 2 (Team 3).pptx
Magic bus Group work1and 2 (Team 3).pptx
 

A large statistics class took an exam. The scores followed a normal .pdf

  • 1. A large statistics class took an exam. The scores followed a normal curve with mean 78 and standard deviation 10. Students who scored 90 or above got an A on the exam. Those who scored between 80 and 90 got a B, between 70 and 80 a C, between 60 and 70 a D, and below 60 an F. a. Estimate the percentage of students who earned an A on the exam. b. Estimate the percentage of students who earned a B on the exam. c. Estimate the percentage of students who earned a C on the exam. d. Estimate the percentage of students who earned a D on the exam. e. Estimate the percentage of students who earned an F on the exam. Please show as much work as you can and don't round. Thank you. Solution http://www.math.umt.edu/elias/NormalDistributionTable.jpg given is the normal distribution table = 78 = 10 1) for students scoring A : we find the area under the curve of standard normal distribution using Z value Z for x=90 : (90-78)/10 = 1.2 (z)=(1.2)=.8849 so the required area is 1-(z)= 1=0.8849= .1151 hence the percentage will be 11.51% 2) for students scoring B : we find the area under the curve of standard normal distribution using Z value Z for x=80 : (80-78)/10 = 0.2 (z)=(0.2)=.5793 % students scoring above B = (1-.5793)*100=42.07% % students scoring B = % students scoring above B -% students scoring A = 42.07-11.51
  • 2. = 30.56% 3) for students scoring C : we find the area under the curve of standard normal distribution using Z value Z for x=70 : (70-78)/10 = -0.8 (z)=(-0.8)=.2119 % students scoring above C = (1-.2119)*100=78.81% % students scoring C = % students scoring above C -% students scoring above B = 78.81-42.07 = 36.74% 4) for students scoring D : we find the area under the curve of standard normal distribution using Z value Z for x=60 : (60-78)/10 = -1.8 (z)=(-1.8)=.0359 % students scoring above D = (1-.0359)*100=96.41% % students scoring D = % students scoring above D -% students scoring above C = 96.41-78.81 = 17.60% 5) for students scoring F : we find the area under the curve of standard normal distribution using Z value Z for x=60 : (60-78)/10 = -1.8 (z)=(-1.8)=.0359 % students scoring F =100- % students scoring above D % students scoring D = % students scoring above D -% students scoring above C = = 100 - 96.41 = 3.59% Verification: Sum of all 5 percentages = 100