SlideShare ist ein Scribd-Unternehmen logo
1 von 9
Revision for Forces and Motion
 What is Distance?
Distance is a measure of how far an object has travelled
from its starting point.
Distance is the same as length and is measured in metres.
 What is the Difference between Distance and
Displacement?
Displacement (like distance above) is also a measure of
how far an object has travelled from its starting point
but displacement also tells you the direction of motion
of the object.
Distance is a scalar and displacement is a vector.
 What is Speed?
Speed is a measure of how fast an object is moving.
It is measured in metres per second, written as (m/s),
or (ms-1).
Speed = Distance ÷ Time.
 What is Velocity?
Velocity is similar to speed.
It is also a measure of how fast an object is moving with
the direction of motion, and is measured in m/s.
Velocity = Distance ÷ Time.
 If an object is not moving then it is called stationary.
The speed or velocity of a stationary object is zero.
 What is the Difference between Velocity and Speed?
The difference between velocity and speed is that
velocity is speed in a certain direction.
Speed is a scalar and velocity is a vector.
 If an object is moving in a straight line, then its speed and
velocity will be the same.
 If the moving object stays at the same speed but changes
direction then we say that the velocity has changed,
(because the direction has changed) but the speed has
stayed the same.
 If the velocity in one direction is positive (for example:
forwards at 4 m/s) then the velocity in the opposite
direction is negative (for example, backwards at -4 m/s).
 How is the Velocity of an Object Calculated?
Either Speed or Velocity = Distance ÷ Time.
For example, if an object moving in a straight line
travels 25 metres in 5 seconds,
then its velocity = 25 ÷ 5 = 5 m/s.
You must always say what the units are!
(in this case m/s, called "metres per second").
Always check what units are given in the question.
If the time is given in hours or minutes, then convert it
to seconds before doing the calculation.
 What is Constant Velocity?
If an object’s velocity does not change, we say that it has
a constant velocity. In the above example, we are not told
whether the object has a constant velocity, or whether
its velocity has changed during the 5 seconds.
If the velocity has changed, then the answer we have
calculated is an average velocity of 5 m/s.
If the velocity has not change then the object had velocity
of 5 m/s.
 What is Acceleration?
A change in velocity is called acceleration.
 What is the Equation for Acceleration?
Acceleration = Change in Velocity ÷ Time.
This equation is written as:
a = (v2-v1) ÷ t
where: a = acceleration
v2 = final velocity (the one it ended up with)
v1 = initial velocity (the one it started with)
t = time
 What are the Units of Acceleration?
The units of acceleration are m/s2
 What is Negative Acceleration?
If an object gets faster, it will have a positive acceleration.
If an object gets slower, it will have a negative acceleration
(this is sometimes called "deceleration").
Example 1. If a car changes from 10 m/s to 30 m/s in 8
seconds,
what is its acceleration?
v2 (or v) = 30, v1 (or u) = 10, t = 8
a = (30 - 10) ÷ 8 = 20 ÷ 8 = 2·5 m/s2
Example 2. If a bicycle moving at 15 m/s takes 10
seconds to stop, what is its acceleration?
In this example,
the final velocity is zero because the bicycle has stopped.
v2 (or v) = 0, v1 (or u) = 15, t = 10
a = (0 - 15) ÷ 10 = -15 ÷ 10 = -1·5 m/s2
The acceleration is negative because the bicycle has
slowed down.
 What is Constant Acceleration?
Acceleration is the rate of change of an objects velocity.
The object is said to have constant acceleration if it gets
faster (or slower, or its direction changes) at the same
rate.
 What is a Distance - Time Graph?
A distance - time graph shows how an object’s distance
changes with time.
1) The figure below shows a distance - time graph
for an object that is stationary (at rest).

This graph shows an object which is not moving
The straight horizontal line shows that its distance
stays the same as time goes by because it is not moving.
2) The figure below shows a distance - time graph
for an object with a constant velocity.







The straight line sloping upwards in the graph shows that
the objects distance increases as time goes by.
The object has velocity because it is moving.
The straight line shows that it is a constant velocity.
The gradient (the slope) of the line shows how fast the
object is going.
The greater the slope, the bigger the velocity is.

 What is the Distance - Time Graph for Acceleration?




The curve in the above graph shows that the objects
velocity is changing as time goes by.
Changing velocity is called acceleration.
How can a Distance - Time Graph be used to show
the Motion of an Object?
Ex. In the graph below, describe the motion of the object.




In region A the object is moving with constant velocity.
In region B the object is at rest (not moving).
In region C the object is moving with a constant velocity
but when compared with region velocity in A:
1. the object is moving more slowly (slope is less steep)
2. the object is moving in the opposite direction because
distance is decreasing as time goes by.

 What is a Velocity - Time Graph?
A velocity - time graph shows how an object’s velocity
changes with time.
1) Velocity - time graphs for constant velocity :

The straight horizontal line in the graph above shows
that the objects velocity does not change as time goes by.
2) Velocity - time graph for an object with a velocity that
increases at a constant rate:







The straight line sloping upwards in the graph above
shows that the objects velocity is increasing with time.
Increasing velocity is called acceleration.
The straight line in the graph above shows that the
velocity of the object has a constant acceleration
(velocity of the object is changing at a constant rate).
The slope of the line in the graph above shows:
a) the acceleration is positive because the line slopes
upwards.
b) how fast the acceleration is: the greater the slope ,
the faster the acceleration is.

3) Velocity - Time graphs for constant negative acceleration:






The straight line sloping downwards in the graph above
shows that the objects velocity is decreasing with time.
This is called negative acceleration.
The straight line shows that it is constant acceleration.
The slope of the line shows
1. the acceleration is negative because the line slopes
downwards.
2. how fast the negative acceleration is: the greater the
slope, the faster the acceleration is.
4) The picture below shows a velocity - time graph for an
object with an acceleration that increases.




The curve in the above graph shows that the acceleration
is not constant because the slope is getting steeper.
It is changing acceleration that increases as time goes by.

 How can a Velocity - Time Graph be used to show the
Motion of an Object?
Ex. In the graph below describe the motion of the object.




In region A the object is moving with constantacceleration.
In region B the object is moving with constant velocity.
In region C the object is again moving with constant
acceleration, but when compared with region A:
1. the acceleration is slower because the slope is lesssteep
2. the acceleration is negative because
the slope is downwards.
 The total distance travelled by the object can be calculated
by measuring the area under the graph.



This area can be divided into two triangles and one
rectangle.
The area of triangle A = ½ base x height
= 0·5 x 10 x 20 = 100.
The area of triangle C= ½ x (70 - 30) x 20 = 400.
The area of rectangle B = (30 - 10) x 20 = 400.
The distance travelled is the total area = A + B + C
= 100 + 400 + 400 = 900 m.

Amal Sweis & Amre Al Maghawish

Weitere ähnliche Inhalte

Was ist angesagt?

Was ist angesagt? (20)

AP Physics - Chapter 2 Powerpoint
AP Physics - Chapter 2 PowerpointAP Physics - Chapter 2 Powerpoint
AP Physics - Chapter 2 Powerpoint
 
Displacement, velocity, acceleration
Displacement, velocity, accelerationDisplacement, velocity, acceleration
Displacement, velocity, acceleration
 
Speed,velocity,acceleration
Speed,velocity,accelerationSpeed,velocity,acceleration
Speed,velocity,acceleration
 
Motion, Velocity, and Acceleration - Book M, Chap. 1.1
Motion, Velocity, and Acceleration - Book M, Chap. 1.1Motion, Velocity, and Acceleration - Book M, Chap. 1.1
Motion, Velocity, and Acceleration - Book M, Chap. 1.1
 
Kinematics
KinematicsKinematics
Kinematics
 
Motion in a plane
Motion in a planeMotion in a plane
Motion in a plane
 
Physics F3 (IGCSE) speed, velocity and acceleration
Physics F3 (IGCSE)   speed, velocity and acceleration Physics F3 (IGCSE)   speed, velocity and acceleration
Physics F3 (IGCSE) speed, velocity and acceleration
 
Motion - Vektor
Motion - VektorMotion - Vektor
Motion - Vektor
 
Units and measurement
Units and measurementUnits and measurement
Units and measurement
 
2.1 motion 2015
2.1 motion 20152.1 motion 2015
2.1 motion 2015
 
Kinematics - The Study of Motion
Kinematics - The Study of MotionKinematics - The Study of Motion
Kinematics - The Study of Motion
 
Motion L1
Motion L1Motion L1
Motion L1
 
Year 10 distance time graph lesson
Year 10 distance time graph lessonYear 10 distance time graph lesson
Year 10 distance time graph lesson
 
2.1 Kinematics
2.1 Kinematics 2.1 Kinematics
2.1 Kinematics
 
Motion
MotionMotion
Motion
 
Velocity Graphs
Velocity GraphsVelocity Graphs
Velocity Graphs
 
Speed, Velocity and Acceleration
Speed, Velocity and AccelerationSpeed, Velocity and Acceleration
Speed, Velocity and Acceleration
 
Short Notes of First year Physics
Short Notes of First year Physics Short Notes of First year Physics
Short Notes of First year Physics
 
Physics .
Physics .Physics .
Physics .
 
MOTION FOR CLASS 9
MOTION FOR CLASS 9MOTION FOR CLASS 9
MOTION FOR CLASS 9
 

Ähnlich wie Revision: Describing Motion

Motion - Distance time graphs and speed time graphs.pptx
Motion - Distance time graphs and speed time graphs.pptxMotion - Distance time graphs and speed time graphs.pptx
Motion - Distance time graphs and speed time graphs.pptx
MehjabeenShaik1
 
Important Helpful Physics Notes/Formula--Must See
Important Helpful Physics Notes/Formula--Must SeeImportant Helpful Physics Notes/Formula--Must See
Important Helpful Physics Notes/Formula--Must See
anicholls1234
 
Motion Notes PPT STUDENT KEY.pdf
Motion Notes PPT STUDENT KEY.pdfMotion Notes PPT STUDENT KEY.pdf
Motion Notes PPT STUDENT KEY.pdf
angelicasibul1
 
position-time graph.pptx
position-time graph.pptxposition-time graph.pptx
position-time graph.pptx
YaySandoval1
 

Ähnlich wie Revision: Describing Motion (20)

Motion - Distance time graphs and speed time graphs.pptx
Motion - Distance time graphs and speed time graphs.pptxMotion - Distance time graphs and speed time graphs.pptx
Motion - Distance time graphs and speed time graphs.pptx
 
Important Helpful Physics Notes/Formula--Must See
Important Helpful Physics Notes/Formula--Must SeeImportant Helpful Physics Notes/Formula--Must See
Important Helpful Physics Notes/Formula--Must See
 
acceleration.ppt
acceleration.pptacceleration.ppt
acceleration.ppt
 
Sec.1 describing and measuring_motion
Sec.1 describing and measuring_motionSec.1 describing and measuring_motion
Sec.1 describing and measuring_motion
 
motion, distance displacement speed and velocity
motion, distance displacement speed and velocitymotion, distance displacement speed and velocity
motion, distance displacement speed and velocity
 
Kinematics in One-dimension.ppt
Kinematics in One-dimension.pptKinematics in One-dimension.ppt
Kinematics in One-dimension.ppt
 
MOTION
MOTIONMOTION
MOTION
 
MOTION.pptx
MOTION.pptxMOTION.pptx
MOTION.pptx
 
graphing motion.ppt
graphing motion.pptgraphing motion.ppt
graphing motion.ppt
 
CH-3Motion in a St Line.pdf
CH-3Motion in a St Line.pdfCH-3Motion in a St Line.pdf
CH-3Motion in a St Line.pdf
 
Ch 1-2 review ppt
Ch 1-2 review pptCh 1-2 review ppt
Ch 1-2 review ppt
 
Motion Notes PPT STUDENT KEY.pdf
Motion Notes PPT STUDENT KEY.pdfMotion Notes PPT STUDENT KEY.pdf
Motion Notes PPT STUDENT KEY.pdf
 
Graphing motion
Graphing motionGraphing motion
Graphing motion
 
motion graphs distance time graphs .pptx
motion graphs distance time graphs .pptxmotion graphs distance time graphs .pptx
motion graphs distance time graphs .pptx
 
Chapter 2 Motion in a straight line
Chapter 2 Motion in a straight lineChapter 2 Motion in a straight line
Chapter 2 Motion in a straight line
 
Motion class 9
Motion class 9Motion class 9
Motion class 9
 
position-time graph.pptx
position-time graph.pptxposition-time graph.pptx
position-time graph.pptx
 
Acceleration
AccelerationAcceleration
Acceleration
 
NCERT class 9th science chapter 8
NCERT class 9th science chapter 8NCERT class 9th science chapter 8
NCERT class 9th science chapter 8
 
Motion 1
Motion 1Motion 1
Motion 1
 

Mehr von Physics Amal Sweis

Is the universe infinite or does it simply [autosaved]
Is the universe infinite or does it simply [autosaved]Is the universe infinite or does it simply [autosaved]
Is the universe infinite or does it simply [autosaved]
Physics Amal Sweis
 

Mehr von Physics Amal Sweis (20)

E.m.waves
E.m.wavesE.m.waves
E.m.waves
 
Chapter 9
Chapter 9Chapter 9
Chapter 9
 
Interesting inventions and facts
Interesting inventions and factsInteresting inventions and facts
Interesting inventions and facts
 
Is the universe infinite or does it simply expand !
Is the universe infinite or does it simply expand !Is the universe infinite or does it simply expand !
Is the universe infinite or does it simply expand !
 
Is the universe infinite or does it simply [autosaved]
Is the universe infinite or does it simply [autosaved]Is the universe infinite or does it simply [autosaved]
Is the universe infinite or does it simply [autosaved]
 
Interesting inventions and facts
Interesting inventions and factsInteresting inventions and facts
Interesting inventions and facts
 
Energy physics
Energy physicsEnergy physics
Energy physics
 
Rotational balance
Rotational balanceRotational balance
Rotational balance
 
Physics.pptxy.pptxfullversion
Physics.pptxy.pptxfullversionPhysics.pptxy.pptxfullversion
Physics.pptxy.pptxfullversion
 
Force and motion
Force and motionForce and motion
Force and motion
 
Chapter 2: Describing motion
Chapter 2: Describing motionChapter 2: Describing motion
Chapter 2: Describing motion
 
Chapter2
Chapter2Chapter2
Chapter2
 
Chapter2 p1
Chapter2 p1Chapter2 p1
Chapter2 p1
 
Chapter2 p1
Chapter2 p1Chapter2 p1
Chapter2 p1
 
Si Units
Si UnitsSi Units
Si Units
 
Measuring, physics for 9th grade 2014
Measuring, physics for 9th grade 2014Measuring, physics for 9th grade 2014
Measuring, physics for 9th grade 2014
 
Capter 10
Capter 10Capter 10
Capter 10
 
Chapter 11
Chapter 11Chapter 11
Chapter 11
 
Chapter 11
Chapter 11Chapter 11
Chapter 11
 
Capter 10
Capter 10Capter 10
Capter 10
 

Kürzlich hochgeladen

Kürzlich hochgeladen (20)

2024: Domino Containers - The Next Step. News from the Domino Container commu...
2024: Domino Containers - The Next Step. News from the Domino Container commu...2024: Domino Containers - The Next Step. News from the Domino Container commu...
2024: Domino Containers - The Next Step. News from the Domino Container commu...
 
Driving Behavioral Change for Information Management through Data-Driven Gree...
Driving Behavioral Change for Information Management through Data-Driven Gree...Driving Behavioral Change for Information Management through Data-Driven Gree...
Driving Behavioral Change for Information Management through Data-Driven Gree...
 
Strategies for Unlocking Knowledge Management in Microsoft 365 in the Copilot...
Strategies for Unlocking Knowledge Management in Microsoft 365 in the Copilot...Strategies for Unlocking Knowledge Management in Microsoft 365 in the Copilot...
Strategies for Unlocking Knowledge Management in Microsoft 365 in the Copilot...
 
Boost Fertility New Invention Ups Success Rates.pdf
Boost Fertility New Invention Ups Success Rates.pdfBoost Fertility New Invention Ups Success Rates.pdf
Boost Fertility New Invention Ups Success Rates.pdf
 
Exploring the Future Potential of AI-Enabled Smartphone Processors
Exploring the Future Potential of AI-Enabled Smartphone ProcessorsExploring the Future Potential of AI-Enabled Smartphone Processors
Exploring the Future Potential of AI-Enabled Smartphone Processors
 
GenAI Risks & Security Meetup 01052024.pdf
GenAI Risks & Security Meetup 01052024.pdfGenAI Risks & Security Meetup 01052024.pdf
GenAI Risks & Security Meetup 01052024.pdf
 
Automating Google Workspace (GWS) & more with Apps Script
Automating Google Workspace (GWS) & more with Apps ScriptAutomating Google Workspace (GWS) & more with Apps Script
Automating Google Workspace (GWS) & more with Apps Script
 
Partners Life - Insurer Innovation Award 2024
Partners Life - Insurer Innovation Award 2024Partners Life - Insurer Innovation Award 2024
Partners Life - Insurer Innovation Award 2024
 
08448380779 Call Girls In Greater Kailash - I Women Seeking Men
08448380779 Call Girls In Greater Kailash - I Women Seeking Men08448380779 Call Girls In Greater Kailash - I Women Seeking Men
08448380779 Call Girls In Greater Kailash - I Women Seeking Men
 
GenCyber Cyber Security Day Presentation
GenCyber Cyber Security Day PresentationGenCyber Cyber Security Day Presentation
GenCyber Cyber Security Day Presentation
 
Scaling API-first – The story of a global engineering organization
Scaling API-first – The story of a global engineering organizationScaling API-first – The story of a global engineering organization
Scaling API-first – The story of a global engineering organization
 
Handwritten Text Recognition for manuscripts and early printed texts
Handwritten Text Recognition for manuscripts and early printed textsHandwritten Text Recognition for manuscripts and early printed texts
Handwritten Text Recognition for manuscripts and early printed texts
 
Tech Trends Report 2024 Future Today Institute.pdf
Tech Trends Report 2024 Future Today Institute.pdfTech Trends Report 2024 Future Today Institute.pdf
Tech Trends Report 2024 Future Today Institute.pdf
 
🐬 The future of MySQL is Postgres 🐘
🐬  The future of MySQL is Postgres   🐘🐬  The future of MySQL is Postgres   🐘
🐬 The future of MySQL is Postgres 🐘
 
ProductAnonymous-April2024-WinProductDiscovery-MelissaKlemke
ProductAnonymous-April2024-WinProductDiscovery-MelissaKlemkeProductAnonymous-April2024-WinProductDiscovery-MelissaKlemke
ProductAnonymous-April2024-WinProductDiscovery-MelissaKlemke
 
A Domino Admins Adventures (Engage 2024)
A Domino Admins Adventures (Engage 2024)A Domino Admins Adventures (Engage 2024)
A Domino Admins Adventures (Engage 2024)
 
Raspberry Pi 5: Challenges and Solutions in Bringing up an OpenGL/Vulkan Driv...
Raspberry Pi 5: Challenges and Solutions in Bringing up an OpenGL/Vulkan Driv...Raspberry Pi 5: Challenges and Solutions in Bringing up an OpenGL/Vulkan Driv...
Raspberry Pi 5: Challenges and Solutions in Bringing up an OpenGL/Vulkan Driv...
 
Strategies for Landing an Oracle DBA Job as a Fresher
Strategies for Landing an Oracle DBA Job as a FresherStrategies for Landing an Oracle DBA Job as a Fresher
Strategies for Landing an Oracle DBA Job as a Fresher
 
08448380779 Call Girls In Friends Colony Women Seeking Men
08448380779 Call Girls In Friends Colony Women Seeking Men08448380779 Call Girls In Friends Colony Women Seeking Men
08448380779 Call Girls In Friends Colony Women Seeking Men
 
Boost PC performance: How more available memory can improve productivity
Boost PC performance: How more available memory can improve productivityBoost PC performance: How more available memory can improve productivity
Boost PC performance: How more available memory can improve productivity
 

Revision: Describing Motion

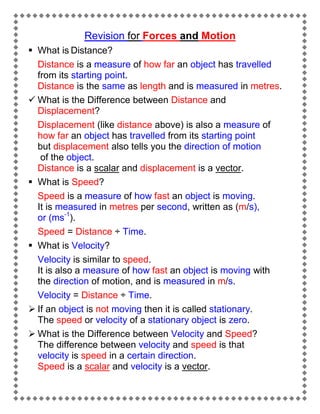
  • 1. Revision for Forces and Motion  What is Distance? Distance is a measure of how far an object has travelled from its starting point. Distance is the same as length and is measured in metres.  What is the Difference between Distance and Displacement? Displacement (like distance above) is also a measure of how far an object has travelled from its starting point but displacement also tells you the direction of motion of the object. Distance is a scalar and displacement is a vector.  What is Speed? Speed is a measure of how fast an object is moving. It is measured in metres per second, written as (m/s), or (ms-1). Speed = Distance ÷ Time.  What is Velocity? Velocity is similar to speed. It is also a measure of how fast an object is moving with the direction of motion, and is measured in m/s. Velocity = Distance ÷ Time.  If an object is not moving then it is called stationary. The speed or velocity of a stationary object is zero.  What is the Difference between Velocity and Speed? The difference between velocity and speed is that velocity is speed in a certain direction. Speed is a scalar and velocity is a vector.
  • 2.  If an object is moving in a straight line, then its speed and velocity will be the same.  If the moving object stays at the same speed but changes direction then we say that the velocity has changed, (because the direction has changed) but the speed has stayed the same.  If the velocity in one direction is positive (for example: forwards at 4 m/s) then the velocity in the opposite direction is negative (for example, backwards at -4 m/s).  How is the Velocity of an Object Calculated? Either Speed or Velocity = Distance ÷ Time. For example, if an object moving in a straight line travels 25 metres in 5 seconds, then its velocity = 25 ÷ 5 = 5 m/s. You must always say what the units are! (in this case m/s, called "metres per second"). Always check what units are given in the question. If the time is given in hours or minutes, then convert it to seconds before doing the calculation.  What is Constant Velocity? If an object’s velocity does not change, we say that it has a constant velocity. In the above example, we are not told whether the object has a constant velocity, or whether its velocity has changed during the 5 seconds. If the velocity has changed, then the answer we have calculated is an average velocity of 5 m/s. If the velocity has not change then the object had velocity of 5 m/s.  What is Acceleration? A change in velocity is called acceleration.
  • 3.  What is the Equation for Acceleration? Acceleration = Change in Velocity ÷ Time. This equation is written as: a = (v2-v1) ÷ t where: a = acceleration v2 = final velocity (the one it ended up with) v1 = initial velocity (the one it started with) t = time  What are the Units of Acceleration? The units of acceleration are m/s2  What is Negative Acceleration? If an object gets faster, it will have a positive acceleration. If an object gets slower, it will have a negative acceleration (this is sometimes called "deceleration"). Example 1. If a car changes from 10 m/s to 30 m/s in 8 seconds, what is its acceleration? v2 (or v) = 30, v1 (or u) = 10, t = 8 a = (30 - 10) ÷ 8 = 20 ÷ 8 = 2·5 m/s2 Example 2. If a bicycle moving at 15 m/s takes 10 seconds to stop, what is its acceleration? In this example, the final velocity is zero because the bicycle has stopped. v2 (or v) = 0, v1 (or u) = 15, t = 10 a = (0 - 15) ÷ 10 = -15 ÷ 10 = -1·5 m/s2 The acceleration is negative because the bicycle has slowed down.
  • 4.  What is Constant Acceleration? Acceleration is the rate of change of an objects velocity. The object is said to have constant acceleration if it gets faster (or slower, or its direction changes) at the same rate.  What is a Distance - Time Graph? A distance - time graph shows how an object’s distance changes with time. 1) The figure below shows a distance - time graph for an object that is stationary (at rest). This graph shows an object which is not moving The straight horizontal line shows that its distance stays the same as time goes by because it is not moving. 2) The figure below shows a distance - time graph for an object with a constant velocity. 
  • 5.      The straight line sloping upwards in the graph shows that the objects distance increases as time goes by. The object has velocity because it is moving. The straight line shows that it is a constant velocity. The gradient (the slope) of the line shows how fast the object is going. The greater the slope, the bigger the velocity is.  What is the Distance - Time Graph for Acceleration?   The curve in the above graph shows that the objects velocity is changing as time goes by. Changing velocity is called acceleration. How can a Distance - Time Graph be used to show the Motion of an Object? Ex. In the graph below, describe the motion of the object.
  • 6.    In region A the object is moving with constant velocity. In region B the object is at rest (not moving). In region C the object is moving with a constant velocity but when compared with region velocity in A: 1. the object is moving more slowly (slope is less steep) 2. the object is moving in the opposite direction because distance is decreasing as time goes by.  What is a Velocity - Time Graph? A velocity - time graph shows how an object’s velocity changes with time. 1) Velocity - time graphs for constant velocity : The straight horizontal line in the graph above shows that the objects velocity does not change as time goes by. 2) Velocity - time graph for an object with a velocity that increases at a constant rate: 
  • 7.     The straight line sloping upwards in the graph above shows that the objects velocity is increasing with time. Increasing velocity is called acceleration. The straight line in the graph above shows that the velocity of the object has a constant acceleration (velocity of the object is changing at a constant rate). The slope of the line in the graph above shows: a) the acceleration is positive because the line slopes upwards. b) how fast the acceleration is: the greater the slope , the faster the acceleration is. 3) Velocity - Time graphs for constant negative acceleration:     The straight line sloping downwards in the graph above shows that the objects velocity is decreasing with time. This is called negative acceleration. The straight line shows that it is constant acceleration. The slope of the line shows 1. the acceleration is negative because the line slopes downwards. 2. how fast the negative acceleration is: the greater the slope, the faster the acceleration is.
  • 8. 4) The picture below shows a velocity - time graph for an object with an acceleration that increases.   The curve in the above graph shows that the acceleration is not constant because the slope is getting steeper. It is changing acceleration that increases as time goes by.  How can a Velocity - Time Graph be used to show the Motion of an Object? Ex. In the graph below describe the motion of the object.   In region A the object is moving with constantacceleration. In region B the object is moving with constant velocity.
  • 9. In region C the object is again moving with constant acceleration, but when compared with region A: 1. the acceleration is slower because the slope is lesssteep 2. the acceleration is negative because the slope is downwards.  The total distance travelled by the object can be calculated by measuring the area under the graph.  This area can be divided into two triangles and one rectangle. The area of triangle A = ½ base x height = 0·5 x 10 x 20 = 100. The area of triangle C= ½ x (70 - 30) x 20 = 400. The area of rectangle B = (30 - 10) x 20 = 400. The distance travelled is the total area = A + B + C = 100 + 400 + 400 = 900 m. Amal Sweis & Amre Al Maghawish