Weitere ähnliche Inhalte
Ähnlich wie 1d motion worksheet_packet (20)
Kürzlich hochgeladen (20)
1d motion worksheet_packet
- 1. Motion in One Dimension Name:
© The Physics Classroom, 2009 Page 1
Describing Motion Verbally with Distance and Displacement
Read from Lesson 1 of the 1-D Kinematics chapter at The Physics Classroom:
http://www.physicsclassroom.com/Class/1DKin/U1L1a.html
http://www.physicsclassroom.com/Class/1DKin/U1L1b.html
http://www.physicsclassroom.com/Class/1DKin/U1L1c.html
MOP Connection: Kinematic Concepts: sublevels 1 and 2
Motion can be described using words, diagrams, numerical information, equations, and graphs. Using
words to describe the motion of objects involves an understanding of such concepts as position,
displacement, distance, rate, speed, velocity, and acceleration.
Vectors vs. Scalars
1. Most of the quantities used to describe motion can be categorized as either vectors or scalars. A
vector is a quantity which is fully described by both magnitude and direction. A scalar is a quantity which is
fully described by magnitude alone. Categorize the following quantities by placing them under one of
the two column headings.
displacement, distance, speed, velocity, acceleration
Scalars Vectors
2. A quantity which is ignorant of direction is referred to as a _________________.
a. scalar quantity b. vector quantity
3. A quantity which is conscious of direction is referred to as a _________________.
a. scalar quantity b. vector quantity
Distance vs. Displacement
As an object moves, its location undergoes change. There are a two quantities which are used to describe
the changing location. One quantity - distance - accumulates the amount of total change of location over
the course of a motion. Distance is the amount of ground which is covered. The second quantity -
displacement - only concerns itself with the initial and final position of the object. Displacement is the
overall change in position of the object from start to finish and does not concern itself with the
accumulation of distance traveled during the path from start to finish.
4. True or False: An object can be moving for 10 seconds and still have zero displacement.
a. True b. False
5. If the above statement is true, then describe an example of such a motion. If the above statement is
false, then explain why it is false.
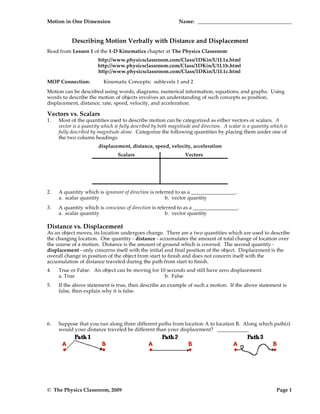
6. Suppose that you run along three different paths from location A to location B. Along which path(s)
would your distance traveled be different than your displacement? ____________
- 2. Motion in One Dimension
© The Physics Classroom, 2009 Page 2
7. You run from your house to a friend's house that is 3 miles away. You then walk home.
a. What distance did you travel? ______________
b. What was the displacement for the entire trip? _______________
Observe the diagram below. A person starts at A, walks along the bold path and finishes at B. Each
square is 1 km along its edge. Use the diagram in answering the next two
questions.
8. This person walks a distance of ________ km.
9. This person has a displacement of ________ km.
a. 0 km b. 3 km c. 3 km, E d. 3 km, W
e. 5 km f. 5 km, N g. 5 km, S h. 6 km
i. 6 km, E j. 6 km, W k. 31 km l. 31 km, E
m. 31 km, W n. None of these.
10. A cross-country skier moves from location A to location B to location C to location D. Each leg of the
back-and-forth motion takes 1 minute to complete; the total time is 3 minutes.
a. What is the distance traveled by the skier during the three minutes of recreation?
b. What is the net displacement of the skier during the three minutes of recreation?
c. What is the displacement during the second minute (from 1 min. to 2 min.)?
d. What is the displacement during the third minute (from 2 min. to 3 min.)?
- 3. Motion in One Dimension Name:
© The Physics Classroom, 2009 Page 3
Describing Motion Verbally with Speed and Velocity
Read from Lesson 1 of the 1-D Kinematics chapter at The Physics Classroom:
http://www.physicsclassroom.com/Class/1DKin/U1L1d.html
MOP Connection: Kinematic Concepts: sublevels 3 and 6
Review:
1. A _________ quantity is completely described by magnitude alone. A _________ quantity is
completely described by a magnitude with a direction.
a. scalar, vector b. vector, scalar
2. Speed is a __________ quantity and velocity is a __________ quantity.
a. scalar, vector b. vector, scalar
Speed vs. Velocity
Speed and velocity are two quantities in Physics which seem at first glance to have the same meaning.
While related, they have distinctly different definitions. Knowing their definitions is critical to
understanding the difference between them.
Speed is a quantity which describes how fast or how slow an object is moving.
Velocity is a quantity which is defined as the rate at which an object's position changes.
3. Suppose you are considering three different paths (A, B and C) between the same two locations.
Along which path would you have to move with the greatest speed to arrive at the destination in the
same amount of time? ____________ Explain.
4. True or False: It is possible for an object to move for 10 seconds at a high speed and end up with no
overall change in position.
a. True b. False
5. If the above statement is true, then describe an example of such a motion. If the above statement is
false, then explain why it is false.
6. Suppose that you run for 10 seconds along three different paths.
Rank the three paths from the lowest speed to the greatest speed. __________
Rank the three paths from the lowest velocity to the greatest velocity . __________
- 4. Motion in One Dimension
© The Physics Classroom, 2009 Page 4
Calculating Average Speed and Average Velocity
The average speed of an object is the rate at which an object covers distance. The average velocity of
an object is the rate at which an object changes its position. Thus,
Ave. Speed =
distance
time Ave. Velocity =
displacement
time
Speed, being a scalar, is dependent upon the scalar quantity distance. Velocity, being a vector, is
dependent upon the vector quantity displacement.
7. You run from your house to a friend's house that is 3 miles away in 30 minutes. You then
immediately walk home, taking 1 hour on your return trip.
a. What was the average speed (in mi/hr) for the entire trip? _______________
b. What was the average velocity (in mi/hr) for the entire trip? _______________
8. A cross-country skier moves from location A to location B to location C to location D. Each leg of the
back-and-forth motion takes 1 minute to complete; the total time is 3 minutes.
Calculate the average speed (in m/min) and the average velocity (in m/min) of the skier during the
three minutes of recreation. PSYW
Ave. Speed = Ave. Velocity =
- 5. Motion in One Dimension Name:
© The Physics Classroom, 2009 Page 5
Instantaneous Speed vs. Average Speed
The instantaneous speed of an object is the speed which an object has at any given instant. When an
object moves, it doesn't always move at a steady pace. As a result, the instantaneous speed is changing.
For an automobile, the instantaneous speed is the speedometer reading. The average speed is simply the
average of all the speedometer readings taken at regular intervals of time. Of course, the easier way to
determine the average speed is to simply do a distance/time ratio.
9. Consider the data at the right for the first 10 minutes of a
teacher's trip along the expressway to school. Determine ...
a. ... the average speed (in mi/min) for the 10 minutes of
motion.
b. ... an estimate of the maximum speed (in mi/min) based on
the given data.
Time (min)
0
1
2
3
4
5
6
7
8
9
10
Pos'n (mi)
0
0.4
0.8
1.3
2.1
2.5
2.7
3.8
5.0
6.4
7.6
10. The graph below shows Donovan Bailey's split times for his 100-meter record breaking
run in the Atlanta Olympics in 1996.
a. At what point did he experience his greatest average speed for a 10 meter interval?
Calculate this speed in m/s. PSYW
b. What was his average speed (in m/s) for the overall race? PSYW
- 6. Motion in One Dimension
© The Physics Classroom, 2009 Page 6
Problem-Solving:
11. Thirty years ago, police would check a highway for speeders by sending a helicopter up in the air
and observing the time it would take for a car to travel between two wide lines placed 1/10th of a
mile apart. On one occasion, a car was observed to take 7.2 seconds to travel this distance.
a. How much time did it take the car to travel the distance in hours?
b. What is the speed of the car in miles per hour?
12. The fastest trains are magnetically levitated above the rails to avoid friction (and are therefore called
MagLev trains…cool, huh?). The fastest trains travel about 155 miles in a half an hour. What is their
average speed in miles/hour?
13. In 1960, U.S. Air Force Captain Joseph Kittinger broke the records for the both the fastest and the
longest sky dive…he fell an amazing 19.5 miles! (Cool facts: There is almost no air at that altitude,
and he said that he almost didn’t feel like he was falling because there was no whistling from the
wind or movement of his clothing through the air. The temperature at that altitude was 36 degrees
Fahrenheit below zero!) His average speed while falling was 254 miles/hour. How much time did
the dive last?
14. A hummingbird averages a speed of about 28 miles/hour (Cool facts: They visit up to 1000 flowers
per day, and reach maximum speed while diving … up to 100 miles/hour!). Ruby-throated
hummingbirds take a 2000 mile journey when they migrate, including a non-stop trip across Gulf of
Mexico in which they fly for 18 hours straight! How far is the trip across the Gulf of Mexico?
- 7. Motion in One Dimension Name:
© The Physics Classroom, 2009 Page 7
Acceleration
Read from Lesson 1 of the 1-D Kinematics chapter at The Physics Classroom:
http://www.physicsclassroom.com/Class/1DKin/U1L1e.html
MOP Connection: Kinematic Concepts: sublevels 4 and 7
Review:
The instantaneous velocity of an object is the _____________ of the object with a _____________.
The Concept of Acceleration
1. Accelerating objects are objects which are changing their velocity. Name the three controls on an
automobile which cause it to accelerate.
2. An object is accelerating if it is moving _____. Circle all that apply.
a. with changing speed b. extremely fast c. with constant velocity
d. in a circle e. downward f. none of these
3. If an object is NOT accelerating, then one knows for sure that it is ______.
a. at rest b. moving with a constant speed
c. slowing down d. maintaining a constant velocity
Acceleration as a Rate Quantity
Acceleration is the rate at which an object's velocity changes. The velocity of an object refers to how fast it
moves and in what direction. The acceleration of an object refers to how fast an object changes its speed
or its direction. Objects with a high acceleration are rapidly changing their speed or their direction. As a
rate quantity, acceleration is expressed by the equation:
acceleration =
Δ Velocity
time =
vfinal - voriginal
time
4. An object with an acceleration of 10 m/s2 will ____. Circle all that apply.
a. move 10 meters in 1 second b. change its velocity by 10 m/s in 1 s
c. move 100 meters in 10 seconds d. have a velocity of 100 m/s after 10 s
5. Ima Speedin puts the pedal to the metal and increases her speed as follows: 0 mi/hr at 0
seconds; 10 mi/hr at 1 second; 20 mi/hr at 2 seconds; 30 mi/hr at 3 seconds; and 40
mi/hr at 4 seconds. What is the acceleration of Ima's car?
6. Mr. Henderson's (imaginary) Porsche accelerates from 0 to 60 mi/hr in 4 seconds. Its
acceleration is _____ .
a. 60 mi/hr b. 15 m/s/s c. 15 mi/hr/s d. -15 mi/hr/s e. none of these
7. A car speeds up from rest to +16 m/s in 4 s. Calculate the acceleration.
8. A car slows down from +32 m/s to +8 m/s in 4 s. Calculate the acceleration.
- 8. Motion in One Dimension
© The Physics Classroom, 2009 Page 8
Acceleration as a Vector Quantity
Acceleration, like velocity, is a vector quantity. To fully describe the acceleration of an object, one must
describe the direction of the acceleration vector. A general rule of thumb is that if an object is moving in
a straight line and slowing down, then the direction of the acceleration is opposite the direction the object
is moving. If the object is speeding up, the acceleration direction is the same as the direction of motion.
9. Read the following statements and indicate the direction (up, down, east, west, north or south) of the
acceleration vector.
Description of Motion
Dir'n of
Acceleration
a. A car is moving eastward along Lake Avenue and increasing its speed
from 25 mph to 45 mph.
b. A northbound car skids to a stop to avoid a reckless driver.
c. An Olympic diver slows down after splashing into the water.
d. A southward-bound free quick delivered by the opposing team is
slowed down and stopped by the goalie.
e. A downward falling parachutists pulls the chord and rapidly slows
down.
f. A rightward-moving Hot Wheels car slows to a stop.
g. A falling bungee-jumper slows down as she nears the concrete
sidewalk below.
10. The diagram at the right portrays a Hot Wheels track
designed for a phun physics lab. The car starts at
point A, descends the hill (continually speeding up
from A to B); after a short straight section of track, the
car rounds the curve and finishes its run at point C.
The car continuously slows down from point B to
point C. Use this information to complete the
following table.
Point Direction of Velocity of Vector Direction of Acceleration Vector
X
Reason: Reason:
Y
Reason: Reason:
Z
Reason: Reason:
- 9. Motion in One Dimension Name:
© The Physics Classroom, 2009 Page 9
Describing Motion with Diagrams
Read from Lesson 2 of the 1-D Kinematics chapter at The Physics Classroom:
http://www.physicsclassroom.com/Class/1DKin/U1L2a.html
http://www.physicsclassroom.com/Class/1DKin/U1L2b.html
http://www.physicsclassroom.com/Class/1DKin/U1L2c.html
MOP Connection: Kinematic Concepts: sublevel 5
Motion can be described using words, diagrams, numerical information, equations, and graphs. Using
diagrams to describe the motion of objects involves depicting the location or position of an object at
regular time intervals.
1. Motion diagrams for an amusement park ride are shown. The diagrams indicate the positions of the
car at regular time intervals. For each of these diagrams, indicate whether the car is accelerating or
moving with constant velocity. If accelerating, indicate the direction (right or left) of acceleration.
Support your answer with reasoning.
Acceleration:
Y/N Dir'n
a.
Reason:
b.
Reason:
c.
Reason:
d.
Reason:
e.
Reason:
2. Suppose that in diagram D (above) the cars were moving leftward (and traveling backwards). What
would be the direction of the acceleration? _______________ Explain your answer fully.
- 10. Motion in One Dimension
© The Physics Classroom, 2009 Page 10
3. Based on the oil drop pattern for Car A and Car B,
which of the following statements are true? Circle all
that apply.
a. Both cars have a constant velocity.
b. Both cars have an accelerated motion.
c. Car A is accelerating; Car B is not.
d. Car B is accelerating; Car A is not.
e. Car A has a greater acceleration than Car B.
f. Car B has a greater acceleration than Car A.
4. An object is moving from right to left. It's motion is
represented by the oil drop diagram below. This
object has a _______ velocity and a _______
acceleration.
a. rightward, rightward b. rightward, leftward
c. leftward, rightward d. leftward, leftward
e. rightward, zero f. leftward, zero
5. Renatta Oyle's car has an oil leak and leaves a trace of oil drops on the streets as she drives through
Glenview. A study of Glenview's streets reveals the following traces. Match the trace with the
verbal descriptions given below. For each match, verify your reasoning.
Diagram A:
Diagram B:
Diagram C:
Verbal Description Diagram
i. Renatta was driving with a slow constant speed, decelerated to rest, remained at
rest for 30 s, and then drove very slowly at a constant speed.
Reasoning:
ii. Renatta rapidly decelerated from a high speed to a rest position, and then slowly
accelerated to a moderate speed.
Reasoning:
iii. Renatta was driving at a moderate speed and slowly accelerated.
Reasoning:
- 11. Motion in One Dimension Name:
© The Physics Classroom, 2009 Page 11
Describing Motion Numerically
Read from Lesson 1 of the 1-D Kinematics chapter at The Physics Classroom:
http://www.physicsclassroom.com/Class/1DKin/U1L1d.html
http://www.physicsclassroom.com/Class/1DKin/U1L1e.html
MOP Connection: Kinematic Concepts: sublevel 8
Motion can be described using words, diagrams, numerical information, equations, and graphs.
Describing motion with numbers can involve a variety of skills. On this page, we will focus on the use
tabular data to describe the motion of objects.
1. Position-time information for a giant sea turtle, a cheetah, and the continent of North America are
shown in the data tables below. Assume that the motion is uniform for these three objects and fill in
the blanks of the table. Then record the speed of these three objects (include units).
Giant Sea Turtle Cheetah North America
Time
(hr)
Position
(mi)
Time
(s)
Position
(m)
Time
(yr)
Position
(cm)
0
1
2
3
4
5
6
0
0.23
0.46
0.92
_____
0
0.5
1
1.5
2
2.5
3
0
12.5
75.0
0
0.25
0.50
0.75
1.0
1.25
1.5
0
0.50
0.75
1.5
Speed = ___________ Speed = ___________ Speed = ___________
2 Motion information for a snail, a Honda Accord, and a peregrine falcon are shown in the tables
below. Fill in the blanks of the table. Then record the acceleration of the three objects (include the
appropriate units). Pay careful attention to column headings.
Snail Honda Accord Peregrine Falcon
Time
(day)
Position
(ft)
Time
(s)
Velocity
(mi/hr)
Time
(s)
Velocity
(m/s)
0
1
2
3
4
5
6
0
11
44
66
0
0.5
1
1.5
2
2.5
3
60, E
54, E
42, E
24, E
0
0.25
0.50
0.75
1.0
1.25
1.5
0
18, down
27, down
54, down
Acceleration = _________ Acceleration = __________ Acceleration = __________
- 12. Motion in One Dimension
© The Physics Classroom, 2009 Page 12
3. Use the following equality to form a conversion factor in order to convert the speed of the cheetah
(from question #1) into units of miles/hour. (1 m/s = 2.24 mi/hr) PSYW
4. Use the following equalities to convert the speed of the snail (from question #2) to units of miles per
hour. Show your conversion factors.
GIVEN: 2.83 x 105 ft/day = 1 m/s 1 m/s = 2.24 mi/hr
5. Lisa Carr is stopped at the corner of Willow and Phingsten Roads. Lisa's borrowed car has an oil
leak; it leaves a trace of oil drops on the roadway at regular time intervals. As the light turns green,
Lisa accelerates from rest at a rate of 0.20 m/s2. The diagram shows the trace left by Lisa's car as she
accelerates. Assume that Lisa's car drips one drop every second. Indicate on the diagram the
instantaneous velocities of Lisa's car at the end of each 1-s time interval.
6. Determine the acceleration of the objects whose motion is depicted by the following data.
a = m/s/s a = m/s/s a = m/s/s a = m/s/s
- 13. Motion in One Dimension Name:
© The Physics Classroom, 2009 Page 13
Describing Motion with Position-Time Graphs
Read from Lesson 3 of the 1-D Kinematics chapter at The Physics Classroom:
http://www.physicsclassroom.com/Class/1DKin/U1L3a.html
http://www.physicsclassroom.com/Class/1DKin/U1L3b.html
http://www.physicsclassroom.com/Class/1DKin/U1L3c.html
MOP Connection: Kinematic Graphing: sublevels 1-4 (and some of sublevels 9-11)
Motion can be described using words, diagrams, numerical information, equations, and graphs.
Describing motion with graphs involves representing how a quantity such as the object's position can
change with respect to the time. The key to using position-time graphs is knowing that the slope of a
position-time graph reveals information about the object's velocity. By detecting the slope, one can infer
about an object's velocity. "As the slope goes, so goes the velocity."
Review:
1. Categorize the following motions as being either examples of + or - acceleration.
a. Moving in the + direction and speeding up (getting faster)
b. Moving in the + direction and slowing down (getting slower)
c. Moving in the - direction and speeding up (getting faster)
d. Moving in the - direction and slowing down (getting slower)
Interpreting Position-Graphs
2. On the graphs below, draw two lines/curves to represent the given verbal descriptions; label the
lines/curves as A or B.
A Remaining at rest
B Moving
A Moving slow
B Moving fast
A Moving in + direction
B Moving in - direction
A Moving at constant speed
B Accelerating
A Move in + dirn; speed up
B Move in + dirn; slow dn
A Move in - dirn; speed up
B Move in - dirn; slow dn
3. For each type of accelerated motion, construct the appropriate shape of a position-time graph.
Moving with a + velocity and a + acceleration Moving with a + velocity and a - acceleration
- 14. Motion in One Dimension
© The Physics Classroom, 2009 Page 14
Moving with a - velocity and a + acceleration Moving with a - velocity and a - acceleration
4. Use your understanding of the meaning of slope and shape of position-time graphs to describe the
motion depicted by each of the following graphs.
Verbal Description: Verbal Description:
Verbal Description: Verbal Description:
5. Use the position-time graphs below to determine the velocity. PSYW
PSYW: PSYW:
PSYW: PSYW:
- 15. Motion in One Dimension Name:
© The Physics Classroom, 2009 Page 15
Describing Motion with Velocity-Time Graphs
Read from Lesson 4 of the 1-D Kinematics chapter at The Physics Classroom:
http://www.physicsclassroom.com/Class/1DKin/U1L4a.html
http://www.physicsclassroom.com/Class/1DKin/U1L4b.html
http://www.physicsclassroom.com/Class/1DKin/U1L4c.html
http://www.physicsclassroom.com/Class/1DKin/U1L4d.html
MOP Connection: Kinematic Graphing: sublevels 5-8 (and some of sublevels 9-11)
Motion can be described using words, diagrams, numerical information, equations, and graphs.
Describing motion with graphs involves representing how a quantity such as the object's velocity =
changes with respect to the time. The key to using velocity-time graphs is knowing that the slope of a
velocity-time graph represents the object's acceleration and the area represents the displacement.
Review:
1. Categorize the following motions as being either examples of + or - acceleration.
a. Moving in the + direction and speeding up (getting faster)
b. Moving in the + direction and slowing down (getting slower)
c. Moving in the - direction and speeding up (getting faster)
d. Moving in the - direction and slowing down (getting slower)
Interpreting Velocity-Graphs
2. On the graphs below, draw two lines/curves to represent the given verbal descriptions; label the
lines/curves as A or B.
A Moving at constant speed in - direction
B Moving at constant speed in + direction
A Moving in + direction and speeding up
B Moving in - direction and speeding up
A Moving in + direction and slowing down
B Moving in - direction and slowing down
A Moving with + velocity and - accel'n
B Moving with + velocity and + accel'n
A Moving with - velocity and - accel'n
B Moving with - velocity and + accel'n
A Moving in + dir'n, first fast, then slow
B Moving in - dir'n, first fast, then slow
- 16. Motion in One Dimension
© The Physics Classroom, 2009 Page 16
3. Use the velocity-time graphs below to determine the acceleration. PSYW
PSYW: PSYW:
4. The area under the line of a velocity-time graph can be calculated using simple rectangle and
triangle equations. The graphs below are examples:
If the area under the line forms a ...
... rectangle, then use
area = base*height
A = (6 m/s)*(6 s) = 36 m
... triangle, then use
area = 0.5 * base*height
A = 0.5 * (6 m/s)*(6 s) = 18 m
... trapezoid, then make it into
a rectangle + triangle
and add the two areas.
Atotal = A rectangle + Atriangle
Atotal = (2m/s)*(6 s) +
0.5 * (4 m/s) * (6 s) = 24 m
Find the displacement of the objects represented by the following velocity-time graphs.
PSYW: PSYW: PSYW:
5. For the following pos-time graphs, determine the corresponding shape of the vel-time graph.
- 17. Motion in One Dimension Name:
© The Physics Classroom, 2009 Page 17
Describing Motion Graphically
Study Lessons 3 and 4 of the 1-D Kinematics chapter at The Physics Classroom:
http://www.physicsclassroom.com/Class/1DKin/1KinTOC.html
MOP Connection: Kinematic Graphing: sublevels 1-11 (emphasis on sublevels 9-11)
1. The slope of the line on a position vs. time graph reveals information about an object's velocity. The
magnitude (numerical value) of the slope is equal to the object's speed and the direction of the slope
(upward/+ or downward/-) is the same as the direction of the velocity vector. Apply this
understanding to answer the following questions.
a. A horizontal line means .
b. A straight diagonal line means .
c. A curved line means .
d. A gradually sloped line means .
e. A steeply sloped line means .
2. The motion of several objects is depicted on the position vs. time graph. Answer the following
questions. Each question may have less than one, one, or more than one answer.
a. Which object(s) is(are) at rest?
b. Which object(s) is(are) accelerating?
c. Which object(s) is(are) not moving?
d. Which object(s) change(s) its direction?
e. Which object is traveling fastest?
f. Which moving object is traveling slowest?
g. Which object(s) is(are) moving in the same direction as object B?
3. The slope of the line on a velocity vs. time graph reveals information about an object's acceleration.
Furthermore, the area under the line is equal to the object's displacement. Apply this understanding
to answer the following questions.
a. A horizontal line means .
b. A straight diagonal line means .
c. A gradually sloped line means .
d. A steeply sloped line means .
4. The motion of several objects is depicted by a velocity vs. time graph. Answer the following
questions. Each question may have less than one, one, or more than one answer.
a. Which object(s) is(are) at rest?
b. Which object(s) is(are) accelerating?
c. Which object(s) is(are) not moving?
d. Which object(s) change(s) its direction?
e. Which accelerating object has the smallest acceleration?
f. Which object has the greatest acceleration?
g. Which object(s) is(are) moving in the same direction as object E?
- 18. Motion in One Dimension
© The Physics Classroom, 2009 Page 18
5. The graphs below depict the motion of several different objects. Note that the graphs include both
position vs. time and velocity vs. time graphs.
Graph A Graph B Graph C Graph D Graph E
The motion of these objects could also be described using words. Analyze the graphs and
match them with the verbal descriptions given below by filling in the blanks.
Verbal Description Graph
a. The object is moving fast with a constant velocity and then moves slow with a
constant velocity.
b. The object is moving in one direction with a constant rate of acceleration
(slowing down), changes directions, and continues in the opposite direction
with a constant rate of acceleration (speeding up).
c. The object moves with a constant velocity and then slows down.
d. The object moves with a constant velocity and then speeds up.
e. The object maintains a rest position for several seconds and the slowly
accelerates at a constant rate.
6. Consider the position-time graphs for objects A, B, C and D. On the ticker tapes to the right of the
graphs, construct a dot diagram for each object. Since the objects could be moving right or left, put
an arrow on each ticker tape to indicate the direction of motion.
7. Consider the velocity-time graphs for objects A, B, C and D. On the ticker tapes to the right of the
graphs, construct a dot diagram for each object. Since the objects could be moving right or left, put
an arrow on each ticker tape to indicate the direction of motion.
- 19. Motion in One Dimension Name:
© The Physics Classroom, 2009 Page 19
Interpreting Velocity-Time Graphs
The motion of a two-stage rocket is portrayed by the following velocity-time graph.
Several students analyze the graph and make the following statements. Indicate whether the statements
are correct or incorrect. Justify your answers by referring to specific features about the graph.
Correct?
Student Statement Yes or No
1. After 4 seconds, the rocket is moving in the negative direction (i.e.,
down).
Justification:
2. The rocket is traveling with a greater speed during the time interval from
0 to 1 second than the time interval from 1 to 4 seconds.
Justification:
3. The rocket changes its direction after the fourth second.
Justification:
4. During the time interval from 4 to 9 seconds, the rocket is moving in the
positive direction (up) and slowing down.
Justification:
5. At nine seconds, the rocket has returned to its initial starting position.
Justification:
- 20. Motion in One Dimension
© The Physics Classroom, 2009 Page 20
Graphing Summary
Study Lessons 3 and 4 of the 1-D Kinematics chapter at The Physics Classroom:
http://www.physicsclassroom.com/Class/1DKin/1KinTOC.html
MOP Connection: Kinematic Graphing: sublevels 1-11 (emphasis on sublevels 9-11)
Constant Velocity
Object moves in + Direction
Constant Velocity
Object moves in - Direction
Constant + Acceleration
Object moves in + Direction
Velocity Dir'n: + or - Velocity Dir'n: + or - Velocity Dir'n: + or -
Speeding up or Slowing Down?
Constant + Acceleration
Object moves in - Direction
Constant - Acceleration
Object moves in - Direction
Constant - Acceleration
Object moves in + Direction
Velocity Dir'n: + or -
Speeding up or Slowing Down?
Velocity Dir'n: + or -
Speeding up or Slowing Down?
Velocity Dir'n: + or -
Speeding up or Slowing Down?
- 21. Motion in One Dimension Name:
© The Physics Classroom, 2009 Page 21
Kinematic Graphing - Mathematical Analysis
Study Lessons 3 and 4 of the 1-D Kinematics chapter at The Physics Classroom:
http://www.physicsclassroom.com/Class/1DKin/1KinTOC.html
1. Consider the following graph of a car in motion. Use the graph to answer the questions.
a. Describe the motion of the car during each of the two parts of its motion.
0-5 s:
5-15 s:
b. Construct a dot diagram for the car's motion.
c. Determine the acceleration of the car during each of the two parts of its motion.
0-5 s 5-15 s
d. Determine the displacement of the car during each of the two parts of its motion.
0-5 s 5-15 s
e. Fill in the table and sketch position-time for this car's motion. Give particular attention to how
you connect coordinate points on the graphs (curves vs. horizontals vs. diagonals).
- 22. Motion in One Dimension
© The Physics Classroom, 2009 Page 22
2. Consider the following graph of a car in motion. Use the graph to answer the questions.
a. Describe the motion of the car during each of the four parts of its motion.
0-10 s:
10-20 s:
20-30 s:
30-35 s:
b. Construct a dot diagram for the car's motion.
c. Determine the acceleration of the car during each of the four parts of its motion. PSYW
0-10 s 10-20 s 20-30 s 30-35 s
d. Determine the displacement of the car during each of the four parts of its motion. PSYW
0-10 s 10-20 s 20-30 s 30-35 s
e. Fill in the table and sketch position-time for this car's motion. Give particular attention to how
you connect coordinate points on the graphs (curves vs. horizontals vs. diagonals).
- 23. Motion in One Dimension Name:
© The Physics Classroom, 2009 Page 23
Describing Motion with Equations
Read from Lesson 6 of the 1-D Kinematics chapter at The Physics Classroom:
http://www.physicsclassroom.com/Class/1DKin/U1L6a.html
http://www.physicsclassroom.com/Class/1DKin/U1L6b.html
http://www.physicsclassroom.com/Class/1DKin/U1L6d.html
MOP Connection: None
Motion can be described using words, diagrams, numerical information, equations, and graphs.
Describing motion with equations involves using the three simple equations for average speed, average
velocity, and average acceleration and the more complicated equations known as kinematic equations.
Definitional Equations:
Average Speed =
distance traveled
time Average Velocity =
displacement
time
Acceleration =
change in velocity
change in time
Kinematic Equations:
You should be able to use the following kinematic equations to solve problems. These equations
appropriately apply to the motion of objects traveling with a constant acceleration.
vf = vi + a t d =
vi + vf
2 t d = vi t +
1
2 a t2 vf
2 = vi
2 + 2 a d
- 24. Motion in One Dimension
© The Physics Classroom, 2009 Page 24
A Note on Problem Solving
A common instructional goal of a physics course is to assist students in becoming better and more
confident problem-solvers. Not all good and confident problem-solvers use the same approaches to
solving problems. Nonetheless, there are several habits which they all share in common. While a good
problem-solver may not religiously adhere to these habitual practices, they become more reliant upon
them as the problems become more difficult. The list below describes some of the habits which good
problem-solvers share in common. The list is NOT an exhaustive list; it simply includes some commonly
observed habits which good problem-solvers practice.
Habit #1 - Reading and Visualizing
All good problem-solvers will read a problem carefully and make an effort to visualize the physical
situation. Physics problems begin as word problems and terminate as mathematical exercises. Before the
mathematics portion of a problem begins, a student must translate the written information into
mathematical variables. A good problem-solver typically begins the translation of the written words into
mathematical variables by an informative sketch or diagram which depicts the situation.
Habit #2 - Organization of Known and Unknown Information
Physics problems begin as word problems and terminate as mathematical exercises. During the
algebraic/mathematical part of the problem, the student must make substitution of known numerical
information into a mathematical formula (and hopefully into the correct formula ). Before performing
such substitutions, the student must first equate the numerical information contained in the verbal
statement with the appropriate physical quantity. It is the habit of a good problem-solver to conduct this
task by writing down the quantitative information with its unit and symbol in an organized fashion, often
recording the values on their diagram.
Habit #3 - Plotting a Strategy for Solving for the Unknown
Once the physical situation has been visualized and diagrammed and the numerical information has been
extracted from the verbal statement, the strategy plotting stage begins. More than any other stage during
the problem solution, it is during this stage that a student must think critically and apply their physics
knowledge. Difficult problems in physics are multi-step problems. The path from known information to
the unknown quantity is often not immediately obvious. The problem becomes like a jigsaw puzzle; the
assembly of all the pieces into the whole can only occur after careful inspection, thought, analysis, and
perhaps some wrong turns. In such cases, the time taken to plot out a strategy will pay huge dividends,
preventing the loss of several frustrating minutes of impulsive attempts at solving the problem.
Habit #4 - Identification of Appropriate Formula(e)
Once a strategy has been plotted for solving a problem, a good problem-solver will list appropriate
mathematical formulae on their paper. They may take the time to rearrange the formulae such that the
unknown quantity appears by itself on the left side of the equation. The process of identifying formula is
simply the natural outcome of an effective strategy-plotting phase.
Habit #5 - Algebraic Manipulations and Operations
Finally the mathematics begins, but only after the all-important thinking and physics has occurred. In the
final step of the solution process, known information is substituted into the identified formulae in order
to solve for the unknown quantity.
It should be observed in the above description of the habits of a good problem-solver that the majority of
work on a problem is done prior to the performance of actual mathematical operations. Physics problems
are more than exercises in mathematical manipulation of numerical data. Physics problems require
careful reading, good visualization skills, some background physics knowledge, analytical thought and
inspection and a lot of strategy-plotting. Even the best algebra students in the course will have difficulty
solving physics problems if they lack the habits of a good problem-solver.
- 25. Motion in One Dimension Name:
© The Physics Classroom, 2009 Page 25
Motion Problems
Read from Lesson 6 of the 1-D Kinematics chapter at The Physics Classroom:
http://www.physicsclassroom.com/Class/1DKin/U1L6a.html
http://www.physicsclassroom.com/Class/1DKin/U1L6b.html
http://www.physicsclassroom.com/Class/1DKin/U1L6c.html
http://www.physicsclassroom.com/Class/1DKin/U1L6d.html
MOP Connection: None
Show your work on the following problems.
1. An airplane accelerates down a run-way at 3.20 m/s2 for 32.8 s until is finally lifts off the ground.
Determine the distance traveled before take-off.
2. A race car accelerates uniformly from 18.5 m/s to 46.1 m/s in 2.47 seconds. Determine the
acceleration of the car and the distance traveled.
3. A feather is dropped on the moon from a height of 1.40 meters. The acceleration of gravity on the
moon is 1.67 m/s2. Determine the time for the feather to fall to the surface of the moon.
4. A bullet leaves a rifle with a muzzle velocity of 521 m/s. While accelerating through the barrel of
the rifle, the bullet moves a distance of 0.840 m. Determine the acceleration of the bullet (assume a
uniform acceleration).
- 26. Motion in One Dimension
© The Physics Classroom, 2009 Page 26
5. An engineer is designing a runway for an airport. Several planes will use the runway and the
engineer must design it so that it is long enough for the largest planes to become airborne before the
runway ends. If the largest plane accelerates at 3.30 m/s2 and has a takeoff speed of 88.0 m/s, then
what is the minimum allowed length for the runway?
6. A student drives 4.8-km trip to school and averages a speed of 22.6 m/s. On the return trip home,
the student travels with an average speed of 16.8 m/s over the same distance. What is the average
speed (in m/s) of the student for the two-way trip? (Be careful.)
7. Rennata Gas is driving through town at 25.0 m/s and begins to accelerate at a constant rate of -1.0
m/s2. Eventually Rennata comes to a complete stop. Represent Rennata's accelerated motion by
sketching a velocity-time graph. Use kinematic equations to calculate the distance which Rennata
travels while decelerating. Then use the velocity-time graph to determine this distance. PSYW
8. Otto Emissions is driving his car at 25.0 m/s. Otto accelerates at 2.0 m/s2 for 5 seconds. Otto then
maintains a constant velocity for 10 more seconds. Determine the distance which Otto traveled
during the entire 15 seconds. (Consider using a velocity-time graph.)
9. Chuck Wagon travels with a constant velocity of 0.5 mile/minute for 10 minutes. Chuck then
decelerates at -.25 mile/min2 for 2 minutes. Determine the total distance traveled by Chuck Wagon
during the 12 minutes of motion. (Consider using a velocity-time graph.)
- 27. Motion in One Dimension Name:
© The Physics Classroom, 2009 Page 27
Free Fall
Read Sections a, b and d from Lesson 5 of the 1-D Kinematics chapter at The Physics Classroom:
http://www.physicsclassroom.com/Class/1DKin/U1L5a.html
MOP Connection: None
1. A rock is dropped from a rest
position at the top of a cliff and
free falls to the valley below.
Assuming negligible air
resistance, use kinematic
equations to determine the
distance fallen and the
instantaneous speeds after each
second. Indicate these values on
the odometer (distance fallen)
and the speedometer views
shown to the right of the cliff.
Show a sample calculation below:
2. At which of the listed times is the
acceleration the greatest? Explain
your answer.
3. At which of the listed times is the
speed the greatest? Explain your
answer.
4. If the falling time of a free-falling
object is doubled, the distance
fallen increases by a factor of
_________. Identify two times
and use the distance fallen values
to support your answer.
- 28. Motion in One Dimension
© The Physics Classroom, 2009 Page 28
5. Miss E. deWater, the former platform diver of the Ringling Brothers'
Circus, dives from a 20-meter high platform into a shallow bucket of
water (see diagram at right).
a. State Miss E. deWater's acceleration as she is falling from the
platform. __________ What assumption(s) must you make in order to
state this value as the acceleration? Explain.
b. The velocity of Miss E. deWater after the first half second of fall is
represented by an arrow. The size or length of the arrow is
representative of the magnitude of her velocity. The direction of the
arrow is representative of the direction of her velocity. For the
remaining three positions shown in the diagram, construct an arrow of
the approximate length to represent the velocity vector.
c. Use kinematic equations to fill in the table below.
Show your work below for one of the rows of the table.
6. Michael Jordan was said to have a hang-time of 3.0 seconds (at least according to NIKE). Use
kinematic equations to determine the height to which MJ could leap if he had a hang-time of 3.0
seconds.
- 29. Motion in One Dimension Name:
© The Physics Classroom, 2009 Page 29
Name That Motion Activity
Directions:
1. Open an internet browser and find your way to the following URL in the Shockwave Physics
Studios section of The Physics Classroom web site.
http://www.physicsclassroom.com/shwave/namethat.html
2. From the opening screen, click on the Continue button to log on and begin the activity.
3. Enter your first and last name. If working with a partner (recommended), enter their first and last
name. Then click the Start button.
4. Use the on-screen buttons (A-K, Replay, Erase, Check Answers) and field to complete the activity.
- 30. Motion in One Dimension
© The Physics Classroom, 2009 Page 30
The 11 verbal statements below must be matched to the 11 animations seen on the screen. Once all 11
matches have been made, you will be able to check your answers. You will be given feedback and can
make alterations until all your answers are perfect.
Verbal Statements:
1. The object moves with a positive velocity and a positive acceleration.
2. The object moves with a constant negative velocity. Then, the object remains at rest for several
seconds. Finally, the object moves with positive acceleration.
3. The object moves with a constant negative velocity.
4. The object moves with a negative velocity. Then, the object remains at rest for several seconds.
Finally, the object moves with a low constant speed.
5. The object moves with constant speed in the positive direction.
6. The object slowly accelerates from rest. Then, the object remains at rest for several seconds. Finally,
the object moves with a constant negative velocity.
7. The object moves at constant speed. Then, the object remains at rest for several seconds. Finally, the
object moves with a constant negative velocity.
8. The object moves in the positive direction with a negative acceleration.
9. The object moves in the negative direction with a negative acceleration.
10. The object moves with a low speed for a short time interval. Then the object remains at rest for
several seconds. Finally, the object rapidly accelerates with a positive acceleration.
11. The object moves with a negative velocity and a positive acceleration.
Use the space below to assist in organizing your answers and making corrections. The first two rows are
provided as examples.
- 31. Motion in One Dimension Name:
© The Physics Classroom, 2009 Page 31
Graph That Motion Activity
Directions:
1. Open an internet browser and find your way to the following URL in the Shockwave Physics
Studios section of The Physics Classroom web site.
http://www.physicsclassroom.com/shwave/graphthat.html
2. From the opening screen, click on the Continue button to log on and begin the activity.
3. Enter your first and last name. If working with a partner (recommended), enter their first and last
name. Then click the Start button.
4. Use the on-screen buttons (A-K, Replay, Erase, Check Answers) and field to complete the activity.
- 32. Motion in One Dimension
© The Physics Classroom, 2009 Page 32
The 11 graphs below must be matched to the 11 animations. Once all 11 matches have been made, you
will be able to check your answers. You will be given feedback and can make alterations until all your
answers are perfect. Inform your teacher when you have completed the activity or decide to quit.
Graph 1 Graph 2 Graph 3
Graph 4 Graph 5 Graph 6
Graph 7 Graph 8 Graph 9
Graph 10 Graph 11
Use the table to assist in organizing answers and making corrections. The first two rows are examples.
- 33. Motion in One Dimension Name:
© The Physics Classroom, 2009 Page 33
Two Stage Rocket Activity
Background and Purpose:
In this activity, you will analyze the motion of a two-stage rocket. The two-stage rocket has two
separate fuel stages which provide a different acceleration. After the second fuel stage is burned out,
the rocket is under the sole influence of the force of gravity. Like a Fourth of July fireworks rocket, it is
pre-programmed to explode at a specific time.
The purpose of this activity is to apply the principles of the graphical description of motion in order to
graphically analyze the motion of the two-stage rocket. Once you have completed the activity, you
have the option to take a short online quiz which targets your understanding of position-time and
velocity-time graphs. The quiz will be related to the questions shown below.
Getting Ready:
Open an Internet browser and navigate to the Two Stage Rocket activity found in the Shockwave
Physics Studios section of The Physics CLassroom web site.
Procedure and Questions:
1. Navigate to the Two Stage Rocket Animation and experiment with the on-screen buttons in order
to gain familiarity with the control of the animation. The animation can be started, paused,
continued, single-stepped or rewound. Coordinate points on the graphs are displayed as the
mouse is rolled over it.
After gaining familiarity with the program, use it to answer the following questions:
2. State the time interval for the various stages of the rocket's motion.
Stage 1: ____ sec to ____ sec Stage 2: ____ sec to ____ sec
No Fuel: ____ sec to ____ sec Rocket Explodes at _____ sec
Conceptual Analysis:
3. In what direction (up or down) is the rocket moving at each of the following times?
t = 3 s t = 10 s t = 18 s t = 25 s
4. In what direction (up or down) is the rocket accelerating at each of the following times?
t = 3 s t = 10 s t = 18 s t = 25 s
5. Is the rocket ever moving in one direction and accelerating in the opposite direction?
If No, then explain why it never does.
If Yes, then this occurs when the rocket is ...
a. moving upward during stage 1 and stage 2.
b. moving upward after stage 2 has ended.
c. moving downward after stage 2 has ended.
d. moving (both upward and downward) after stage 2 has ended.
6. How does the acceleration of the rocket during stage 1 compare to its value during stage 2?
a. The acceleration is greatest during stage 1.
b. The acceleration is greatest during stage 2.
c. The acceleration are the same.
d. The acceleration varies during the stage and it is impossible to answer.
- 34. Motion in One Dimension
© The Physics Classroom, 2009 Page 34
7. How does the velocity of the rocket during stage 1 compare to its value during stage 2?
a. The velocity is greatest during stage 1.
b. The velocity is greatest during stage 2.
c. The velocity are the same.
d. The velocity varies during the stage and it is impossible to answer.
8. What statement best describes the changes observed of the rocket and its velocity vector after the
second stage ends and there is no fuel left to power the rocket?
a. The rocket changes direction and its velocity vector continually decreases in magnitude.
b. The rocket moves upward, then changes direction; the velocity continually decreases in
magnitude.
c. The rocket moves upward, then changes direction; the velocity first increases and then
decreases in magnitude.
d. The rocket moves upward, then changes direction; the velocity first decreases and then
increases in magnitude.
9. At what time does the rocket change its direction? seconds
10. What is the acceleration value of the rocket when it is at its peak height? m/s/s
11. What is the velocity value of the rocket when it is at its peak height? m/s
12. Observe the acceleration of the rocket during the no-fuel stage of its motion.
a. Is it constant or changing?
b. What is its direction?
c. What is its magnitude (i.e., numerical value)?
Graphical/Mathematical Analysis:
13. A velocity-time graph is shown at the
right. Sketch the graph for your
rocket's motion (as displayed on the
screen). Be accurate and show strategic
coordinates - for example, at the end of
stage 1 and stage 2 and at the rocket's
peak position. These coordinates can
be read off the screen by moving your
mouse over the graphical display.
End of stage 1: (t, v) =
End of stage 2: (t, v) =
When crossing axis: (t, v) =
At explosion time: (t, v) =
- 35. Motion in One Dimension Name:
© The Physics Classroom, 2009 Page 35
14. On the graph above, put a bold dot ( ) at the location that the rocket changes its direction.
Clearly label the dot with the words Peak. (This is a question similar to #9.)
15. Use coordinates which you listed above to calculate the slopes of the lines on the graph during
stage 1, stage 2 and the no fuel stage. Show your work clearly.
Stage 1
Stage 2
No-Fuel Stage
16. Compare the slopes of the lines on the velocity vs. time plot (as calculated above) to the
acceleration of the rocket.
Accel'n Value Slopes of v-t Graph
Stage 1
Stage 2
No-Fuel Stage
What do you suppose the slope of a line on a velocity-time plot represents?
17. Use coordinates which you listed above to calculate the area between the lines on the graph and
the time axis during stage 1, stage 2 and the no fuel stage (both while rising and while falling).
Show your work clearly.
Stage 1
A1 =
Stage 2
A2 =
No-Fuel (Rising)
A3 =
No-Fuel (Falling)
A4 =
- 36. Motion in One Dimension
© The Physics Classroom, 2009 Page 36
18. Compare the cumulative areas at the end of the various phases of motion to the heights of the
rocket at the corresponding times. If necessary, re-run the animation and Single Step to the end of
each stage or roll the mouse over the position-time plot to obtain height values.
Height Value Cumulative Area
End of Stage 1
A1 =
End of Stage 2
A1 + A2 =
At the peak of
motion
A1 + A2 + A3 =
At the time of
explosion
A1 + A2 + A3 + A4 =
What do you suppose the area between the line and the time axis on a velocity-time plot
represents?