SlideShare ist ein Scribd-Unternehmen logo
1 von 19
SKF Year-end report 2010
Tom Johnstone, President and CEO:
"SKF delivered a very good performance in 2010 with record operating profit and operating
margin and a strong cash flow. We took a number of steps during the year to further
strengthen the Group and opened three new factories and announced two more to support our
development in the faster growing regions and segments. In addition, we completed the
acquisition of Lincoln Industrial which complements our existing lubrication systems business.
In the fourth quarter all regions and divisions showed very good growth, as expected.
Entering 2011 we expect to see a continued positive volume development. However, we will
face headwinds due to currency and higher raw material costs, adding to those already faced
in the fourth quarter. To support our long-term profit and growth targets we will step up our
investments in manufacturing, research and development and in additional sales and
engineering resources.”

                                                     Q4           Q4         YTD          YTD
                                                   2010        2009         2010         2009
Net sales, SEKm                                  15,409       13,887      61,029        56,227
Operating profit, SEKm                            2,202        1,004       8,452         3,203
Operating margin, %                                14.3          7.2        13.8           5.7
Operating margin excl. one-off items, %            14.9         10.1        14.2           8.0
Profit before taxes, SEKm                         2,048          765       7,549         2,297
Net profit, SEKm                                  1,350          505       5,296         1,705
Basic earnings per share, SEK                      2.87         1.05       11.28          3.61

The increase of 11.0% in net sales for the quarter, in SEK, was attributable to: volume 16.3%,
price/mix 0.9% and currency effects -6.2%. For the full year, the increase of 8.6%, in SEK,
was attributable to: volume 14.1%, price/mix 0.1% and currency effects -5.6%.

The quarter included costs, affecting the operating profit, of around SEK 100 million due to the
acquisition of Lincoln Industrial. Total one-off items impacting operating profit for the full-year
amounted to SEK 190 million.

Dividend proposal
Based on the strong performance, cash generation capacity and outlook, the Board has
decided to propose to the Annual General Meeting an increase in the dividend of 43%, giving a
dividend of SEK 5.00 (3.50) per share.

Outlook for the first quarter of 2011
Development compared to the first quarter last year
The demand for SKF products and services is expected to be significantly higher for the Group, the
divisions and for the different geographical areas.

Development compared to the fourth quarter 2010 and adjusted for normal seasonality
The demand is expected to be slightly higher for the Group and for the different geographical
areas. The Industrial Division and the Service Division are expected to be slightly higher and the
Automotive Division higher.

Manufacturing level
The manufacturing level will be significantly higher year on year and slightly higher compared
to the fourth quarter, adjusted for normal seasonality.
Development in the fourth quarter compared to the same period last year
Sales in local currencies were significantly higher for the Group, for Europe, North America,
Latin America and Asia as well as for the divisions.

The manufacturing level was significantly higher than in the fourth quarter last year.

Financial
                                        31 December          30 September         31 December
Key figures                                    2010                  2010                 2009
Inventories, % of annual sales                  21.1                 20.2                 20.9
ROCE for the 12-month period, %                 24.0                 20.7                  9.1
ROE for the 12-month period, %                  28.4                 24.3                  9.0
Equity/assets ratio, %                          36.0                 36.0                 35.8
Gearing, %                                      48.6                 47.6                 49.3
Net debt/equity, %                              80.5                 61.5                 68.9
Registered number of employees               44,742                42,475               41,172

The SKF Group’s balance sheet and key figures above are impacted by the inclusion of Lincoln
Industrial’s preliminary balance sheet. Excluding Lincoln Industrial, inventories were 20.0%
and the number of employees was 42,735. The total purchase price for Lincoln Industrial was
SEK 7,047 million, and the cash outflow was SEK 6,764 million.

Cash flow, after investments and before financing, was SEK -5,966 million (1,445) for the
fourth quarter and SEK -2,838 million (5,752) for the full year 2010. Excluding the acquisition
of Lincoln Industrial it was SEK 798 million for the fourth quarter and SEK 3,926 million for the
full year.

The financial net in the fourth quarter of 2010 was SEK -154 million (-239), for the full year it
was SEK -903 million (-906). The full-year figure has a negative effect of SEK 225 million
relating to a loss on the Ovako vendor note.

Exchange rates, the effects of translation and transaction flows, had a negative effect of SEK
50 million on SKF’s operating profit in the fourth quarter and a negative effect of around SEK
400 million for the full year, compared to the corresponding period last year. It is estimated
that there will be a negative effect of SEK 150 million on operating profit in the first quarter
and for the full year a negative effect of SEK 900 million, based on current assumptions and
exchange rates and compared to the corresponding period last year.

R&D expenditure was SEK 1,184 million (1,217), corresponding to 1.9% (2.2) of annual
sales, excluding developing IT solutions. The number of first filings of patent applications
was 251 (218).


SKF’s Performance Share Programme 2011
In order to continue to link the interests of the senior management and the shareholders, the
Board proposes that a decision be taken at the Annual General Meeting in April 2011 on SKF’s
Performance Share Programme 2011. The terms and conditions of the proposed SKF’s
Performance Share Programme 2011 are in essence the same as the terms and conditions of
the programmes for 2008, 2009 and 2010.
It is proposed that the programme covers a maximum of 310 senior managers and key
employees in the SKF Group, including Group Management, with the opportunity of being
allotted, free of charge, SKF class B shares. The number of shares that may be allotted must
be related to the degree of achievement of financial targets defined by the Board of Directors
in accordance with the SKF Group’s TVA management model and must pertain to the period
commencing 2011 up to and including 2013. Under the programme, no more than 1,000,000
class B shares may be allotted.
The Performance Share programme 2008, which was decided by the AGM on April 16, 2008
will be settled in the first quarter 2011. The outcome is that about 250 managers of the SKF
Group will receive around 117,000 SKF class B shares (around 12% of maximum) amounting
to around SEK 25 million including social charges.


The year in brief
The Group’s ongoing cost reduction activities, combined with the improved volumes both in
sales and manufacturing and the continued implementation of the Group’s strategy, had a
very positive effect on the Group’s operating profit and resulted in a record operating profit
and operating margin for the Group. The steps taken in recent years to make the company
more robust is giving results which can be seen by the very positive development in 2010 and
the resilient performance in 2009.
As a result of the strong performance and the strategy for the SKF Group new long-term
financial targets were announced in October 2010. The new targets are to have an operating
margin level of 15%, annual sales growth in local currencies of 8% and a return on capital
employed of 27%. The inventory target of 18% of net sales remain. The main initiatives going
forward to support the strategy and targets will be to accelerate profitable growth, to reduce
costs and eliminate waste and to invest for growth.
Three new factories were opened during the year, two in India, at Haridwar and Ahmedabad,
and one in Russia at Tver. These factories are built to the LEED (Leadership in Energy and
Environmental Design) or equivalent standard as with all new SKF facilities. SKF also
announced the construction of two new factories which will open in late 2011. A new seals
factory is under construction in Mysore, India and a bearing factory is being established in
Dalian, China to produce medium-sized bearings for the industrial market.
SKF continued to open new SKF Solution Factories throughout the year with nine being
opened, bringing the total at the end of 2010 to 17. These SKF Solution Factories gather SKF’s
expertise under one roof and are already proving beneficial for customers and distributors by
making SKF’s knowledge more readily accessible to them.
To support the development in Asia, SKF opened a new Global Technical Centre in China to
complement the centre opened in India in 2009. These new Global Technical Centres will be
an integral part of the SKF Group’s global technology network and will bring new product
development closer to SKF’s customers in this rapidly developing region.


Acquisition of Lincoln Industrial (see separate press release dated 23 December 2010)
SKF’s acquisition of Lincoln Holding Enterprises (Lincoln Industrial), a leading supplier of
lubrication systems and tools was completed at the end of the year. Lincoln Industrial,
headquartered in St. Louis, Missouri, USA has about 2,000 employees and generated sales of
around USD 400 million in 2010 with an operating margin of around 24%.
The acquisition is in line with SKF’s strategy to grow the lubrication systems market. Lincoln
Industrial is highly complementary to SKF’s existing lubrication system business when it
comes to geographical sales coverage, technology and manufacturing footprint, in particular in
North America and Asia. In addition, Lincoln Industrial provides SKF with improved access to
the lubrication tools and equipment aftermarket in North America.
Page 1 of 19


Lincoln Industrial is included in the Group’s balance sheet at year-end 2010 with preliminary
opening balances, as follows:

Fair value of net assets acquired (SEKm):
Intangibles assets                         7,032
Operating assets                           1,747
Other liabilities                         -1,732
Total purchase price                       7,047

Cash and cash equivalents acquired               -283
Cash outflow                                    6,764


Lincoln Industrial’s income statement will be included in the Group from the first-quarter results of
2011, as part of a newly created business unit for lubrication systems within SKF Industrial
Division.
Based on the preliminary opening balances, annual amortization and depreciation together are
expected to be slightly below USD 25 million for acquired intangibles and plant, property and
equipment after fair value adjustments. The operating profit will be negatively impacted primarily
in the first quarter by around USD 15 million, representing the fair value adjustment on inventories
as part of opening balances for Lincoln Industrial.

Please see enclosure 8 for more information about the acquisition of Lincoln Industrial.

Divestment subsequent to year end
SKF divested its forging business, Officine Meccaniche Villar Perosa SpA (OMVP), in Villar Perosa,
Italy to the German based company Neumayer Tekfor Holding GmbH, one of the largest forging
companies in Europe. The sale is fully in line with the SKF’s strategy to divest non-core component
manufacturing and will have a limited impact on the results and cash flow. OMVP has about 550
employees and net sales of around EUR 100 million, mainly to other SKF operations. The parties
have agreed on continuing the supply and strengthening the cooperation.

Divisions
Comments on sales are based on local currencies and compared to the corresponding period for
2009. The operating margin has been calculated on sales including intra-Group sales.

Industrial Division
The operating profit for the fourth quarter amounted to SEK 902 million (237), resulting in an
operating margin of 12.1% (3.5) on sales including intra-Group sales. The operating profit for the
full year amounted to SEK 3,498 million (1,551), resulting in an operating margin of 11.8% (5.4).
Sales including intra-Group sales for the quarter were SEK 7,443 million (6,745), and for the full
year SEK 29,607 million (28,546).

Net sales for the fourth quarter amounted to SEK 4,904 million (4,508) and for the full year SEK
19,424 million (19,534). The increase of 8.8% for the quarter was attributable to:
organic growth 16.6% and currency effects -7.8%.
For the full year the decrease of -0.6% was attributable to:
organic growth 6.0% and currency effects -6.6%.

Sales in local currency for the fourth quarter were significantly higher in Europe, North America
and Asia. For the full year they were lower in Europe, higher in North America and significantly
Page 2 of 19


higher in Asia. The positive trend continued in all main segments with a particular good
development in construction equipment, fluid power and industrial gearboxes.

Service Division
The operating profit for the fourth quarter amounted to SEK 841 million (729), resulting in an
operating margin of 14.6% (14.3). The operating profit for the full year amounted to SEK 3,036
million (2,585), resulting in an operating margin of 13.5% (13.0). Sales including intra-Group sales
for the quarter were SEK 5,763 million (5,098), and for the full year SEK 22,408 million (19,957).
Net sales for the fourth quarter amounted to SEK 5,664 million (5,008) and for the full year SEK
22,029 million (19,599). The increase of 13.1% for the quarter was attributable to:
organic growth 17.2% and currency effects -4.1%.
For the full year the increase of 12.4% was attributable to:
organic growth 16.1% and currency effects -3.7%.

Sales in local currencies for the fourth quarter were significantly higher in Europe, Asia, North
America and Latin America. In Middle East and Africa they were higher. For the full year they were
significantly higher in Europe, Asia, Latin America and Middle East and Africa. In North America
they were higher, affected by the ongoing distributor de-stocking.

Automotive Division
The operating profit for the fourth quarter amounted to SEK 445 million (92), resulting in an
operating margin of 8.2% (1.9). The operating profit for the full year amounted to SEK 1,859
million (-785), resulting in an operating margin of 8.5% (-4.1). Sales including intra-Group sales
for the quarter were SEK 5,439 million (4,880), and for the full year SEK 21,989 million (19,103).

Net sales for the fourth quarter amounted to SEK 4,491 million (4,110) and for the full year SEK
18,231 million (16,051). The increase of 9.3% for the quarter was attributable to:
organic growth 16.3% and currency effects -7.0%.
For the full year the increase of 13.6% was attributable to:
organic growth 20.2% and currency effects -6.6%.

Sales in local currencies to the car and light truck industries in Europe and North America were
higher for the quarter and significantly higher for the full year. In Asia sales were significantly
higher both for the quarter and for the full year.
Sales to the heavy truck industries in Europe, North America and Asia were significantly higher
both for the quarter and for the full year.
Sales to the vehicle service market in Europe, Latin America and Asia were significantly higher in
the quarter and for the full year. In North America sales were significantly higher in the quarter
and relatively unchanged for the full year.
Sales to the electrical industry in Europe as well as sales to the two-wheeler industry in Asia were
significantly higher both for the quarter and for the full year.

Highlights in the quarter:
In Europe, a new contract for the SKF Low Friction Engine Seal with Isuzu was signed. The SKF
Low Friction Engine Seal, launched in 2010, is used in many automotive applications, providing
lower fuel consumption and reducing CO2 emissions via significantly reduced friction.
In Germany, a SKF Gear Bearing Unit was developed with Daimler for their heavy duty engines.
This is a customized tapered gear bearing unit designed to accommodate heavy loads.
Page 3 of 19


A number of new offerings were launched during the quarter. The solutions include among others a
pulley unit designed for the alternator in the engine and a unit that helps to reduce energy and
water consumption for front loaded washing machines.

Previous outlook statement:
Outlook for the fourth quarter of 2010
Development compared to the fourth quarter last year
The demand for SKF products and services is expected to be significantly higher for the Group, the
divisions and for the different geographical areas.

Development compared to the third quarter 2010 and adjusted for normal seasonality
The demand is expected to be slightly higher for the Group, the divisions and for the different
geographical areas.

Manufacturing level
The manufacturing level will be significantly higher year on year and unchanged compared to the
third quarter, adjusted for normal seasonality.


Highlights in the previous quarters
•   SKF was awarded a contract with Guohua Energy Investment, a major Chinese energy
    company to supply 180 SKF WindCon systems to improve reliability maintenance for existing
    turbines. Guohua Energy Investment is also developing a new wind farm in Beijing to which
    SKF will supply 58 SKF WindCon systems.
•   SKF has launched 13 new offerings to help customers increase reliability and safety as well as
    reduce costs, CO2 emissions and environmental impact. The solutions include a four-row
    tapered roller bearing for rolling mills, a low friction X-Tracker wheel hub bearing unit for cars
    and light trucks, SKF Cam Follower Units for direct injection systems of cars and trucks, asset
    management services for cranes, specialized bearings for sub-sea and pumps in extreme
    environments in the oil and gas industry and a hydraulic-driven lubricator for hammers and
    breakers used in the construction industry.
•   SKF has now documented over USD two billion savings by its customers as a result of using
    SKF solutions. This data was collected over a 10-year period with the close cooperation of
    customers and the use of a patented SKF program, SKF Documented Solutions Program.
•   SKF is building a factory for medium-sized bearings in China. The factory will be located in
    Dalian, close to SKF’s existing factory for large-sized bearings. The new investment amounts to
    around SEK 400 million and is expected to come into operation in 2011 employing 250 people.
•   SKF will expand its present seals manufacturing capacity by building a new factory in Mysore,
    India that will serve customers within the automotive, railway and industrial applications
    segments. The investment amounts to around SEK 160 million and will be fully operational by
    the second half of 2012 employing about 600 people.
•   SKF is investing around USD 18 million in a new heat treatment facility in Falconer, USA, as
    part of an expansion to its areoengine operations in the country. The new facility will house a
    new high-tech vacuum furnace for the carburizing and hardening of a variety of materials and
    is a very critical operation in the bearing manufacturing process.
•   Two new SKF Solution Factories were inaugurated in the quarter, one in the UK and one in
    Turkey. There are now fourteen SKF Solution Factories over the world.
•   SKF’s newly constructed manufacturing facility in Tver, Russia as well as the new corporate
    head office in Lansdale, USA have been designed and constructed according to the U.S. Green
    Building council’s LEED (Leadership in Energy and Environmental Design) standard. The factory
    in Tver has now been awarded Gold level and is the first manufacturing facility to have this
Page 4 of 19


    type of certification anywhere in Russia, while the Lansdale office has achieved Platinum - the
    highest level in the LEED certification system.
•   For the eleventh year in succession, SKF was selected to be a member of Dow Jones’
    Sustainability World Indexes and for the tenth year in succession, in the FTSE4Good Index
    Series.
•   SKF inaugurated its new factory in Tver, Russia where the new generation of SKF’s sealed and
    pre-lubricated compact tapered bearing units will be produced for the Russian and international
    railway customers. The factory will be one of the first in Russia and in Europe with LEED
    certification. The investment amounts to around SEK 235 million and the factory will employ
    100 people.
•   SKF inaugurated a Global Technical Centre China in Shanghai. The centre will be an integral
    part of SKF’s global network of technical centres and will enable SKF to develop products and
    solutions for local and global customers in a faster and more cost effective way.
•   SKF was awarded an agreement with ZF Sachs Italy to supply 140,000 oil seals and wiper
    seals for motorcycle forks.
•   SKF signed a three-year contract worth around SEK 34 million with Valeo to supply SKF Rotor
    Positioning Bearings for the new i-StARS, Valeos stop-start system. i-StARS automatically cuts
    off the vehicle’s engine when slowing down under 8 km/h, e.g when stopping for a red light.
    The system enables further reduction in CO2 emissions.
•   SKF signed a framework agreement with the State Forestry Administration in China to plant
    new forests, in remote areas of the country. The project is expected to run for five years.
•   SKF received the “Golden Mousetrap” award in the 2010 “Best products awards” announced by
    the magazine Design News. This was in the Electronics/Test and Measurement category and for
    the new SKF Machine Condition Advisor, a handheld instrument which simplifies machine
    monitoring and provides early warning of potential failures. Design News annual Golden
    Mousetrap Awards recognize engineering innovation and creativity in product design.
•   SKF has assisted S-OIL, a large South Korean oil refinery, to increase productivity and reduce
    potential production downtime. The project resulted in a payback for S-OIL in less than 11
    months. The SKF solution included the development of asset strategy, defect eliminations and
    operator driven reliability.
•   Three new SKF Solution Factories were inaugurated, one in Schweinfurt, Germany,
    one in Montigny-le-Bretonneux, France and one in Moscow, Russia.
•   SKF inaugurated two new factories in India. The factory in Haridwar will manufacture deep
    groove ball bearings and the Ahmedabad factory will manufacture medium to large-sized
    bearings of various types.
•   A programme was concluded in March for adjusting the manufacturing capacity in Gothenburg,
    Sweden. The total cost of these activities, around SEK 90 million, mainly impacted the
    Industrial Division and has been charged to the income statement in the first quarter. The
    benefit of these actions will be around SEK 50 million per year when fully implemented by the
    third quarter.
•   The ninth SKF Solution Factory was inaugurated in Houston, USA.

Risks and uncertainties in the business
The SKF Group operates in many different industrial, automotive and geographical segments that
are at different stages of the economic cycle. A general economic downturn at global level, or in
one of the world’s leading economies, could reduce the demand for the Group’s products, solutions
and services for a period of time. In addition, terrorism and other hostilities, as well as
disturbances in worldwide financial markets, could have a negative effect on the demand for the
Page 5 of 19


Group’s products and services. There are also political and regulatory risks associated with the
wide geographical presence. Regulatory requirements, taxes, tariffs and other trade barriers, price
or exchange controls or other governmental policies could limit the SKF Group’s operations.
The SKF Group is subject to both transaction and translation of currency exposure. For commercial
flows the SKF Group is primarily exposed to the USD and to US dollar-related currencies. As the
major part of the profit is made outside Sweden, the Group is also exposed to translational risks in
all the major currencies. The parent company performs services of a common Group character. The
financial position of the parent company is dependent on the financial position and development of
the subsidiaries. A general decline in the demand for the products and services provided by the
Group could mean lower dividend income for the parent company, as well as a need for writing
down values of the shares in the subsidiaries.

Cautionary statement
This report contains forward-looking statements that are based on the current expectations of the
management of SKF. Although management believes that the expectations reflected in such
forward-looking statements are reasonable, no assurance can be given that such expectations will
prove to have been correct. Accordingly, results could differ materially from those implied in the
forward-looking statements as a result of, among other factors, changes in economic, market and
competitive conditions, changes in the regulatory environment and other government actions,
fluctuations in exchange rates and other factors mentioned in SKF's latest annual report (available
on www.skf.com) under the Administration Report; "Important factors influencing the financial
results", "Financial risks" and "Sensitivity analysis", and in this full-year report under "Risks and
uncertainties in the business."

Gothenburg, 1 February 2011
Aktiebolaget SKF
(publ.)

Tom Johnstone
President and CEO
Page 6 of 19


Teleconference/meeting - On 1 February at 13.30 (CET), 12.30 (UK):
+46 (0)8 5052 0114 Swedish participants, ref.no. 885203
+44 (0)207 1620 177 European participants, ref.no. 885203
+1 334 323 6203 US participants, ref.no. 885203
Venue: Operaterrassen
        Karl XII:s torg
        Stockholm
Please don’t use your phone’s loudspeaker as this has a negative effect on the sound.


You will find all information regarding SKF Year-end results on the IR website.
http://investors.skf.com/quarterlyreporting


Enclosures:

Financial statements
1. Consolidated income statements
2. Consolidated statements of comprehensive income and consolidated statements of changes in
    shareholders’ equity
3. Consolidated balance sheets
4. Consolidated statements of cash flow
Other financial statements
5. Consolidated financial information - yearly and quarterly comparisons
6. Segment information - yearly and quarterly comparisons
7. Parent company income statements, statements of comprehensive income, balance sheets and
    footnote
8. Acquisition of Lincoln Industrial

The consolidated financial statements of the SKF Group are prepared in accordance with International Financial
Reporting Standards as adopted by EU. The SKF Group applies the same accounting policies and methods of
computation in the interim financial statements as compared with the Annual Report 2009 including
Sustainability Report. No new or amended IFRS effective 2010 had any significant impact on the Group.

The consolidated quarterly report has been prepared in accordance with IAS 34. The report for the parent
company has been prepared in accordance with the Annual Accounts Act and RFR 2. The report has not been
reviewed by the company’s auditors.

The SKF First-quarter report 2011 will be published on Tuesday, 19 April 2011.
The Annual General Meeting will be held on Thursday, 28 April 2011 in Gothenburg, Sweden.

The SKF Annual Report including Sustainability Report for 2010 will be published in a pdf-format on SKF’s
website http://investors.skf.com on 11 March 2011. The printed report will be delivered on 24 March 2011
and will be available at the company on that day.

Further information can be obtained from:
Ingalill Östman, Group Communication
tel: +46-31-3373260, mobile: +46-706-973260, e-mail: ingalill.ostman@skf.com
Marita Björk, Investor Relations
tel: +46-31-3371994, mobile: +46-705-181994, e-mail: marita.bjork@skf.com


Aktiebolaget SKF, SE-415 50 Göteborg, Sweden, Company reg.no. 556007-3495,
Tel: +46-31-3371000, fax: +46-31-3372832, www.skf.com
Page 7 of 19


                                                                                                                 Enclosure 1
CONSOLIDATED INCOME STATEMENTS (SEKm)

                                                            Oct-Dec           Oct-Dec         Jan-Dec           Jan-Dec
                                                              2010              2009             2010              2009

Net sales                                                     15,409           13,887          61,029            56,227
Cost of goods sold                                           -11,139          -11,049         -44,216           -45,024
Gross profit                                                   4,270            2,838          16,813            11,203

Selling and administrative expenses                           -2,020            -1,838          -8,222           -7,915
Other operating income/expenses - net                            -49                 2            -139              -74
Profit/loss from jointly controlled and
associated companies                                               1                 2               0              -11
Operating profit                                               2,202             1,004           8,452            3,203

Operating margin, %                                              14.3               7.2           13.8              5.7

Financial income and expense - net                              -154              -239            -903             -906
Profit before taxes                                            2,048               765           7,549            2,297

Taxes                                                           -698              -260          -2,253             -592
Net profit                                                     1,350               505           5,296            1,705

Net profit attributable to
Shareholders of the parent                                     1,311               476           5,138            1,642
Non-controlling interests                                         39                29             158               63


Basic earnings per share, SEK*                                   2.87             1.05           11.28             3.61

Diluted earnings per share, SEK*                                 2.87             1.05           11.28             3.61

Additions to property, plant and equipment                        460              505           1,651            1,975

Number of employees registered                                44,742           41,172          44,742            41,172

Return on capital employed for the
12-month period ended 31 December, %                             24.0               9.1           24.0              9.1

* Basic and diluted earnings per share are based on net profit attributable to shareholders of the parent.


NUMBER OF SHARES

Total number of shares                              455,351,068         455,351,068 455,351,068              455,351,068
 - whereof A shares                                  44,915,604          45,421,004 44,915,604                45,421,004
 - whereof B shares                                 410,435,464         409,930,064 410,435,464              409,930,064

Total number of diluted shares outstanding          455,351,068         455,351,068 455,351,068              455,351,068

Total weighted average number of diluted
shares                                              455,351,068         455,351,068 455,351,068              455,365,536
Page 8 of 19


                                                                                              Enclosure 2
CONSOLIDATED STATEMENTS OF COMPREHENSIVE INCOME (SEKm)

                                                         Oct-Dec     Oct-Dec   Jan-Dec      Jan-Dec
                                                           2010        2009       2010         2009

Net profit                                                1,350          505       5,296      1,705

Other comprehensive income
Exchange differences arising on translation of
foreign operations                                           22          456       -1,660      -798

Available-for-sale assets                                   119           79         169        134

Cash flow hedges                                             14          -41          18        182

Actuarial gains and losses                                  839          -75        -616       -888

Income tax relating to components of other
comprehensive income                                       -286            8           56       105
Other comprehensive income, net of tax                      708          427       -2,033    -1,265

Total comprehensive income                                2,058          932       3,263        440

Total comprehensive income attributable to
Shareholders of AB SKF                                    2,012          869       3,131        412
Non-controlling interests                                    46           63         132         28


CONSOLIDATED STATEMENTS OF CHANGES IN SHAREHOLDERS’ EQUITY (SEKm)

                                                                   December 2010       December 2009
Opening balance 1 January                                                 18,280              19,689
Total comprehensive income                                                 3,263                 440
Cost for share programmes and exercise of options, net                         8                 -12
Non-controlling interests                                                    -35                -208
Total cash dividends                                                      -1,622              -1,629
Closing balance                                                           19,894              18,280
Page 9 of 19


                                                                          Enclosure 3
CONSOLIDATED BALANCE SHEETS (SEKm)
                                                   December 2010   December 2009

Goodwill                                                   6,309              2,759

Other intangible assets                                    4,164              1,255

Property, plant and equipment                             12,922           13,933

Deferred tax assets                                        1,695              1,665

Other non-current assets                                   1,411            1,502
Non-current assets                                        26,501           21,114

Inventories                                               12,879           11,771

Trade receivables                                          9,859              8,800

Other current assets                                       2,839              3,590

Other current financial assets                             3,146            5,740
Current assets                                            28,723           29,901

TOTAL ASSETS                                              55,224           51,015


Equity attributable to shareholders of AB SKF         ←   18,935      ←    17,411
                                                             ←                 ←
Equity attributable to non-controlling interests          ← 959           ←    869

Long-term financial liabilities                           10,850              8,987

Provisions for post-employment benefits                    7,093              7,020

Provisions for deferred taxes                              2,132               754

Other long-term liabilities and provisions                 1,622            1,599
Non-current liabilities                                   21,697           18,360

Trade payables                                             4,476              3,989

Short-term financial liabilities                           1,325              2,018

Other short-term liabilities and provisions                7,832            8,368
Current liabilities                                       13,633           14,375

TOTAL EQUITY AND LIABILITIES                              55,224           51,015
Page 10 of 19


                                                                                                    Enclosure 4
CONSOLIDATED STATEMENTS OF CASH FLOW (SEKm)

                                                                  Oct-Dec     Oct-Dec    Jan-Dec     Jan-Dec
                                                                    2010        2009        2010        2009
Operating activities:
Operating profit                                                    2,202       1,004      8,452       3,203
Depreciation, amortization and impairment                             539         503      1,992       2,171
Net loss/gain (-) on sales of intangible assets, PPE,
equity securities, businesses and assets held for sale                -30          15         -5          29
Taxes                                                                -511        -227     -1,722      -1,068
Other including financial and non-cash items                         -453         206     -1,950         590
Changes in working capital                                           -489         467     -1,216       3,076
Net cash flow from operations                                       1,258       1,968      5,551       8,001

Investing activities:
Payments in intangible assets, PPE, businesses and
equity securities                                                  -7,239        -532     -8,496      -2,271
Sales of intangible assets, PPE, businesses, assets held
for sale and equity securities                                         15           9        107          22
Net cash flow used in investing activities                         -7,224        -523     -8,389      -2,249
Net cash flow after investments before financing*                  -5,966       1,445     -2,838       5,752

Financing activities:
Change in short- and long-term loans                                3,636      -2,078      2,281      -2,048
Payment of finance lease liabilities                                   -1           0        -11          -6
Cash dividends                                                          0          -1     -1,622      -1,629
Investments in short-term financial assets                           -119        -169       -788      -2,831
Sales of short-term financial assets                                  631       1,441        996       2,461
Net cash flow used in financing activities                          4,147        -807        856      -4,053
NET CASH FLOW                                                      -1,819         638     -1,982       1,699


Change in cash and cash equivalents:
  Cash and cash equivalents at 1 October/1 January                  4,193       3,761      4,430       2,793
  Cash effect excl. acquired businesses                            -2,102         638     -2,265       1,699
  Cash effect of acquired businesses                                  283           0        283           0
  Exchange rate effect                                                 21          31        -53         -62
Cash and cash equivalents at 31 December                            2,395       4,430      2,395       4,430


Change in net interest-              Opening Translation    Cash Businesses              Other non  Closing
bearing liabilities                  balance      effect change   acquired/                   cash balance
                                  1 Jan 2010                           sold               changes   31 Dec
                                                                                                      2010
Loans, long- and short-term             10,750           -1,289     2,281            0          54   11,796
Post-employment benefits, net            6,993             -760      -466          163       1,117    7,047
Financial assets, others                -1,512               76       208           -2         217   -1,013
Cash and cash equivalents               -4,430               53     2,265         -283           0   -2,395
Net interest-bearing
liabilities                            11,801        -1,920         4,288        -122       1,388    15,435


* Adjusted for acquisition of Lincoln Industrial
                                                                   Oct-Dec     Oct-Dec   Jan-Dec     Jan-Dec
                                                                     2010        2009       2010        2009

Net cash flow after investments before financing                     -5,966      1,445     -2,838      5,752
Adjustment for acquisition of Lincoln Industrial                      6,764          0      6,764          0
Net cash flow after investments before financing
after adjustment for acquisition of Lincoln Industrial                 798       1,445      3,926      5,752
Page 11 of 19


                                                                                                                 Enclosure 5
CONSOLIDATED FINANCIAL INFORMATION –
YEARLY AND QUARTERLY COMPARISONS
(SEKm unless otherwise stated)
                                                                              Full                                         Full
                                                                             year                                         year
                                         1/09    2/09     3/09     4/09     2009     1/10     2/10     3/10     4/10     2010

Net sales                              14,849 14,167 13,324 13,887 56,227 14,446 15,709 15,465 15,409 61,029
Cost of goods sold                    -11,844 -11,656 -10,475 -11,049 -45,024 -10,701 -11,336 -11,040 -11,139 -44,216
Gross profit                            3,005 2,511 2,849 2,838 11,203 3,745 4,373 4,425 4,270 16,813

Gross margin, %                           20.2    17.7     21.4     20.4     19.9     25.9     27.8     28.6     27.7     27.5
Selling and administrative
expenses                               -2,219    -2,007   -1,851   -1,838   -7,915   -2,032   -2,128   -2,042   -2,020   -8,222
Other operating income/
expenses - net                             -14      -25     -37        2      -74        -7       -7     -76      -49     -139
Profit/loss from jointly
controlled and associated
companies                                  -4       -5       -4        2       -11      -4        1        2        1        0
Operating profit                          768      474      957    1,004    3,203    1,702    2,239    2,309    2,202    8,452

Operating margin, %                        5.2      3.4      7.2      7.2      5.7    11.8     14.3     14.9     14.3     13.8
Financial income and
expense - net                            -237     -162     -268     -239     -906     -198     -192     -359     -154     -903
Profit before taxes                       531      312      689      765    2,297    1,504    2,047    1,950    2,048    7,549

Profit margin before taxes,%               3.6      2.2      5.2      5.5      4.1     10.4     13.0     12.6     13.3     12.4
Taxes                                    -137        11    -206     -260     -592     -434     -596     -525     -698    -2,253
Net profit                                394      323      483      505    1,705    1,070    1,451    1,425    1,350    5,296

Net profit attributable to
Shareholders of the parent                390      314      462      476    1,642    1,033    1,405    1,389    1,311    5,138
Non-controlling interests                   4        9       21       29       63       37       46       36       39      158


Basic earnings per share, SEK*            0.86    0.69     1.01     1.05     3.61     2.27     3.09     3.05     2.87    11.28

Diluted earnings per share, SEK*          0.86    0.69     1.01     1.05     3.61     2.27     3.09     3.05     2.87    11.28

Dividend per share, SEK                      -    3.50         -        -    3.50         -    3.50         -        -    3.50

Return on capital employed
for the 12-month period, %                18.7    13.4     10.2       9.1      9.1    11.9     16.8     20.7     24.0     24.0

Gearing, %**                              50.1    51.1     52.9     49.3     49.3     48.3     47.4     47.6     48.6     48.6

Equity/assets ratio, %                    35.9    34.6     33.5     35.8     35.8     36.2     36.0     36.0     36.0     36.0

Net worth per share, SEK*                   43      40       36       38       38       38       38       37       42       42

Additions to property, plant
and equipment                             494      442      534      505    1,975      389      433      369      460    1,651

Registered number of employees 43,653 42,422 41,756 41,172 41,172 41,055 41,644 42,475 44,742 44,742

*    Basic and diluted earnings per share and Net worth per share are based on net profit attributable to shareholders
     of the parent.

**   Current- plus non-current loans plus provisions for post-employment benefits, net, as a percentage of the sum of current-
     plus non-current loans, provisions for post-employment benefits, net, and shareholders equity, all at end of interim
     period/year end.
Page 12 of 19


                                                                                                                  Enclosure 6

SEGMENT INFORMATION - YEARLY AND QUARTERLY COMPARISONS**
(SEKm unless otherwise stated)
                                                                                  Full                                       Full
                                                                                 year                                       year
                                            1/09    2/09     3/09        4/09   2009     1/10     2/10    3/10    4/10     2010

     Industrial Division
     Net sales                              5,802   4,844    4,380   4,508 19,534        4,695    4,873   4,952   4,904 19,424
     Sales incl. intra-Group sales          8,187   7,120    6,494   6,745 28,546        7,105    7,514   7,545   7,443 29,607
     Operating profit                        635      344      335        237   1,551      713     909      974     902    3,498
     Operating margin*                      7.8%     4.8%    5.2%        3.5%   5.4%     10.0%   12.1%    12.9%   12.1%    11.8%
     Operating margin excl.
     restructuring*                         8.0%     5.5%    5.7%        6.6%   6.5%     11.2%   12.1%    12.9%   12.1%    12.1%
     Assets and liabilities, net          18,734 17,474 15,948 15,966 15,966 15,511 15,960 14,843 23,392 23,392
     Registered number of
     employees                            19,010 18,616 18,093 17,853 17,853 17,701 17,715 17,882 19,922 19,922

     Service Division
     Net sales                              5,011   4,944    4,636   5,008 19,599        5,093    5,635   5,637   5,664 22,029
     Sales incl. intra-Group sales          5,118   5,028    4,713   5,098 19,957        5,181    5,725   5,739   5,763 22,408
     Operating profit                        598      636      622        729   2,585      647     745      803     841    3,036
     Operating margin*                     11.7%    12.7%   13.2%    14.3%      13.0%    12.5%   13.0%    14.0%   14.6%    13.5%
     Operating margin excl.
     restructuring*                        11.7%    12.9%   13.5%    14.6%      13.1%    12.5%   13.0%    14.0%   14.6%    13.5%
     Assets and liabilities, net            5,471   5,333    4,734   4,819      4,819    5,345    5,650   5,054   5,125    5,125
     Registered number of
     employees                              5,940   5,823    5,761   5,725      5,725    5,731    5,710   5,773   5,832    5,832

     Automotive Division
     Net sales                              3,747   4,126    4,068   4,110 16,051        4,362    4,850   4,528   4,491 18,231
     Sales incl. intra-Group sales          4,555   4,884    4,784   4,880 19,103        5,230    5,825   5,495   5,439 21,989
     Operating profit                        -437    -468       28         92    -785      374     570      470     445    1,859
     Operating margin*                     -9.6%    -9.6%    0.6%        1.9%   -4.1%    7.2%     9.8%    8.5%    8.2%     8.5%
     Operating margin excl.
     restructuring*                        -6.2%    -0.6%    3.7%        5.5%   0.7%     7.2%     9.8%    8.5%    8.2%     8.5%
     Assets and liabilities, net          10,359    9,143    8,177   8,073      8,073    8,437    8,502   7,976   8,034    8,034
     Registered number of
     employees                            14,318 13,744 13,778 13,480 13,480 13,569 14,002 14,399 14,469 14,469

* Operating margin is calculated on sales including intra-Group sales.


Reconciliation to profit before tax for the Group**
                                                                                Jan-Dec 2010              Jan-Dec 2009
 Operating profit:
 Industrial Division                                                                      3,498                    1,551
 Service Division                                                                         3,036                    2,585
 Automotive Division                                                                      1,859                     -785
 Other operations outside the divisions                                                     341                      158

 Unallocated Group activities and adjustments, net                                         -282                     -306

 Financial net                                                                             -903                     -906
 Profit before tax for the Group                                                          7,549                    2,297

**   Previously published amounts have been restated to conform to the current Group structure in 2010. The structural
     changes include business units being moved between the divisions and between other operations/Group activities and
     divisions.
Page 13 of 19


                                                                                   Enclosure 7
PARENT COMPANY INCOME STATEMENTS (SEKm)

                                                 Oct-Dec     Oct-Dec   Jan-Dec       Jan-Dec
                                                   2010         2009      2010          2009
Net sales                                            438         447     1,683         1,623
Cost of services provided                           -438        -447    -1,683        -1,623
Gross profit                                           0           0         0             0

Administrative expenses                              -95         -18       -213        -101
Other operating income/expenses – net                 -2           1        -14           0
Operating loss                                       -97         -17       -227        -101

Financial income and expenses - net                 -68          -68       1,718      2,602
Loss/profit before taxes                           -165          -85       1,491      2,501

Provisions to untaxed reserves                     -178         -145        -178       -145
Taxes                                                68           53         157         99
Net loss/profit                                    -275         -177       1,470      2,455


PARENT COMPANY STATEMENTS of COMPREHENSIVE INCOME (SEKm)

                                                 Oct-Dec     Oct-Dec   Jan-Dec       Jan-Dec
                                                   2010         2009      2010          2009
Net loss/profit                                     -275        -177     1,470         2,455

Other comprehensive income
Available-for-sale assets                           118           76        168         134
Other comprehensive income, net of tax              118           76        168         134

Total comprehensive income                         -157         -101       1,638      2,589


PARENT COMPANY BALANCE SHEETS (SEKm)
                                             N             December 2010      December 2009
                                             o
                                             t
                                             e
Investments in subsidiaries                                       22,255             17,211
Receivables from subsidiaries                                     10,592              8,614
Other non-current assets                                             689                524
Non-current assets                                                33,536             26,349

Receivables from subsidiaries                                      3,285              3,472
Other receivables                                                    154                209
Current assets                                                     3,439              3,681

TOTAL ASSETS                                                      36,975             30,030

Shareholders’ equity                     1                        11,490             10,208
Untaxed reserves                                                   1,417              1,240
Provisions                                                           165                151
Non-current liabilities                                           10,581              8,614
Current liabilities                                               13,322              9,817
TOTAL SHAREHOLDERS’ EQUITY,
PROVISIONS AND LIABILITIES                                        36,975             30,030
Contingent liabilities                                                 5                  5


Note 1. Shareholders’ equity (SEKm)
                                                           December 2010      December 2009
Opening balance 1 January                                         10,208              8,258
Dividends                                                         -1,594             -1,594
Page 14 of 19


Total comprehensive income                                               1,638                  2,589
Exercise of options and cost for share programmes, net                      31                    -11
Group contribution, net                                                  1,207                    966
Closing balance                                                         11,490                 10,208
                                                                                            Enclosure 8
Acquisition of Lincoln Industrial
On 28 December 2010 the Group acquired 100% of the shares of Lincoln Holdings Enterprises, Inc
(Lincoln Industrial) from Harbour Group. Lincoln Industrial is a leader in the design, manufacture
and supply of highly engineered lubrication systems, tools and equipment, and is headquartered in
St. Louis, Missouri, USA.
Lincoln Industrial’s three main product lines are automated lubrication systems, hose reels, and
grease guns, with a focus on grease-based systems. Sales are mainly generated from automated
lubrication systems and related products. Major end markets include industrial, energy, off-
highway, mining, agriculture, and steel. The company has a global footprint with around 50% of its
sales generated in North America, 25% in Europe and 20% in Asia Pacific. The company has
around 2,000 employees with manufacturing operations in the US, Asia and Europe.
Lincoln Industrial will be part of a newly created business unit for lubrication systems within SKF’s
Industrial Division. The acquisition of Lincoln Industrial is in line with SKF’s strategy and builds on
a series of acquisitions made in the lubrication systems sector over the last six years. Lincoln
Industrial is highly complementary to SKF’s existing lubrication systems business, with limited
product and geographical overlap. The acquisition furthers SKF’s strategy including:
    •    improving the lubrication systems platform through Lincoln Industrial’s complementary
         product portfolio.
    •    increasing the geographical sales coverage in North America and Asia.
    •    expanding the business to the automotive aftermarket in the US.
    •    expanding the manufacturing operations through Lincoln Industrial’s strong US and Asian
         manufacturing footprint.
SKF expects to achieve significant synergies from the combination through improved sales
opportunities and greater efficiencies.
Lincoln Industrial is included in the Group’s balance sheet at 31 December 2010, with no impact on
the Group’s income statement for the year 2010. Their results will be included in the Group’s
income statement as from 1 January 2011.
A preliminary allocation of the acquisition cost to the identifiable assets acquired and liabilities
assumed (net assets) was made. All allocations are only preliminary and are expected to be
finalized in Q2 2011 pending the final audit and asset valuations. The preliminary values are as
follows:


            Fair value of net assets acquired (SEKm):
              Trademarks                                           1,020
              Customer relationships                               1,836
              Other intangibles                                      287
              Plant, property and equipment                          358
              Receivables                                            441
              Inventory                                              648
              Other assets                                           300
              Deferred tax provisions                             -1,225
              Post-employment benefits                              -163
              Other liabilities                                     -344
                                                                   3,158
               Goodwill                                            3,889
               Total acquisition cost                              7,047

               Cash and cash equivalents acquired                   -283
               Cash outflow                                        6,764
Page 15 of 19


The acquisition cost is subject only to adjustments for the final audited cash, working capital, and
indebtedness levels. The acquisition was paid using existing cash and credit facilities. Acquisition
related-costs of SEK 99 million were expensed, of which SEK 80 million was included as Other
operating expense and SEK 19 million was included as Selling expense in the Group’s income
statement.
Receivables arise from the normal course of business and include an allowance for uncollectibilty of
approximately SEK 16 million.
The acquisition of Lincoln Industrial included all Lincoln, Alemite and Reelcraft entities and brands.
Consequently the opening balances include a preliminary valuation of trademarks of SEK 1,020
million, which the Group considers to have indefinite useful lives, as it is intended to continue to
promote these brands in the foreseeable future. Preliminary values were allocated to other
significant intangibles which included customer relationships to be amortized over an expected life
of 15 years.
None of the goodwill is expected to be deductible for tax purposes. The preliminary goodwill arises
due to Lincoln Industrial’s expected ability to continuously renew its technology resulting in
improved sales opportunities as well as their ability to deliver strong financial performance on a
consistent basis.


Proforma net sales and net profit
Had Lincoln Industrial been acquired at 1 January 2010, the consolidated revenue for the Group
would have amounted to SEK 63,858 million, and consolidated net profit would have been SEK
5,509 million. This unaudited proforma information adds Lincoln Industrial’s income statement
excluding their acquisition-related costs and financing costs, and adjusts for the additional
amortizations, depreciations, and inventory costs arising from the fair value adjustment.
Additionally, net financial costs were adjusted to reflect the change in the Group’s net interest
bearing liabilities caused by the payment of the purchase price. Income taxes have been included
in all proforma adjustments.

Weitere ähnliche Inhalte

Was ist angesagt?

First quarter 2010
First quarter 2010First quarter 2010
First quarter 2010EDB
 
credit suisse Letter to shareholders Q1/2005
credit suisse Letter to shareholders Q1/2005credit suisse Letter to shareholders Q1/2005
credit suisse Letter to shareholders Q1/2005QuarterlyEarningsReports2
 
Ptc 2 qfy2011 281010-291010
Ptc   2 qfy2011 281010-291010Ptc   2 qfy2011 281010-291010
Ptc 2 qfy2011 281010-291010Angel Broking
 
Financial statements andreview, 4thquarter 2010
Financial statements andreview, 4thquarter 2010Financial statements andreview, 4thquarter 2010
Financial statements andreview, 4thquarter 2010Statoilasa
 
SAIL Financial Analysis
SAIL Financial Analysis SAIL Financial Analysis
SAIL Financial Analysis Ajay G S
 
Ntpc 2 qfy11 result update - 271010
Ntpc   2 qfy11 result update - 271010Ntpc   2 qfy11 result update - 271010
Ntpc 2 qfy11 result update - 271010Angel Broking
 
AkzoNobel Q4 2011 Results Investor Update Presentation
AkzoNobel Q4 2011 Results Investor Update PresentationAkzoNobel Q4 2011 Results Investor Update Presentation
AkzoNobel Q4 2011 Results Investor Update PresentationAkzoNobel
 
Monthly Corporate Analysis PowerPoint Presentation Slides
Monthly Corporate Analysis PowerPoint Presentation SlidesMonthly Corporate Analysis PowerPoint Presentation Slides
Monthly Corporate Analysis PowerPoint Presentation SlidesSlideTeam
 
Kemira Interim Report Q3/2011 result presentation
Kemira Interim Report Q3/2011 result presentationKemira Interim Report Q3/2011 result presentation
Kemira Interim Report Q3/2011 result presentationKemira Oyj
 
Buy DB Corp at a target of Rs410
Buy DB Corp at a target of Rs410Buy DB Corp at a target of Rs410
Buy DB Corp at a target of Rs410IndiaNotes.com
 
Cdon group Q1 2013 and rights issue presentation
Cdon group Q1 2013 and rights issue presentationCdon group Q1 2013 and rights issue presentation
Cdon group Q1 2013 and rights issue presentationQliro Group AB
 
Preliminary Accounts Q4 2012 SpareBank 1 Gruppen AS
Preliminary Accounts Q4 2012 SpareBank 1 Gruppen ASPreliminary Accounts Q4 2012 SpareBank 1 Gruppen AS
Preliminary Accounts Q4 2012 SpareBank 1 Gruppen ASSpareBank 1 Gruppen AS
 
SKF First-quarter 2011 result slide show
SKF First-quarter 2011 result slide show SKF First-quarter 2011 result slide show
SKF First-quarter 2011 result slide show SKF
 
ConAgra QAFY06Q2
ConAgra QAFY06Q2ConAgra QAFY06Q2
ConAgra QAFY06Q2finance21
 
Metso Corporation Interim Review January - March 2012 presentation
Metso Corporation Interim Review January - March 2012 presentationMetso Corporation Interim Review January - March 2012 presentation
Metso Corporation Interim Review January - March 2012 presentationMetso Group
 
Presentation Financial Results Q3 - 2012 SpareBank 1 Gruppen AS
Presentation Financial Results Q3 - 2012 SpareBank 1 Gruppen ASPresentation Financial Results Q3 - 2012 SpareBank 1 Gruppen AS
Presentation Financial Results Q3 - 2012 SpareBank 1 Gruppen ASSpareBank 1 Gruppen AS
 

Was ist angesagt? (19)

First quarter 2010
First quarter 2010First quarter 2010
First quarter 2010
 
credit suisse Letter to shareholders Q1/2005
credit suisse Letter to shareholders Q1/2005credit suisse Letter to shareholders Q1/2005
credit suisse Letter to shareholders Q1/2005
 
Ptc 2 qfy2011 281010-291010
Ptc   2 qfy2011 281010-291010Ptc   2 qfy2011 281010-291010
Ptc 2 qfy2011 281010-291010
 
Financial statements andreview, 4thquarter 2010
Financial statements andreview, 4thquarter 2010Financial statements andreview, 4thquarter 2010
Financial statements andreview, 4thquarter 2010
 
SAIL Financial Analysis
SAIL Financial Analysis SAIL Financial Analysis
SAIL Financial Analysis
 
Ntpc 2 qfy11 result update - 271010
Ntpc   2 qfy11 result update - 271010Ntpc   2 qfy11 result update - 271010
Ntpc 2 qfy11 result update - 271010
 
Hexaware -press_release_february_16,_2011
Hexaware  -press_release_february_16,_2011Hexaware  -press_release_february_16,_2011
Hexaware -press_release_february_16,_2011
 
AkzoNobel Q4 2011 Results Investor Update Presentation
AkzoNobel Q4 2011 Results Investor Update PresentationAkzoNobel Q4 2011 Results Investor Update Presentation
AkzoNobel Q4 2011 Results Investor Update Presentation
 
Monthly Corporate Analysis PowerPoint Presentation Slides
Monthly Corporate Analysis PowerPoint Presentation SlidesMonthly Corporate Analysis PowerPoint Presentation Slides
Monthly Corporate Analysis PowerPoint Presentation Slides
 
Kemira Interim Report Q3/2011 result presentation
Kemira Interim Report Q3/2011 result presentationKemira Interim Report Q3/2011 result presentation
Kemira Interim Report Q3/2011 result presentation
 
Buy DB Corp at a target of Rs410
Buy DB Corp at a target of Rs410Buy DB Corp at a target of Rs410
Buy DB Corp at a target of Rs410
 
Cdon group Q1 2013 and rights issue presentation
Cdon group Q1 2013 and rights issue presentationCdon group Q1 2013 and rights issue presentation
Cdon group Q1 2013 and rights issue presentation
 
BCG_BUY_05032016_Final
BCG_BUY_05032016_FinalBCG_BUY_05032016_Final
BCG_BUY_05032016_Final
 
Preliminary Accounts Q4 2012 SpareBank 1 Gruppen AS
Preliminary Accounts Q4 2012 SpareBank 1 Gruppen ASPreliminary Accounts Q4 2012 SpareBank 1 Gruppen AS
Preliminary Accounts Q4 2012 SpareBank 1 Gruppen AS
 
SKF First-quarter 2011 result slide show
SKF First-quarter 2011 result slide show SKF First-quarter 2011 result slide show
SKF First-quarter 2011 result slide show
 
ConAgra QAFY06Q2
ConAgra QAFY06Q2ConAgra QAFY06Q2
ConAgra QAFY06Q2
 
Metso Corporation Interim Review January - March 2012 presentation
Metso Corporation Interim Review January - March 2012 presentationMetso Corporation Interim Review January - March 2012 presentation
Metso Corporation Interim Review January - March 2012 presentation
 
Presentation Financial Results Q3 - 2012 SpareBank 1 Gruppen AS
Presentation Financial Results Q3 - 2012 SpareBank 1 Gruppen ASPresentation Financial Results Q3 - 2012 SpareBank 1 Gruppen AS
Presentation Financial Results Q3 - 2012 SpareBank 1 Gruppen AS
 
Q2 2011 presentation
Q2 2011 presentationQ2 2011 presentation
Q2 2011 presentation
 

Andere mochten auch

Indonesian Basic Training Juni 2009
Indonesian Basic Training Juni 2009Indonesian Basic Training Juni 2009
Indonesian Basic Training Juni 2009'Davy Hermanus
 
Small Business Future Tech
Small Business Future TechSmall Business Future Tech
Small Business Future Techcomptroublv
 
Bioremediation of Chlorobenzenes
Bioremediation of ChlorobenzenesBioremediation of Chlorobenzenes
Bioremediation of ChlorobenzenesTurlough Guerin
 
Eagle Mountain Utah Silver Lake Stake Fireside Slides
Eagle Mountain Utah Silver Lake Stake Fireside SlidesEagle Mountain Utah Silver Lake Stake Fireside Slides
Eagle Mountain Utah Silver Lake Stake Fireside SlidesSteve Davis
 
1. student resume writing
1. student resume writing1. student resume writing
1. student resume writingSalib Lakchiri
 
Skf q3 2010_pr_sv
Skf q3 2010_pr_svSkf q3 2010_pr_sv
Skf q3 2010_pr_svSKF
 
Applying For Federal Jobs Slide Show101309
Applying For Federal Jobs Slide Show101309Applying For Federal Jobs Slide Show101309
Applying For Federal Jobs Slide Show101309BBrowne
 
The Philosophy Of T
The Philosophy Of TThe Philosophy Of T
The Philosophy Of Ttdutton
 
人人-56 账号拆分项目总结
人人-56 账号拆分项目总结人人-56 账号拆分项目总结
人人-56 账号拆分项目总结Ho Kim
 
Lua 30+ Programming Skills and 20+ Optimization Tips
Lua 30+ Programming Skills and 20+ Optimization TipsLua 30+ Programming Skills and 20+ Optimization Tips
Lua 30+ Programming Skills and 20+ Optimization TipsHo Kim
 
Ser libre
Ser libreSer libre
Ser librearukk
 
Skf q3 2011_presentation
Skf q3 2011_presentationSkf q3 2011_presentation
Skf q3 2011_presentationSKF
 
The Carbon Conversation, February 2010: Carbon Voyage
The Carbon Conversation, February 2010: Carbon VoyageThe Carbon Conversation, February 2010: Carbon Voyage
The Carbon Conversation, February 2010: Carbon VoyageEmily Wearmouth
 
6 A CALIFICACIONES SEMESTRALES
6 A CALIFICACIONES SEMESTRALES6 A CALIFICACIONES SEMESTRALES
6 A CALIFICACIONES SEMESTRALESMaru Reyes
 

Andere mochten auch (20)

Brochure Graphic Production
Brochure Graphic Production Brochure Graphic Production
Brochure Graphic Production
 
Indonesian Basic Training Juni 2009
Indonesian Basic Training Juni 2009Indonesian Basic Training Juni 2009
Indonesian Basic Training Juni 2009
 
Small Business Future Tech
Small Business Future TechSmall Business Future Tech
Small Business Future Tech
 
Bioremediation of Chlorobenzenes
Bioremediation of ChlorobenzenesBioremediation of Chlorobenzenes
Bioremediation of Chlorobenzenes
 
Eagle Mountain Utah Silver Lake Stake Fireside Slides
Eagle Mountain Utah Silver Lake Stake Fireside SlidesEagle Mountain Utah Silver Lake Stake Fireside Slides
Eagle Mountain Utah Silver Lake Stake Fireside Slides
 
1. student resume writing
1. student resume writing1. student resume writing
1. student resume writing
 
Skf q3 2010_pr_sv
Skf q3 2010_pr_svSkf q3 2010_pr_sv
Skf q3 2010_pr_sv
 
Applying For Federal Jobs Slide Show101309
Applying For Federal Jobs Slide Show101309Applying For Federal Jobs Slide Show101309
Applying For Federal Jobs Slide Show101309
 
The Philosophy Of T
The Philosophy Of TThe Philosophy Of T
The Philosophy Of T
 
人人-56 账号拆分项目总结
人人-56 账号拆分项目总结人人-56 账号拆分项目总结
人人-56 账号拆分项目总结
 
Daily activities
Daily activitiesDaily activities
Daily activities
 
Reflexology
ReflexologyReflexology
Reflexology
 
Lua 30+ Programming Skills and 20+ Optimization Tips
Lua 30+ Programming Skills and 20+ Optimization TipsLua 30+ Programming Skills and 20+ Optimization Tips
Lua 30+ Programming Skills and 20+ Optimization Tips
 
Ser libre
Ser libreSer libre
Ser libre
 
Skf q3 2011_presentation
Skf q3 2011_presentationSkf q3 2011_presentation
Skf q3 2011_presentation
 
Secrets of the Bible
Secrets of the BibleSecrets of the Bible
Secrets of the Bible
 
The Carbon Conversation, February 2010: Carbon Voyage
The Carbon Conversation, February 2010: Carbon VoyageThe Carbon Conversation, February 2010: Carbon Voyage
The Carbon Conversation, February 2010: Carbon Voyage
 
6 A CALIFICACIONES SEMESTRALES
6 A CALIFICACIONES SEMESTRALES6 A CALIFICACIONES SEMESTRALES
6 A CALIFICACIONES SEMESTRALES
 
Nd
NdNd
Nd
 
Brochure Web Design
Brochure Web DesignBrochure Web Design
Brochure Web Design
 

Ähnlich wie Skf q4 2010_pr_eng

Skf half year-2010
Skf half year-2010Skf half year-2010
Skf half year-2010SKF
 
First quarter 2010
First quarter 2010First quarter 2010
First quarter 2010SKF
 
SKF First-quarter report 2009
SKF First-quarter report 2009SKF First-quarter report 2009
SKF First-quarter report 2009SKF
 
Q1 2009 eng
Q1 2009 engQ1 2009 eng
Q1 2009 engSKF
 
Présentation des résultats financiers Ericsson (Q4 2009)
Présentation des résultats financiers Ericsson (Q4 2009)Présentation des résultats financiers Ericsson (Q4 2009)
Présentation des résultats financiers Ericsson (Q4 2009)Ericsson France
 
Financial_Highlights_FY20214Q.pdf
Financial_Highlights_FY20214Q.pdfFinancial_Highlights_FY20214Q.pdf
Financial_Highlights_FY20214Q.pdfRicohLease
 
Metso Financial Statements Review 2012
Metso Financial Statements Review 2012Metso Financial Statements Review 2012
Metso Financial Statements Review 2012Metso Group
 
Cccl ru2 qfy2011-281010
Cccl ru2 qfy2011-281010Cccl ru2 qfy2011-281010
Cccl ru2 qfy2011-281010Angel Broking
 
CDON Group Q2 2013 presentation
CDON Group Q2 2013 presentationCDON Group Q2 2013 presentation
CDON Group Q2 2013 presentationQliro Group AB
 
Results presentation q3 2015
Results presentation q3 2015Results presentation q3 2015
Results presentation q3 2015SpondaPlc
 
Bajaj electricals ru2 qfy2011-271010
Bajaj electricals ru2 qfy2011-271010Bajaj electricals ru2 qfy2011-271010
Bajaj electricals ru2 qfy2011-271010Angel Broking
 
AT&S Annual Report 2015/16
AT&S Annual Report 2015/16AT&S Annual Report 2015/16
AT&S Annual Report 2015/16AT&S_IR
 
Finolex cables ru2 qfy2011-251010
Finolex cables ru2 qfy2011-251010Finolex cables ru2 qfy2011-251010
Finolex cables ru2 qfy2011-251010Angel Broking
 
AT&S Annual Report 2011/12
AT&S Annual Report 2011/12AT&S Annual Report 2011/12
AT&S Annual Report 2011/12AT&S_IR
 
Bosch 3 qcy2010ru-281010
Bosch 3 qcy2010ru-281010Bosch 3 qcy2010ru-281010
Bosch 3 qcy2010ru-281010Angel Broking
 
DS Smith results 2010_11
DS Smith results 2010_11DS Smith results 2010_11
DS Smith results 2010_11Eddy Priem
 
AT&S Quarterly Financial Report Q1 2018/19
AT&S Quarterly Financial Report Q1 2018/19AT&S Quarterly Financial Report Q1 2018/19
AT&S Quarterly Financial Report Q1 2018/19AT&S_IR
 
Motherson Sumi Systems - Result Update
Motherson Sumi Systems - Result UpdateMotherson Sumi Systems - Result Update
Motherson Sumi Systems - Result UpdateAngel Broking
 

Ähnlich wie Skf q4 2010_pr_eng (20)

Skf half year-2010
Skf half year-2010Skf half year-2010
Skf half year-2010
 
First quarter 2010
First quarter 2010First quarter 2010
First quarter 2010
 
SKF First-quarter report 2009
SKF First-quarter report 2009SKF First-quarter report 2009
SKF First-quarter report 2009
 
Q1 2009 eng
Q1 2009 engQ1 2009 eng
Q1 2009 eng
 
Bucher 2012 Interim Report
Bucher 2012 Interim ReportBucher 2012 Interim Report
Bucher 2012 Interim Report
 
Présentation des résultats financiers Ericsson (Q4 2009)
Présentation des résultats financiers Ericsson (Q4 2009)Présentation des résultats financiers Ericsson (Q4 2009)
Présentation des résultats financiers Ericsson (Q4 2009)
 
Piaggio Group - First Quarter 2012 Financial Results
Piaggio Group - First Quarter 2012 Financial ResultsPiaggio Group - First Quarter 2012 Financial Results
Piaggio Group - First Quarter 2012 Financial Results
 
Financial_Highlights_FY20214Q.pdf
Financial_Highlights_FY20214Q.pdfFinancial_Highlights_FY20214Q.pdf
Financial_Highlights_FY20214Q.pdf
 
Metso Financial Statements Review 2012
Metso Financial Statements Review 2012Metso Financial Statements Review 2012
Metso Financial Statements Review 2012
 
Cccl ru2 qfy2011-281010
Cccl ru2 qfy2011-281010Cccl ru2 qfy2011-281010
Cccl ru2 qfy2011-281010
 
CDON Group Q2 2013 presentation
CDON Group Q2 2013 presentationCDON Group Q2 2013 presentation
CDON Group Q2 2013 presentation
 
Results presentation q3 2015
Results presentation q3 2015Results presentation q3 2015
Results presentation q3 2015
 
Bajaj electricals ru2 qfy2011-271010
Bajaj electricals ru2 qfy2011-271010Bajaj electricals ru2 qfy2011-271010
Bajaj electricals ru2 qfy2011-271010
 
AT&S Annual Report 2015/16
AT&S Annual Report 2015/16AT&S Annual Report 2015/16
AT&S Annual Report 2015/16
 
Finolex cables ru2 qfy2011-251010
Finolex cables ru2 qfy2011-251010Finolex cables ru2 qfy2011-251010
Finolex cables ru2 qfy2011-251010
 
AT&S Annual Report 2011/12
AT&S Annual Report 2011/12AT&S Annual Report 2011/12
AT&S Annual Report 2011/12
 
Bosch 3 qcy2010ru-281010
Bosch 3 qcy2010ru-281010Bosch 3 qcy2010ru-281010
Bosch 3 qcy2010ru-281010
 
DS Smith results 2010_11
DS Smith results 2010_11DS Smith results 2010_11
DS Smith results 2010_11
 
AT&S Quarterly Financial Report Q1 2018/19
AT&S Quarterly Financial Report Q1 2018/19AT&S Quarterly Financial Report Q1 2018/19
AT&S Quarterly Financial Report Q1 2018/19
 
Motherson Sumi Systems - Result Update
Motherson Sumi Systems - Result UpdateMotherson Sumi Systems - Result Update
Motherson Sumi Systems - Result Update
 

Mehr von SKF

Skf group presentation 120126
Skf group presentation 120126Skf group presentation 120126
Skf group presentation 120126SKF
 
Acquisition criteria 120804
Acquisition criteria 120804Acquisition criteria 120804
Acquisition criteria 120804SKF
 
Skf q1 2012_presentation
Skf q1 2012_presentationSkf q1 2012_presentation
Skf q1 2012_presentationSKF
 
Skf group presentation_120126
Skf group presentation_120126Skf group presentation_120126
Skf group presentation_120126SKF
 
Skf q4 2011_presentation
Skf q4 2011_presentationSkf q4 2011_presentation
Skf q4 2011_presentationSKF
 
Skf q2 2011_presentation
Skf q2 2011_presentationSkf q2 2011_presentation
Skf q2 2011_presentationSKF
 
Acquisition criteria 110510
Acquisition criteria 110510Acquisition criteria 110510
Acquisition criteria 110510SKF
 
Acquisition criteria 110510
Acquisition criteria 110510Acquisition criteria 110510
Acquisition criteria 110510SKF
 
Acquisition criteria 110510
Acquisition criteria 110510Acquisition criteria 110510
Acquisition criteria 110510SKF
 
SKF First-quarter 2011 report
SKF First-quarter 2011 reportSKF First-quarter 2011 report
SKF First-quarter 2011 reportSKF
 
Skf diagram
Skf diagramSkf diagram
Skf diagramSKF
 
Skf q42010 presentation
Skf q42010 presentationSkf q42010 presentation
Skf q42010 presentationSKF
 
Skf q4 2010_pr_sv
Skf q4 2010_pr_svSkf q4 2010_pr_sv
Skf q4 2010_pr_svSKF
 
Q32010 debt
Q32010 debtQ32010 debt
Q32010 debtSKF
 
Skf q3 2010_presentation
Skf q3 2010_presentationSkf q3 2010_presentation
Skf q3 2010_presentationSKF
 
Skf internet presentation_q22010
Skf internet presentation_q22010Skf internet presentation_q22010
Skf internet presentation_q22010SKF
 
Skf half year-2010_sv
Skf half year-2010_svSkf half year-2010_sv
Skf half year-2010_svSKF
 
Skf solid debt_structure_100701
Skf solid debt_structure_100701Skf solid debt_structure_100701
Skf solid debt_structure_100701SKF
 
I korthet a4_e4
I korthet a4_e4I korthet a4_e4
I korthet a4_e4SKF
 
I korthet a4_s3
I korthet a4_s3I korthet a4_s3
I korthet a4_s3SKF
 

Mehr von SKF (20)

Skf group presentation 120126
Skf group presentation 120126Skf group presentation 120126
Skf group presentation 120126
 
Acquisition criteria 120804
Acquisition criteria 120804Acquisition criteria 120804
Acquisition criteria 120804
 
Skf q1 2012_presentation
Skf q1 2012_presentationSkf q1 2012_presentation
Skf q1 2012_presentation
 
Skf group presentation_120126
Skf group presentation_120126Skf group presentation_120126
Skf group presentation_120126
 
Skf q4 2011_presentation
Skf q4 2011_presentationSkf q4 2011_presentation
Skf q4 2011_presentation
 
Skf q2 2011_presentation
Skf q2 2011_presentationSkf q2 2011_presentation
Skf q2 2011_presentation
 
Acquisition criteria 110510
Acquisition criteria 110510Acquisition criteria 110510
Acquisition criteria 110510
 
Acquisition criteria 110510
Acquisition criteria 110510Acquisition criteria 110510
Acquisition criteria 110510
 
Acquisition criteria 110510
Acquisition criteria 110510Acquisition criteria 110510
Acquisition criteria 110510
 
SKF First-quarter 2011 report
SKF First-quarter 2011 reportSKF First-quarter 2011 report
SKF First-quarter 2011 report
 
Skf diagram
Skf diagramSkf diagram
Skf diagram
 
Skf q42010 presentation
Skf q42010 presentationSkf q42010 presentation
Skf q42010 presentation
 
Skf q4 2010_pr_sv
Skf q4 2010_pr_svSkf q4 2010_pr_sv
Skf q4 2010_pr_sv
 
Q32010 debt
Q32010 debtQ32010 debt
Q32010 debt
 
Skf q3 2010_presentation
Skf q3 2010_presentationSkf q3 2010_presentation
Skf q3 2010_presentation
 
Skf internet presentation_q22010
Skf internet presentation_q22010Skf internet presentation_q22010
Skf internet presentation_q22010
 
Skf half year-2010_sv
Skf half year-2010_svSkf half year-2010_sv
Skf half year-2010_sv
 
Skf solid debt_structure_100701
Skf solid debt_structure_100701Skf solid debt_structure_100701
Skf solid debt_structure_100701
 
I korthet a4_e4
I korthet a4_e4I korthet a4_e4
I korthet a4_e4
 
I korthet a4_s3
I korthet a4_s3I korthet a4_s3
I korthet a4_s3
 

Skf q4 2010_pr_eng

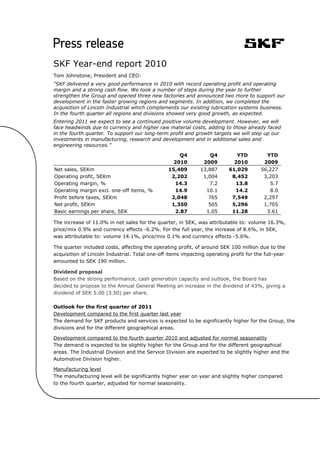
  • 1. SKF Year-end report 2010 Tom Johnstone, President and CEO: "SKF delivered a very good performance in 2010 with record operating profit and operating margin and a strong cash flow. We took a number of steps during the year to further strengthen the Group and opened three new factories and announced two more to support our development in the faster growing regions and segments. In addition, we completed the acquisition of Lincoln Industrial which complements our existing lubrication systems business. In the fourth quarter all regions and divisions showed very good growth, as expected. Entering 2011 we expect to see a continued positive volume development. However, we will face headwinds due to currency and higher raw material costs, adding to those already faced in the fourth quarter. To support our long-term profit and growth targets we will step up our investments in manufacturing, research and development and in additional sales and engineering resources.” Q4 Q4 YTD YTD 2010 2009 2010 2009 Net sales, SEKm 15,409 13,887 61,029 56,227 Operating profit, SEKm 2,202 1,004 8,452 3,203 Operating margin, % 14.3 7.2 13.8 5.7 Operating margin excl. one-off items, % 14.9 10.1 14.2 8.0 Profit before taxes, SEKm 2,048 765 7,549 2,297 Net profit, SEKm 1,350 505 5,296 1,705 Basic earnings per share, SEK 2.87 1.05 11.28 3.61 The increase of 11.0% in net sales for the quarter, in SEK, was attributable to: volume 16.3%, price/mix 0.9% and currency effects -6.2%. For the full year, the increase of 8.6%, in SEK, was attributable to: volume 14.1%, price/mix 0.1% and currency effects -5.6%. The quarter included costs, affecting the operating profit, of around SEK 100 million due to the acquisition of Lincoln Industrial. Total one-off items impacting operating profit for the full-year amounted to SEK 190 million. Dividend proposal Based on the strong performance, cash generation capacity and outlook, the Board has decided to propose to the Annual General Meeting an increase in the dividend of 43%, giving a dividend of SEK 5.00 (3.50) per share. Outlook for the first quarter of 2011 Development compared to the first quarter last year The demand for SKF products and services is expected to be significantly higher for the Group, the divisions and for the different geographical areas. Development compared to the fourth quarter 2010 and adjusted for normal seasonality The demand is expected to be slightly higher for the Group and for the different geographical areas. The Industrial Division and the Service Division are expected to be slightly higher and the Automotive Division higher. Manufacturing level The manufacturing level will be significantly higher year on year and slightly higher compared to the fourth quarter, adjusted for normal seasonality.
  • 2. Development in the fourth quarter compared to the same period last year Sales in local currencies were significantly higher for the Group, for Europe, North America, Latin America and Asia as well as for the divisions. The manufacturing level was significantly higher than in the fourth quarter last year. Financial 31 December 30 September 31 December Key figures 2010 2010 2009 Inventories, % of annual sales 21.1 20.2 20.9 ROCE for the 12-month period, % 24.0 20.7 9.1 ROE for the 12-month period, % 28.4 24.3 9.0 Equity/assets ratio, % 36.0 36.0 35.8 Gearing, % 48.6 47.6 49.3 Net debt/equity, % 80.5 61.5 68.9 Registered number of employees 44,742 42,475 41,172 The SKF Group’s balance sheet and key figures above are impacted by the inclusion of Lincoln Industrial’s preliminary balance sheet. Excluding Lincoln Industrial, inventories were 20.0% and the number of employees was 42,735. The total purchase price for Lincoln Industrial was SEK 7,047 million, and the cash outflow was SEK 6,764 million. Cash flow, after investments and before financing, was SEK -5,966 million (1,445) for the fourth quarter and SEK -2,838 million (5,752) for the full year 2010. Excluding the acquisition of Lincoln Industrial it was SEK 798 million for the fourth quarter and SEK 3,926 million for the full year. The financial net in the fourth quarter of 2010 was SEK -154 million (-239), for the full year it was SEK -903 million (-906). The full-year figure has a negative effect of SEK 225 million relating to a loss on the Ovako vendor note. Exchange rates, the effects of translation and transaction flows, had a negative effect of SEK 50 million on SKF’s operating profit in the fourth quarter and a negative effect of around SEK 400 million for the full year, compared to the corresponding period last year. It is estimated that there will be a negative effect of SEK 150 million on operating profit in the first quarter and for the full year a negative effect of SEK 900 million, based on current assumptions and exchange rates and compared to the corresponding period last year. R&D expenditure was SEK 1,184 million (1,217), corresponding to 1.9% (2.2) of annual sales, excluding developing IT solutions. The number of first filings of patent applications was 251 (218). SKF’s Performance Share Programme 2011 In order to continue to link the interests of the senior management and the shareholders, the Board proposes that a decision be taken at the Annual General Meeting in April 2011 on SKF’s Performance Share Programme 2011. The terms and conditions of the proposed SKF’s Performance Share Programme 2011 are in essence the same as the terms and conditions of the programmes for 2008, 2009 and 2010.
  • 3. It is proposed that the programme covers a maximum of 310 senior managers and key employees in the SKF Group, including Group Management, with the opportunity of being allotted, free of charge, SKF class B shares. The number of shares that may be allotted must be related to the degree of achievement of financial targets defined by the Board of Directors in accordance with the SKF Group’s TVA management model and must pertain to the period commencing 2011 up to and including 2013. Under the programme, no more than 1,000,000 class B shares may be allotted. The Performance Share programme 2008, which was decided by the AGM on April 16, 2008 will be settled in the first quarter 2011. The outcome is that about 250 managers of the SKF Group will receive around 117,000 SKF class B shares (around 12% of maximum) amounting to around SEK 25 million including social charges. The year in brief The Group’s ongoing cost reduction activities, combined with the improved volumes both in sales and manufacturing and the continued implementation of the Group’s strategy, had a very positive effect on the Group’s operating profit and resulted in a record operating profit and operating margin for the Group. The steps taken in recent years to make the company more robust is giving results which can be seen by the very positive development in 2010 and the resilient performance in 2009. As a result of the strong performance and the strategy for the SKF Group new long-term financial targets were announced in October 2010. The new targets are to have an operating margin level of 15%, annual sales growth in local currencies of 8% and a return on capital employed of 27%. The inventory target of 18% of net sales remain. The main initiatives going forward to support the strategy and targets will be to accelerate profitable growth, to reduce costs and eliminate waste and to invest for growth. Three new factories were opened during the year, two in India, at Haridwar and Ahmedabad, and one in Russia at Tver. These factories are built to the LEED (Leadership in Energy and Environmental Design) or equivalent standard as with all new SKF facilities. SKF also announced the construction of two new factories which will open in late 2011. A new seals factory is under construction in Mysore, India and a bearing factory is being established in Dalian, China to produce medium-sized bearings for the industrial market. SKF continued to open new SKF Solution Factories throughout the year with nine being opened, bringing the total at the end of 2010 to 17. These SKF Solution Factories gather SKF’s expertise under one roof and are already proving beneficial for customers and distributors by making SKF’s knowledge more readily accessible to them. To support the development in Asia, SKF opened a new Global Technical Centre in China to complement the centre opened in India in 2009. These new Global Technical Centres will be an integral part of the SKF Group’s global technology network and will bring new product development closer to SKF’s customers in this rapidly developing region. Acquisition of Lincoln Industrial (see separate press release dated 23 December 2010) SKF’s acquisition of Lincoln Holding Enterprises (Lincoln Industrial), a leading supplier of lubrication systems and tools was completed at the end of the year. Lincoln Industrial, headquartered in St. Louis, Missouri, USA has about 2,000 employees and generated sales of around USD 400 million in 2010 with an operating margin of around 24%.
  • 4. The acquisition is in line with SKF’s strategy to grow the lubrication systems market. Lincoln Industrial is highly complementary to SKF’s existing lubrication system business when it comes to geographical sales coverage, technology and manufacturing footprint, in particular in North America and Asia. In addition, Lincoln Industrial provides SKF with improved access to the lubrication tools and equipment aftermarket in North America.
  • 5. Page 1 of 19 Lincoln Industrial is included in the Group’s balance sheet at year-end 2010 with preliminary opening balances, as follows: Fair value of net assets acquired (SEKm): Intangibles assets 7,032 Operating assets 1,747 Other liabilities -1,732 Total purchase price 7,047 Cash and cash equivalents acquired -283 Cash outflow 6,764 Lincoln Industrial’s income statement will be included in the Group from the first-quarter results of 2011, as part of a newly created business unit for lubrication systems within SKF Industrial Division. Based on the preliminary opening balances, annual amortization and depreciation together are expected to be slightly below USD 25 million for acquired intangibles and plant, property and equipment after fair value adjustments. The operating profit will be negatively impacted primarily in the first quarter by around USD 15 million, representing the fair value adjustment on inventories as part of opening balances for Lincoln Industrial. Please see enclosure 8 for more information about the acquisition of Lincoln Industrial. Divestment subsequent to year end SKF divested its forging business, Officine Meccaniche Villar Perosa SpA (OMVP), in Villar Perosa, Italy to the German based company Neumayer Tekfor Holding GmbH, one of the largest forging companies in Europe. The sale is fully in line with the SKF’s strategy to divest non-core component manufacturing and will have a limited impact on the results and cash flow. OMVP has about 550 employees and net sales of around EUR 100 million, mainly to other SKF operations. The parties have agreed on continuing the supply and strengthening the cooperation. Divisions Comments on sales are based on local currencies and compared to the corresponding period for 2009. The operating margin has been calculated on sales including intra-Group sales. Industrial Division The operating profit for the fourth quarter amounted to SEK 902 million (237), resulting in an operating margin of 12.1% (3.5) on sales including intra-Group sales. The operating profit for the full year amounted to SEK 3,498 million (1,551), resulting in an operating margin of 11.8% (5.4). Sales including intra-Group sales for the quarter were SEK 7,443 million (6,745), and for the full year SEK 29,607 million (28,546). Net sales for the fourth quarter amounted to SEK 4,904 million (4,508) and for the full year SEK 19,424 million (19,534). The increase of 8.8% for the quarter was attributable to: organic growth 16.6% and currency effects -7.8%. For the full year the decrease of -0.6% was attributable to: organic growth 6.0% and currency effects -6.6%. Sales in local currency for the fourth quarter were significantly higher in Europe, North America and Asia. For the full year they were lower in Europe, higher in North America and significantly
  • 6. Page 2 of 19 higher in Asia. The positive trend continued in all main segments with a particular good development in construction equipment, fluid power and industrial gearboxes. Service Division The operating profit for the fourth quarter amounted to SEK 841 million (729), resulting in an operating margin of 14.6% (14.3). The operating profit for the full year amounted to SEK 3,036 million (2,585), resulting in an operating margin of 13.5% (13.0). Sales including intra-Group sales for the quarter were SEK 5,763 million (5,098), and for the full year SEK 22,408 million (19,957). Net sales for the fourth quarter amounted to SEK 5,664 million (5,008) and for the full year SEK 22,029 million (19,599). The increase of 13.1% for the quarter was attributable to: organic growth 17.2% and currency effects -4.1%. For the full year the increase of 12.4% was attributable to: organic growth 16.1% and currency effects -3.7%. Sales in local currencies for the fourth quarter were significantly higher in Europe, Asia, North America and Latin America. In Middle East and Africa they were higher. For the full year they were significantly higher in Europe, Asia, Latin America and Middle East and Africa. In North America they were higher, affected by the ongoing distributor de-stocking. Automotive Division The operating profit for the fourth quarter amounted to SEK 445 million (92), resulting in an operating margin of 8.2% (1.9). The operating profit for the full year amounted to SEK 1,859 million (-785), resulting in an operating margin of 8.5% (-4.1). Sales including intra-Group sales for the quarter were SEK 5,439 million (4,880), and for the full year SEK 21,989 million (19,103). Net sales for the fourth quarter amounted to SEK 4,491 million (4,110) and for the full year SEK 18,231 million (16,051). The increase of 9.3% for the quarter was attributable to: organic growth 16.3% and currency effects -7.0%. For the full year the increase of 13.6% was attributable to: organic growth 20.2% and currency effects -6.6%. Sales in local currencies to the car and light truck industries in Europe and North America were higher for the quarter and significantly higher for the full year. In Asia sales were significantly higher both for the quarter and for the full year. Sales to the heavy truck industries in Europe, North America and Asia were significantly higher both for the quarter and for the full year. Sales to the vehicle service market in Europe, Latin America and Asia were significantly higher in the quarter and for the full year. In North America sales were significantly higher in the quarter and relatively unchanged for the full year. Sales to the electrical industry in Europe as well as sales to the two-wheeler industry in Asia were significantly higher both for the quarter and for the full year. Highlights in the quarter: In Europe, a new contract for the SKF Low Friction Engine Seal with Isuzu was signed. The SKF Low Friction Engine Seal, launched in 2010, is used in many automotive applications, providing lower fuel consumption and reducing CO2 emissions via significantly reduced friction. In Germany, a SKF Gear Bearing Unit was developed with Daimler for their heavy duty engines. This is a customized tapered gear bearing unit designed to accommodate heavy loads.
  • 7. Page 3 of 19 A number of new offerings were launched during the quarter. The solutions include among others a pulley unit designed for the alternator in the engine and a unit that helps to reduce energy and water consumption for front loaded washing machines. Previous outlook statement: Outlook for the fourth quarter of 2010 Development compared to the fourth quarter last year The demand for SKF products and services is expected to be significantly higher for the Group, the divisions and for the different geographical areas. Development compared to the third quarter 2010 and adjusted for normal seasonality The demand is expected to be slightly higher for the Group, the divisions and for the different geographical areas. Manufacturing level The manufacturing level will be significantly higher year on year and unchanged compared to the third quarter, adjusted for normal seasonality. Highlights in the previous quarters • SKF was awarded a contract with Guohua Energy Investment, a major Chinese energy company to supply 180 SKF WindCon systems to improve reliability maintenance for existing turbines. Guohua Energy Investment is also developing a new wind farm in Beijing to which SKF will supply 58 SKF WindCon systems. • SKF has launched 13 new offerings to help customers increase reliability and safety as well as reduce costs, CO2 emissions and environmental impact. The solutions include a four-row tapered roller bearing for rolling mills, a low friction X-Tracker wheel hub bearing unit for cars and light trucks, SKF Cam Follower Units for direct injection systems of cars and trucks, asset management services for cranes, specialized bearings for sub-sea and pumps in extreme environments in the oil and gas industry and a hydraulic-driven lubricator for hammers and breakers used in the construction industry. • SKF has now documented over USD two billion savings by its customers as a result of using SKF solutions. This data was collected over a 10-year period with the close cooperation of customers and the use of a patented SKF program, SKF Documented Solutions Program. • SKF is building a factory for medium-sized bearings in China. The factory will be located in Dalian, close to SKF’s existing factory for large-sized bearings. The new investment amounts to around SEK 400 million and is expected to come into operation in 2011 employing 250 people. • SKF will expand its present seals manufacturing capacity by building a new factory in Mysore, India that will serve customers within the automotive, railway and industrial applications segments. The investment amounts to around SEK 160 million and will be fully operational by the second half of 2012 employing about 600 people. • SKF is investing around USD 18 million in a new heat treatment facility in Falconer, USA, as part of an expansion to its areoengine operations in the country. The new facility will house a new high-tech vacuum furnace for the carburizing and hardening of a variety of materials and is a very critical operation in the bearing manufacturing process. • Two new SKF Solution Factories were inaugurated in the quarter, one in the UK and one in Turkey. There are now fourteen SKF Solution Factories over the world. • SKF’s newly constructed manufacturing facility in Tver, Russia as well as the new corporate head office in Lansdale, USA have been designed and constructed according to the U.S. Green Building council’s LEED (Leadership in Energy and Environmental Design) standard. The factory in Tver has now been awarded Gold level and is the first manufacturing facility to have this
  • 8. Page 4 of 19 type of certification anywhere in Russia, while the Lansdale office has achieved Platinum - the highest level in the LEED certification system. • For the eleventh year in succession, SKF was selected to be a member of Dow Jones’ Sustainability World Indexes and for the tenth year in succession, in the FTSE4Good Index Series. • SKF inaugurated its new factory in Tver, Russia where the new generation of SKF’s sealed and pre-lubricated compact tapered bearing units will be produced for the Russian and international railway customers. The factory will be one of the first in Russia and in Europe with LEED certification. The investment amounts to around SEK 235 million and the factory will employ 100 people. • SKF inaugurated a Global Technical Centre China in Shanghai. The centre will be an integral part of SKF’s global network of technical centres and will enable SKF to develop products and solutions for local and global customers in a faster and more cost effective way. • SKF was awarded an agreement with ZF Sachs Italy to supply 140,000 oil seals and wiper seals for motorcycle forks. • SKF signed a three-year contract worth around SEK 34 million with Valeo to supply SKF Rotor Positioning Bearings for the new i-StARS, Valeos stop-start system. i-StARS automatically cuts off the vehicle’s engine when slowing down under 8 km/h, e.g when stopping for a red light. The system enables further reduction in CO2 emissions. • SKF signed a framework agreement with the State Forestry Administration in China to plant new forests, in remote areas of the country. The project is expected to run for five years. • SKF received the “Golden Mousetrap” award in the 2010 “Best products awards” announced by the magazine Design News. This was in the Electronics/Test and Measurement category and for the new SKF Machine Condition Advisor, a handheld instrument which simplifies machine monitoring and provides early warning of potential failures. Design News annual Golden Mousetrap Awards recognize engineering innovation and creativity in product design. • SKF has assisted S-OIL, a large South Korean oil refinery, to increase productivity and reduce potential production downtime. The project resulted in a payback for S-OIL in less than 11 months. The SKF solution included the development of asset strategy, defect eliminations and operator driven reliability. • Three new SKF Solution Factories were inaugurated, one in Schweinfurt, Germany, one in Montigny-le-Bretonneux, France and one in Moscow, Russia. • SKF inaugurated two new factories in India. The factory in Haridwar will manufacture deep groove ball bearings and the Ahmedabad factory will manufacture medium to large-sized bearings of various types. • A programme was concluded in March for adjusting the manufacturing capacity in Gothenburg, Sweden. The total cost of these activities, around SEK 90 million, mainly impacted the Industrial Division and has been charged to the income statement in the first quarter. The benefit of these actions will be around SEK 50 million per year when fully implemented by the third quarter. • The ninth SKF Solution Factory was inaugurated in Houston, USA. Risks and uncertainties in the business The SKF Group operates in many different industrial, automotive and geographical segments that are at different stages of the economic cycle. A general economic downturn at global level, or in one of the world’s leading economies, could reduce the demand for the Group’s products, solutions and services for a period of time. In addition, terrorism and other hostilities, as well as disturbances in worldwide financial markets, could have a negative effect on the demand for the
  • 9. Page 5 of 19 Group’s products and services. There are also political and regulatory risks associated with the wide geographical presence. Regulatory requirements, taxes, tariffs and other trade barriers, price or exchange controls or other governmental policies could limit the SKF Group’s operations. The SKF Group is subject to both transaction and translation of currency exposure. For commercial flows the SKF Group is primarily exposed to the USD and to US dollar-related currencies. As the major part of the profit is made outside Sweden, the Group is also exposed to translational risks in all the major currencies. The parent company performs services of a common Group character. The financial position of the parent company is dependent on the financial position and development of the subsidiaries. A general decline in the demand for the products and services provided by the Group could mean lower dividend income for the parent company, as well as a need for writing down values of the shares in the subsidiaries. Cautionary statement This report contains forward-looking statements that are based on the current expectations of the management of SKF. Although management believes that the expectations reflected in such forward-looking statements are reasonable, no assurance can be given that such expectations will prove to have been correct. Accordingly, results could differ materially from those implied in the forward-looking statements as a result of, among other factors, changes in economic, market and competitive conditions, changes in the regulatory environment and other government actions, fluctuations in exchange rates and other factors mentioned in SKF's latest annual report (available on www.skf.com) under the Administration Report; "Important factors influencing the financial results", "Financial risks" and "Sensitivity analysis", and in this full-year report under "Risks and uncertainties in the business." Gothenburg, 1 February 2011 Aktiebolaget SKF (publ.) Tom Johnstone President and CEO
  • 10. Page 6 of 19 Teleconference/meeting - On 1 February at 13.30 (CET), 12.30 (UK): +46 (0)8 5052 0114 Swedish participants, ref.no. 885203 +44 (0)207 1620 177 European participants, ref.no. 885203 +1 334 323 6203 US participants, ref.no. 885203 Venue: Operaterrassen Karl XII:s torg Stockholm Please don’t use your phone’s loudspeaker as this has a negative effect on the sound. You will find all information regarding SKF Year-end results on the IR website. http://investors.skf.com/quarterlyreporting Enclosures: Financial statements 1. Consolidated income statements 2. Consolidated statements of comprehensive income and consolidated statements of changes in shareholders’ equity 3. Consolidated balance sheets 4. Consolidated statements of cash flow Other financial statements 5. Consolidated financial information - yearly and quarterly comparisons 6. Segment information - yearly and quarterly comparisons 7. Parent company income statements, statements of comprehensive income, balance sheets and footnote 8. Acquisition of Lincoln Industrial The consolidated financial statements of the SKF Group are prepared in accordance with International Financial Reporting Standards as adopted by EU. The SKF Group applies the same accounting policies and methods of computation in the interim financial statements as compared with the Annual Report 2009 including Sustainability Report. No new or amended IFRS effective 2010 had any significant impact on the Group. The consolidated quarterly report has been prepared in accordance with IAS 34. The report for the parent company has been prepared in accordance with the Annual Accounts Act and RFR 2. The report has not been reviewed by the company’s auditors. The SKF First-quarter report 2011 will be published on Tuesday, 19 April 2011. The Annual General Meeting will be held on Thursday, 28 April 2011 in Gothenburg, Sweden. The SKF Annual Report including Sustainability Report for 2010 will be published in a pdf-format on SKF’s website http://investors.skf.com on 11 March 2011. The printed report will be delivered on 24 March 2011 and will be available at the company on that day. Further information can be obtained from: Ingalill Östman, Group Communication tel: +46-31-3373260, mobile: +46-706-973260, e-mail: ingalill.ostman@skf.com Marita Björk, Investor Relations tel: +46-31-3371994, mobile: +46-705-181994, e-mail: marita.bjork@skf.com Aktiebolaget SKF, SE-415 50 Göteborg, Sweden, Company reg.no. 556007-3495, Tel: +46-31-3371000, fax: +46-31-3372832, www.skf.com
  • 11. Page 7 of 19 Enclosure 1 CONSOLIDATED INCOME STATEMENTS (SEKm) Oct-Dec Oct-Dec Jan-Dec Jan-Dec 2010 2009 2010 2009 Net sales 15,409 13,887 61,029 56,227 Cost of goods sold -11,139 -11,049 -44,216 -45,024 Gross profit 4,270 2,838 16,813 11,203 Selling and administrative expenses -2,020 -1,838 -8,222 -7,915 Other operating income/expenses - net -49 2 -139 -74 Profit/loss from jointly controlled and associated companies 1 2 0 -11 Operating profit 2,202 1,004 8,452 3,203 Operating margin, % 14.3 7.2 13.8 5.7 Financial income and expense - net -154 -239 -903 -906 Profit before taxes 2,048 765 7,549 2,297 Taxes -698 -260 -2,253 -592 Net profit 1,350 505 5,296 1,705 Net profit attributable to Shareholders of the parent 1,311 476 5,138 1,642 Non-controlling interests 39 29 158 63 Basic earnings per share, SEK* 2.87 1.05 11.28 3.61 Diluted earnings per share, SEK* 2.87 1.05 11.28 3.61 Additions to property, plant and equipment 460 505 1,651 1,975 Number of employees registered 44,742 41,172 44,742 41,172 Return on capital employed for the 12-month period ended 31 December, % 24.0 9.1 24.0 9.1 * Basic and diluted earnings per share are based on net profit attributable to shareholders of the parent. NUMBER OF SHARES Total number of shares 455,351,068 455,351,068 455,351,068 455,351,068 - whereof A shares 44,915,604 45,421,004 44,915,604 45,421,004 - whereof B shares 410,435,464 409,930,064 410,435,464 409,930,064 Total number of diluted shares outstanding 455,351,068 455,351,068 455,351,068 455,351,068 Total weighted average number of diluted shares 455,351,068 455,351,068 455,351,068 455,365,536
  • 12. Page 8 of 19 Enclosure 2 CONSOLIDATED STATEMENTS OF COMPREHENSIVE INCOME (SEKm) Oct-Dec Oct-Dec Jan-Dec Jan-Dec 2010 2009 2010 2009 Net profit 1,350 505 5,296 1,705 Other comprehensive income Exchange differences arising on translation of foreign operations 22 456 -1,660 -798 Available-for-sale assets 119 79 169 134 Cash flow hedges 14 -41 18 182 Actuarial gains and losses 839 -75 -616 -888 Income tax relating to components of other comprehensive income -286 8 56 105 Other comprehensive income, net of tax 708 427 -2,033 -1,265 Total comprehensive income 2,058 932 3,263 440 Total comprehensive income attributable to Shareholders of AB SKF 2,012 869 3,131 412 Non-controlling interests 46 63 132 28 CONSOLIDATED STATEMENTS OF CHANGES IN SHAREHOLDERS’ EQUITY (SEKm) December 2010 December 2009 Opening balance 1 January 18,280 19,689 Total comprehensive income 3,263 440 Cost for share programmes and exercise of options, net 8 -12 Non-controlling interests -35 -208 Total cash dividends -1,622 -1,629 Closing balance 19,894 18,280
  • 13. Page 9 of 19 Enclosure 3 CONSOLIDATED BALANCE SHEETS (SEKm) December 2010 December 2009 Goodwill 6,309 2,759 Other intangible assets 4,164 1,255 Property, plant and equipment 12,922 13,933 Deferred tax assets 1,695 1,665 Other non-current assets 1,411 1,502 Non-current assets 26,501 21,114 Inventories 12,879 11,771 Trade receivables 9,859 8,800 Other current assets 2,839 3,590 Other current financial assets 3,146 5,740 Current assets 28,723 29,901 TOTAL ASSETS 55,224 51,015 Equity attributable to shareholders of AB SKF ← 18,935 ← 17,411 ← ← Equity attributable to non-controlling interests ← 959 ← 869 Long-term financial liabilities 10,850 8,987 Provisions for post-employment benefits 7,093 7,020 Provisions for deferred taxes 2,132 754 Other long-term liabilities and provisions 1,622 1,599 Non-current liabilities 21,697 18,360 Trade payables 4,476 3,989 Short-term financial liabilities 1,325 2,018 Other short-term liabilities and provisions 7,832 8,368 Current liabilities 13,633 14,375 TOTAL EQUITY AND LIABILITIES 55,224 51,015
  • 14. Page 10 of 19 Enclosure 4 CONSOLIDATED STATEMENTS OF CASH FLOW (SEKm) Oct-Dec Oct-Dec Jan-Dec Jan-Dec 2010 2009 2010 2009 Operating activities: Operating profit 2,202 1,004 8,452 3,203 Depreciation, amortization and impairment 539 503 1,992 2,171 Net loss/gain (-) on sales of intangible assets, PPE, equity securities, businesses and assets held for sale -30 15 -5 29 Taxes -511 -227 -1,722 -1,068 Other including financial and non-cash items -453 206 -1,950 590 Changes in working capital -489 467 -1,216 3,076 Net cash flow from operations 1,258 1,968 5,551 8,001 Investing activities: Payments in intangible assets, PPE, businesses and equity securities -7,239 -532 -8,496 -2,271 Sales of intangible assets, PPE, businesses, assets held for sale and equity securities 15 9 107 22 Net cash flow used in investing activities -7,224 -523 -8,389 -2,249 Net cash flow after investments before financing* -5,966 1,445 -2,838 5,752 Financing activities: Change in short- and long-term loans 3,636 -2,078 2,281 -2,048 Payment of finance lease liabilities -1 0 -11 -6 Cash dividends 0 -1 -1,622 -1,629 Investments in short-term financial assets -119 -169 -788 -2,831 Sales of short-term financial assets 631 1,441 996 2,461 Net cash flow used in financing activities 4,147 -807 856 -4,053 NET CASH FLOW -1,819 638 -1,982 1,699 Change in cash and cash equivalents: Cash and cash equivalents at 1 October/1 January 4,193 3,761 4,430 2,793 Cash effect excl. acquired businesses -2,102 638 -2,265 1,699 Cash effect of acquired businesses 283 0 283 0 Exchange rate effect 21 31 -53 -62 Cash and cash equivalents at 31 December 2,395 4,430 2,395 4,430 Change in net interest- Opening Translation Cash Businesses Other non Closing bearing liabilities balance effect change acquired/ cash balance 1 Jan 2010 sold changes 31 Dec 2010 Loans, long- and short-term 10,750 -1,289 2,281 0 54 11,796 Post-employment benefits, net 6,993 -760 -466 163 1,117 7,047 Financial assets, others -1,512 76 208 -2 217 -1,013 Cash and cash equivalents -4,430 53 2,265 -283 0 -2,395 Net interest-bearing liabilities 11,801 -1,920 4,288 -122 1,388 15,435 * Adjusted for acquisition of Lincoln Industrial Oct-Dec Oct-Dec Jan-Dec Jan-Dec 2010 2009 2010 2009 Net cash flow after investments before financing -5,966 1,445 -2,838 5,752 Adjustment for acquisition of Lincoln Industrial 6,764 0 6,764 0 Net cash flow after investments before financing after adjustment for acquisition of Lincoln Industrial 798 1,445 3,926 5,752
  • 15. Page 11 of 19 Enclosure 5 CONSOLIDATED FINANCIAL INFORMATION – YEARLY AND QUARTERLY COMPARISONS (SEKm unless otherwise stated) Full Full year year 1/09 2/09 3/09 4/09 2009 1/10 2/10 3/10 4/10 2010 Net sales 14,849 14,167 13,324 13,887 56,227 14,446 15,709 15,465 15,409 61,029 Cost of goods sold -11,844 -11,656 -10,475 -11,049 -45,024 -10,701 -11,336 -11,040 -11,139 -44,216 Gross profit 3,005 2,511 2,849 2,838 11,203 3,745 4,373 4,425 4,270 16,813 Gross margin, % 20.2 17.7 21.4 20.4 19.9 25.9 27.8 28.6 27.7 27.5 Selling and administrative expenses -2,219 -2,007 -1,851 -1,838 -7,915 -2,032 -2,128 -2,042 -2,020 -8,222 Other operating income/ expenses - net -14 -25 -37 2 -74 -7 -7 -76 -49 -139 Profit/loss from jointly controlled and associated companies -4 -5 -4 2 -11 -4 1 2 1 0 Operating profit 768 474 957 1,004 3,203 1,702 2,239 2,309 2,202 8,452 Operating margin, % 5.2 3.4 7.2 7.2 5.7 11.8 14.3 14.9 14.3 13.8 Financial income and expense - net -237 -162 -268 -239 -906 -198 -192 -359 -154 -903 Profit before taxes 531 312 689 765 2,297 1,504 2,047 1,950 2,048 7,549 Profit margin before taxes,% 3.6 2.2 5.2 5.5 4.1 10.4 13.0 12.6 13.3 12.4 Taxes -137 11 -206 -260 -592 -434 -596 -525 -698 -2,253 Net profit 394 323 483 505 1,705 1,070 1,451 1,425 1,350 5,296 Net profit attributable to Shareholders of the parent 390 314 462 476 1,642 1,033 1,405 1,389 1,311 5,138 Non-controlling interests 4 9 21 29 63 37 46 36 39 158 Basic earnings per share, SEK* 0.86 0.69 1.01 1.05 3.61 2.27 3.09 3.05 2.87 11.28 Diluted earnings per share, SEK* 0.86 0.69 1.01 1.05 3.61 2.27 3.09 3.05 2.87 11.28 Dividend per share, SEK - 3.50 - - 3.50 - 3.50 - - 3.50 Return on capital employed for the 12-month period, % 18.7 13.4 10.2 9.1 9.1 11.9 16.8 20.7 24.0 24.0 Gearing, %** 50.1 51.1 52.9 49.3 49.3 48.3 47.4 47.6 48.6 48.6 Equity/assets ratio, % 35.9 34.6 33.5 35.8 35.8 36.2 36.0 36.0 36.0 36.0 Net worth per share, SEK* 43 40 36 38 38 38 38 37 42 42 Additions to property, plant and equipment 494 442 534 505 1,975 389 433 369 460 1,651 Registered number of employees 43,653 42,422 41,756 41,172 41,172 41,055 41,644 42,475 44,742 44,742 * Basic and diluted earnings per share and Net worth per share are based on net profit attributable to shareholders of the parent. ** Current- plus non-current loans plus provisions for post-employment benefits, net, as a percentage of the sum of current- plus non-current loans, provisions for post-employment benefits, net, and shareholders equity, all at end of interim period/year end.
  • 16. Page 12 of 19 Enclosure 6 SEGMENT INFORMATION - YEARLY AND QUARTERLY COMPARISONS** (SEKm unless otherwise stated) Full Full year year 1/09 2/09 3/09 4/09 2009 1/10 2/10 3/10 4/10 2010 Industrial Division Net sales 5,802 4,844 4,380 4,508 19,534 4,695 4,873 4,952 4,904 19,424 Sales incl. intra-Group sales 8,187 7,120 6,494 6,745 28,546 7,105 7,514 7,545 7,443 29,607 Operating profit 635 344 335 237 1,551 713 909 974 902 3,498 Operating margin* 7.8% 4.8% 5.2% 3.5% 5.4% 10.0% 12.1% 12.9% 12.1% 11.8% Operating margin excl. restructuring* 8.0% 5.5% 5.7% 6.6% 6.5% 11.2% 12.1% 12.9% 12.1% 12.1% Assets and liabilities, net 18,734 17,474 15,948 15,966 15,966 15,511 15,960 14,843 23,392 23,392 Registered number of employees 19,010 18,616 18,093 17,853 17,853 17,701 17,715 17,882 19,922 19,922 Service Division Net sales 5,011 4,944 4,636 5,008 19,599 5,093 5,635 5,637 5,664 22,029 Sales incl. intra-Group sales 5,118 5,028 4,713 5,098 19,957 5,181 5,725 5,739 5,763 22,408 Operating profit 598 636 622 729 2,585 647 745 803 841 3,036 Operating margin* 11.7% 12.7% 13.2% 14.3% 13.0% 12.5% 13.0% 14.0% 14.6% 13.5% Operating margin excl. restructuring* 11.7% 12.9% 13.5% 14.6% 13.1% 12.5% 13.0% 14.0% 14.6% 13.5% Assets and liabilities, net 5,471 5,333 4,734 4,819 4,819 5,345 5,650 5,054 5,125 5,125 Registered number of employees 5,940 5,823 5,761 5,725 5,725 5,731 5,710 5,773 5,832 5,832 Automotive Division Net sales 3,747 4,126 4,068 4,110 16,051 4,362 4,850 4,528 4,491 18,231 Sales incl. intra-Group sales 4,555 4,884 4,784 4,880 19,103 5,230 5,825 5,495 5,439 21,989 Operating profit -437 -468 28 92 -785 374 570 470 445 1,859 Operating margin* -9.6% -9.6% 0.6% 1.9% -4.1% 7.2% 9.8% 8.5% 8.2% 8.5% Operating margin excl. restructuring* -6.2% -0.6% 3.7% 5.5% 0.7% 7.2% 9.8% 8.5% 8.2% 8.5% Assets and liabilities, net 10,359 9,143 8,177 8,073 8,073 8,437 8,502 7,976 8,034 8,034 Registered number of employees 14,318 13,744 13,778 13,480 13,480 13,569 14,002 14,399 14,469 14,469 * Operating margin is calculated on sales including intra-Group sales. Reconciliation to profit before tax for the Group** Jan-Dec 2010 Jan-Dec 2009 Operating profit: Industrial Division 3,498 1,551 Service Division 3,036 2,585 Automotive Division 1,859 -785 Other operations outside the divisions 341 158 Unallocated Group activities and adjustments, net -282 -306 Financial net -903 -906 Profit before tax for the Group 7,549 2,297 ** Previously published amounts have been restated to conform to the current Group structure in 2010. The structural changes include business units being moved between the divisions and between other operations/Group activities and divisions.
  • 17. Page 13 of 19 Enclosure 7 PARENT COMPANY INCOME STATEMENTS (SEKm) Oct-Dec Oct-Dec Jan-Dec Jan-Dec 2010 2009 2010 2009 Net sales 438 447 1,683 1,623 Cost of services provided -438 -447 -1,683 -1,623 Gross profit 0 0 0 0 Administrative expenses -95 -18 -213 -101 Other operating income/expenses – net -2 1 -14 0 Operating loss -97 -17 -227 -101 Financial income and expenses - net -68 -68 1,718 2,602 Loss/profit before taxes -165 -85 1,491 2,501 Provisions to untaxed reserves -178 -145 -178 -145 Taxes 68 53 157 99 Net loss/profit -275 -177 1,470 2,455 PARENT COMPANY STATEMENTS of COMPREHENSIVE INCOME (SEKm) Oct-Dec Oct-Dec Jan-Dec Jan-Dec 2010 2009 2010 2009 Net loss/profit -275 -177 1,470 2,455 Other comprehensive income Available-for-sale assets 118 76 168 134 Other comprehensive income, net of tax 118 76 168 134 Total comprehensive income -157 -101 1,638 2,589 PARENT COMPANY BALANCE SHEETS (SEKm) N December 2010 December 2009 o t e Investments in subsidiaries 22,255 17,211 Receivables from subsidiaries 10,592 8,614 Other non-current assets 689 524 Non-current assets 33,536 26,349 Receivables from subsidiaries 3,285 3,472 Other receivables 154 209 Current assets 3,439 3,681 TOTAL ASSETS 36,975 30,030 Shareholders’ equity 1 11,490 10,208 Untaxed reserves 1,417 1,240 Provisions 165 151 Non-current liabilities 10,581 8,614 Current liabilities 13,322 9,817 TOTAL SHAREHOLDERS’ EQUITY, PROVISIONS AND LIABILITIES 36,975 30,030 Contingent liabilities 5 5 Note 1. Shareholders’ equity (SEKm) December 2010 December 2009 Opening balance 1 January 10,208 8,258 Dividends -1,594 -1,594
  • 18. Page 14 of 19 Total comprehensive income 1,638 2,589 Exercise of options and cost for share programmes, net 31 -11 Group contribution, net 1,207 966 Closing balance 11,490 10,208 Enclosure 8 Acquisition of Lincoln Industrial On 28 December 2010 the Group acquired 100% of the shares of Lincoln Holdings Enterprises, Inc (Lincoln Industrial) from Harbour Group. Lincoln Industrial is a leader in the design, manufacture and supply of highly engineered lubrication systems, tools and equipment, and is headquartered in St. Louis, Missouri, USA. Lincoln Industrial’s three main product lines are automated lubrication systems, hose reels, and grease guns, with a focus on grease-based systems. Sales are mainly generated from automated lubrication systems and related products. Major end markets include industrial, energy, off- highway, mining, agriculture, and steel. The company has a global footprint with around 50% of its sales generated in North America, 25% in Europe and 20% in Asia Pacific. The company has around 2,000 employees with manufacturing operations in the US, Asia and Europe. Lincoln Industrial will be part of a newly created business unit for lubrication systems within SKF’s Industrial Division. The acquisition of Lincoln Industrial is in line with SKF’s strategy and builds on a series of acquisitions made in the lubrication systems sector over the last six years. Lincoln Industrial is highly complementary to SKF’s existing lubrication systems business, with limited product and geographical overlap. The acquisition furthers SKF’s strategy including: • improving the lubrication systems platform through Lincoln Industrial’s complementary product portfolio. • increasing the geographical sales coverage in North America and Asia. • expanding the business to the automotive aftermarket in the US. • expanding the manufacturing operations through Lincoln Industrial’s strong US and Asian manufacturing footprint. SKF expects to achieve significant synergies from the combination through improved sales opportunities and greater efficiencies. Lincoln Industrial is included in the Group’s balance sheet at 31 December 2010, with no impact on the Group’s income statement for the year 2010. Their results will be included in the Group’s income statement as from 1 January 2011. A preliminary allocation of the acquisition cost to the identifiable assets acquired and liabilities assumed (net assets) was made. All allocations are only preliminary and are expected to be finalized in Q2 2011 pending the final audit and asset valuations. The preliminary values are as follows: Fair value of net assets acquired (SEKm): Trademarks 1,020 Customer relationships 1,836 Other intangibles 287 Plant, property and equipment 358 Receivables 441 Inventory 648 Other assets 300 Deferred tax provisions -1,225 Post-employment benefits -163 Other liabilities -344 3,158 Goodwill 3,889 Total acquisition cost 7,047 Cash and cash equivalents acquired -283 Cash outflow 6,764
  • 19. Page 15 of 19 The acquisition cost is subject only to adjustments for the final audited cash, working capital, and indebtedness levels. The acquisition was paid using existing cash and credit facilities. Acquisition related-costs of SEK 99 million were expensed, of which SEK 80 million was included as Other operating expense and SEK 19 million was included as Selling expense in the Group’s income statement. Receivables arise from the normal course of business and include an allowance for uncollectibilty of approximately SEK 16 million. The acquisition of Lincoln Industrial included all Lincoln, Alemite and Reelcraft entities and brands. Consequently the opening balances include a preliminary valuation of trademarks of SEK 1,020 million, which the Group considers to have indefinite useful lives, as it is intended to continue to promote these brands in the foreseeable future. Preliminary values were allocated to other significant intangibles which included customer relationships to be amortized over an expected life of 15 years. None of the goodwill is expected to be deductible for tax purposes. The preliminary goodwill arises due to Lincoln Industrial’s expected ability to continuously renew its technology resulting in improved sales opportunities as well as their ability to deliver strong financial performance on a consistent basis. Proforma net sales and net profit Had Lincoln Industrial been acquired at 1 January 2010, the consolidated revenue for the Group would have amounted to SEK 63,858 million, and consolidated net profit would have been SEK 5,509 million. This unaudited proforma information adds Lincoln Industrial’s income statement excluding their acquisition-related costs and financing costs, and adjusts for the additional amortizations, depreciations, and inventory costs arising from the fair value adjustment. Additionally, net financial costs were adjusted to reflect the change in the Group’s net interest bearing liabilities caused by the payment of the purchase price. Income taxes have been included in all proforma adjustments.