![[object Object],[object Object],[object Object],3 Parts](data:image/gif;base64,R0lGODlhAQABAIAAAAAAAP///yH5BAEAAAAALAAAAAABAAEAAAIBRAA7)
Empfohlen
Weitere ähnliche Inhalte
Was ist angesagt?
Was ist angesagt? (20)
Andere mochten auch
Ähnlich wie Overview of MassGIS Web Mapping Services
Ähnlich wie Overview of MassGIS Web Mapping Services (20)
Overview of MassGIS Web Mapping Services
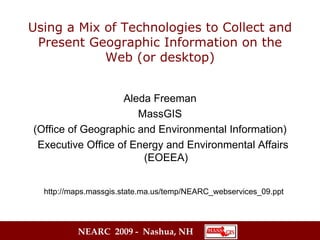
- 1. Using a Mix of Technologies to Collect and Present Geographic Information on the Web (or desktop) Aleda Freeman MassGIS (Office of Geographic and Environmental Information) Executive Office of Energy and Environmental Affairs (EOEEA) http://maps.massgis.state.ma.us/temp/NEARC_webservices_09.ppt
- 6. Current Online Mapping map servers data storage types of applications OpenLayers MapBuilder ESRI ArcMap iPhone Flash uDig Gaia Google maps Google Earth desktop browser SDE with Oracle ESRI ArcIMS GeoServer
- 9. WMS Result
- 11. WFS Result (partial)
- 14. Client – ArcMap
- 16. Client – DCR Forestry Viewer (OpenLayers) http://maps.massgis.state.ma.us/dcr/forestry/forestry23.html
- 17. Client – DCR Forestry Viewer (OpenLayers)
- 18. Client – State Aid Viewer (Google maps) http://drwren.com/true/stateaid.html
- 21. Client – The National Map (ESRI HTML viewer) http://nmviewogc.cr.usgs.gov
- 22. Client – GOS Gadget (Windows Vista or 7)
- 23. Client – MBI Survey (Google Maps geocoding) Massachusetts Broadband Institute Survey http://www.massbroadband.org/mapping/survey.html
- 24. Client – MBI Survey (Google Maps + WMS) Massachusetts Broadband Institute Survey http://maps.massgis.state.ma.us/broadband/broadband_survey_results.htm
- 25. Client – Welldrillers (MapBuilder)
- 26. Client – CZM MORIS (Java Web Start) http://www.mass.gov/czm/mapping
- 32. MassGIS Webservices Info http://lyceum.massgis.state.ma.us Working examples of requests and responses with MassGIS data Subscribe via RSS for updates http://www.mass.gov/mgis/mapping.htm Links to many online mapping applications http://groups.google.com/group/massgis_webservices Public Google group for users (56) of the services http://spatialreference.org Look up EPSG code values for projections http://maps.massgis.state.ma.us/temp/NEARC_webservices_09.ppt This Powerpoint
Hinweis der Redaktion
- Examples = the mechanics of how to connect to the map services and use them Showcase – give you an idea of different ways agencies are using the services So I can figure out how much time to spend on the middle part – can I get a quick show of hands – 1) How many people are familiar with web map services? 2) How many people have connected to an used the MassGIS web map services
- We collect, but also create data, and distribute through FTP download, CD/DVD, paper maps, online viewers, and web map services. The current map services systems are going to be the focus of my talk today.
- Since we have a lot of different types of users it helps to provide data in a lot of different ways, including different image formats and projections.
- In addition to distributing data through paper maps, CDs and FTP, MassGIS has always been interested in distrubuting data as maps over the web. For online mapping MassGIS has used a variety of map severs to serve data. ArcIMS is still used to support a variety of onling mapping applications and continues to be our geocoding server. MassGIS has always preferred to keep it’s data in one database. In the late 1990s we used ESRI’s Librarian and then we migrated to Oracle and SDE which we still use today. What we seeing more today though is the ability to mix and match technologies. Even though we committed to SDE, since GeoServer can read SDE data we can use that as another option in our map serving collection.
- Here is where the mix of technologies starts to become evident. We have the complete set of data stored in Oracle with SDE on top. Another mixing of technologies is that SDE itself can work with many different brands of databases. Then we have ArcIMS and GeoServer reading the data from SDE. At first GeoServer couldn’t read all of our raster data from SDE so MassGIS with support from the Massachusetts Ocean Partnership sponsored improvements to GeoServer and now all the MassGIS data layers are available through both map servers. MassGIS tends to use ArcIMS to present composed maps and GeoServer to present individual layers for mixing and matching on your own. There are many types of applications that can connect to map data from ArcIMS or GeoSErver and can be either desktop or browser applications or even iPhone applications. All of the orange applications can connect to GeoServer and many can connect to ArcIMS. ArcIMS provides addess matching or geocoding to any application that needs it, GeoServer doesn’t do any address matching.
- What are web mapping services? OGC refers to the Open GeoSpatial Consortium which sets standards for geographic data. A WFS request could be like an identify on a feature or it could be a request for a shapefile extract in a certain projection.
- This is a simple example of a WMS request in URL format. I’ve highlighted the parameters in red for easier reading. The capitalization or order of the parameters doesn’t matter. The syntax of the request is a standard set by the Open Geospatial Consortium or OGC. Having this standard helps ensure that various types of application can connect to WMS services, because they know what syntax is acceptable. In order to get a map image back from the a WMS server you need these parameters: the name of the server (here we have 3, this is a load balancer) a version number a request type – here GetMap (versus GetFeature or GetLegendGraphic) a service WMS or WFS a list of layers separated by commas. These names you will get from the particular WMS service provider. MassGIS uses a naming convention. All of our layers are massgis: Oracle schema name usually GISDATA and the SDE layer name list of styles – here there are named styles. The names of the styles you will get from the particular WMS service provider. MassGIS uses a naming convention. All of our styles use the get from the particular WMS service provider. MassGIS uses a naming convention. many styles are Oracle schema name usually GISDATA and the SDE layer name + :: and a descriptive name . Sometimes a generic style is available such as “Black_Lines” here. Also, if no style is specified the layer’s default style is used a bounding box – expressed in a coordinate system specified by the SRS (spatial reference system). Here it’s 26986 or MA State Plane Mainland NAD 83 meters. Width, height of image you want back and Format of the image you want back
- Here is an example of a WFS request as a URL. Again, the server name, request type (GetFeature), version and service are similar to the GetMap WMS example. But here we have an optional propertyname – this lists the attributes that we want information for. Here the typename is giving the layer name. And here we also have an option CQL_FILTER. This request says: Give me the town and pop2000 attibute values from the layer GISDATA.TOWNS_POLY but only for town with a POP2000>100000. A WMS or WFS request can ask for a subset of the features to be returned. The subset can be based on attribute information (give me only high schools) and/or geographic information (give me only high schools in this bounding box). There is an OGC Filter specification. A WFS request can also ask for coordinates of the features. WFS requests can also be transactions – to insert, update and delete features from layers in our SDE database.
- Here is the beginning of the response to our WFS GetFeature request. We get back an XML text file that includes our information. At the top is an overall bounding box of the features that fit the filter of query. Then we get a list of featureMember where each featureMember is a record. For example, BOSTON fit the query, an we get the values for the two attributes that we requested. With the recent upgrade of GeoServer you also get back a bounding box for each individual featureMember.
- Since the MassGIS web mapping services are yet another way that MassGIS distributes data to the public, it’s a public system and I don’t necessarily know of all the applications out there that are using it. Not everyone will send me an email. There are log files I can analyze, but I haven’t done an exhaustive search of the traffic coming in.
- Programmers understand “WMS” and “WFS” and can connect and use these services with the tools that they’re familiar with, from OpenLayers to Google maps to Flash.
- To start with this is a simple example of how to connect to the GeoServer Web Map Services using ArcMap. ArcMap can be used to connect to ArcIMS or GeoServer. (See the “Add ArcIMS Server” vs “Add WMS Server”. Use ArcCatalog to connect to WFS underneath Interoperability Connections. Detailed instructions for connecting using ArcMap and other applications are on our website called lyceum which I’ll show at the end of the presentation.
- When a desktop GIS such as ArcMap is used to connect to the web mapping services the default style or symbolization will be used to draw the data. However, many datalayers can have more than one style in the MassGIS system. Styles is the MassGIS system are called named styles.
- OpenLayers is a JavaScript library for displaying maps in web pages. Through OpenLayers requests for maps (WMS) and requests for data (WFS) can be made to a web map server. Here DCR uses OpenLayers to create a map of forestry information. Each time the user zooms or pans the map a new GetMap request is made, with new bounding box coordinates. The user can switch between different named styles to symbolize the data in various ways. If the user clicks on a town a GetFeature request is made and …
- The results are returned to the client application as an XML file. This application parses the feature info out of the XML file and presents it nicely formatted to the user.
- This is an example of a publically accessible Google maps application developed by two citizens names Christopher Wren and Gordon Jamieson. Google maps allows for the overlay of WMS datalayers. In this case the application does not use named styles but rather submits to the MassGIS web mapping service enough information to make the map based on the data from their database. This is called Styled Layer Descriptor or SLD. MassGIS can make a map responding to a GetMap request that says, essentially, “give me a map of the towns, but make these 3 towns green, these 2 towns red and the rest white”. This type of interactive with the MassGIS web mapping services can be very useful if it’s not convenient or appropriate for MassGIS to host the data which is going to be mapped. For example, the Department of Health and Human Services could make a map of flu cases without giving MassGIS the flu table. In this case the town were colored based on Percent Change in State Aid. This request is very similar to a simple GetMap URL except:
- This GetMap request has a link for style information in an external SLD file. Notice also that this request is using EPSG code 3395 (which is WGS 84) and providing a bounding box also presumably in 3395. A handy way to look up EPSG codes is at the web site http://spatialreference.org
- This is a little of what’s in the online SLD file at http://drwren.com/true/data/0209percent.xml which is driving the symbolization of the Percent Change of the towns. For the WMS layer called “massgis:GISDATA.TOWNS_POLY” for the field called “TOWN” there are rules for each record. If TOWN=AQUINNAH, then apply this polygon fill and polygon outline. The colors are in the hexidecimal system.
- This application displays data. I believe that it’s an ESRI HTML Viewer. It connects to the MassGIS GeoServer system and submits GetMap URLs using named styles. It also provides identify information on features.
- This is a screenshot of a Windows machine running Vista or version 7 and using a Geospatial One Stop Gadget. GeoSpatial One Stop is also known as geodata.gov. Gadgets are little applications that can be placed on the desktop. This gadget was created with an FGDC grant. This application can connect the MassGIS WMS or WFS service (and other services out there) and then launch an application such as ArcMap, ArcGlobe or Gaia (an open source desktop GIS from the Carbon Tools company). http://thecarbonportal.net/modules.php?op=modload&name=Downloads&file=index&req=viewdownload&cid=6
- This application collects data. The Google map is a plain Google map with no web mapping services from MassGIS. Here the connection with MassGIS is in the background. Once the user puts in their address (geocoding done by Google and optionally moves the point, and answers the questions), the information is collected and a Python script crafts a WFS insert statement to GeoServer. (The data layer of points is specially configured to allow inserts.)
- Then, another Google maps application overlays that layer as a GeoServer WMS layer on top of Google maps.
- There are several applications right now that are editing data over the web. One is for welldrillers, another is for Community Preservation Projects – in both cases the users are required to use the applications) and the mapping application is a Javascript based toolkit called MapBuilder. A third application we have in development is an ArcMap toolbar for editing openspace. The user downloads a shapefile of openspace for their area, uses domains and sophisticated editing tools within ArcMap to edit the data and then posts the data back to GeoServer (and therefore SDE) using the WFS insert, update or delete requests. Another point about the web mapping services is how they can be embedded into applications that have a workflow. The map doesn’t need to be the central item. In the case of the welldrillers application, the welldriller on page 1 enters GPS coordinates and on page 2 a red dot appears on the map, which the driller can move if necessary. Then the welldriller continues onto page 3 of the application. They fill out 12 pages of information and then all the data gets submitted to the SDE database.
- MORIS is an application very similar OLIVER, but with a focus on ocean data. MORIS is an application written in Java and requires Java Web Start to run. The application runs on the user’s desktop. Both MORIS and OLIVER (and another application called SPOLIVER for crime data) connect to the GeoServer web map services. Each map zoom or pan generates another GetMap request while feature identify use a WFS request. MORIS and OLIVER allow vector and raster download and address matching. MORIS has a unique tool called the georegulations tool. When the user clicks on the map with the georegulations tool a series of WFS requests are run against a list of ocean datalayers to see if the point falls within any of the features in the layers.
- Details on sending requests through the gateway: http://lyceum.massgis.state.ma.us/wiki/doku.php?id=itd_gateway:home&s=gateway
- In August we upgrade the version of GeoServer which gave us a lot of improvments.
- Scheme to make drawing rasters 4x faster
- Since GIS people are visual this is a poster that tries to convey the different types of map servers and the different types of applications that are tapping into them. This represents actual applications and the agencies that are using them. These orange applications are pretty unique in how they’re put together demonstrating how these technologies can fit together. I’m going to show a few examples of applications that are connecting to the GeoServer map server. But first I’m going to explain the basic types of requests these applications can make.