Weitere ähnliche Inhalte Mehr von albertrodriguez5150 (20) Kürzlich hochgeladen (20) 1. PK Tested KG Tested 1ST Tested 2ND Tested
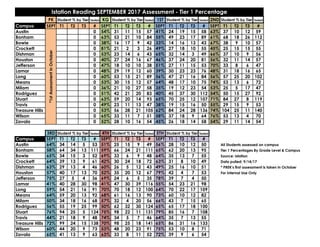
Campus SEPT T1 T2 T3 # SEPT T1 T2 T3 # SEPT T1 T2 T3 # SEPT T1 T2 T3 #
Austin 0 54% 31 11 15 57 41% 24 19 15 58 63% 37 10 12 59
Bonham 0 63% 53 21 10 84 55% 49 23 17 89 61% 68 18 26 112
Bowie 0 38% 16 17 9 42 33% 14 16 13 43 67% 38 9 10 57
Crockett 0 81% 21 2 3 26 49% 27 18 10 55 45% 25 15 15 55
Dishman 0 53% 23 14 6 43 65% 32 14 3 49 66% 37 10 9 56
Houston 0 40% 27 24 16 67 46% 37 24 20 81 56% 32 11 14 57
Jefferson 0 47% 18 10 10 38 51% 27 11 15 53 70% 33 8 6 47
Lamar 0 48% 29 19 12 60 39% 30 23 23 76 48% 31 18 16 65
Long 0 60% 53 15 21 89 56% 47 21 16 84 56% 57 25 20 102
Means 0 53% 30 15 12 57 64% 48 17 10 75 74% 53 13 6 72
Milam 0 36% 21 10 27 58 35% 19 12 23 54 53% 25 5 17 47
Rodriguez 0 51% 42 21 20 83 40% 45 37 30 112 54% 50 15 27 92
Stuart 0 63% 59 20 14 93 65% 70 25 12 107 71% 84 27 8 119
Travis 0 49% 23 11 13 47 38% 19 15 16 50 55% 29 15 9 53
Treasure Hills 0 53% 56 28 21 105 62% 84 24 28 136 74% 104 25 11 140
Wilson 0 65% 33 11 7 51 58% 37 18 9 64 76% 53 13 4 70
Zavala 0 52% 28 10 16 54 45% 26 18 14 58 54% 29 11 14 54
3RD Tested 4TH Tested 5TH Tested
Campus SEPT T1 T2 T3 # SEPT T1 T2 T3 # SEPT T1 T2 T3 #
Austin 64% 34 14 5 53 51% 25 15 9 49 56% 28 10 12 50 All Students assessed on campus
Bonham 58% 64 34 13 111 59% 66 24 21 111 65% 62 20 13 95 Tier 1 Percentages By Grade Level & Campus
Bowie 65% 34 15 3 52 69% 33 6 9 48 64% 35 13 7 55 Source: Istation
Crockett 64% 39 13 9 61 42% 30 24 18 72 63% 31 8 10 49 Data pulled: 9/14/17
Dishman 63% 29 13 4 46 60% 26 5 12 43 49% 25 16 10 51 * PREK's first assessment is taken in October
Houston 57% 40 17 13 70 52% 35 20 12 67 79% 42 4 7 53 For Internal Use Only
Jefferson 75% 27 5 4 36 69% 24 6 5 35 78% 39 7 4 50
Lamar 41% 40 28 30 98 41% 47 30 39 116 55% 54 23 21 98
Long 59% 54 21 16 91 70% 70 18 12 100 64% 70 22 17 109
Means 64% 59 20 13 92 68% 61 16 13 90 73% 60 10 12 82
Milam 50% 34 18 16 68 57% 32 4 20 56 66% 43 7 15 65
Rodriguez 56% 55 19 25 99 50% 62 32 30 124 65% 65 17 18 100
Stuart 76% 94 25 5 124 75% 98 22 11 131 79% 85 16 7 108
Travis 44% 21 18 9 48 74% 34 5 7 46 64% 35 7 13 55
Treasure Hills 72% 99 24 15 138 70% 98 25 18 141 65% 86 31 16 133
Wilson 60% 44 20 9 73 53% 48 20 23 91 75% 53 10 8 71
Zavala 65% 41 13 9 63 63% 33 8 11 52 72% 39 9 6 54
Student % by Tier Student % by Tier Student % by Tier
Istation Reading SEPTEMBER 2017 Assessment - Tier 1 Percentage
Student % by Tier Student % by Tier Student % by Tier Student % by Tier
*1stAssessmentinOctober
2. PK Tested KG Tested 1ST Tested 2ND Tested
Campus SEPT T1 T2 T3 # SEPT T1 T2 T3 # SEPT T1 T2 T3 # SEPT T1 T2 T3 #
Austin 0 25% 3 3 6 12 22% 2 3 4 9 36% 4 3 4 11
Bonham 0 0% 1 1 50% 1 1 2 26% 5 3 11 19
Bowie 0 29% 2 4 1 7 25% 2 4 2 8 43% 6 3 5 14
Crockett 0 100% 2 2 25% 5 9 6 20 44% 8 6 4 18
Dishman 0 100% 3 3 57% 4 1 2 7 56% 5 2 2 9
Houston 0 43% 3 3 1 7 45% 5 2 4 11 22% 2 1 6 9
Jefferson 0 50% 5 3 2 10 13% 2 5 8 15 78% 14 1 3 18
Lamar 0 100% 1 1 18% 4 8 10 22 30% 3 5 2 10
Long 0 25% 2 3 3 8 22% 2 3 4 9 50% 5 3 2 10
Means 0 0 100% 3 3 100% 4 4
Milam 0 31% 4 3 6 13 21% 4 1 14 19 39% 7 2 9 18
Rodriguez 0 0% 1 1 43% 3 1 3 7 29% 5 5 7 17
Stuart 0 36% 4 3 4 11 65% 11 3 3 17 67% 14 5 2 21
Travis 0 25% 2 4 2 8 6% 1 5 10 16 62% 8 2 3 13
Treasure Hills 0 44% 4 3 2 9 23% 3 1 9 13 67% 6 3 9
Wilson 0 100% 1 1 33% 2 4 6 100% 5 5
Zavala 0 50% 4 3 1 8 29% 2 4 1 7 56% 10 3 5 18
0 47% 102 35% 191 53% 223
3RD Tested 4TH Tested 5TH Tested
Campus SEPT T1 T2 T3 # SEPT T1 T2 T3 # SEPT T1 T2 T3 #
Austin 71% 5 1 1 7 17% 1 3 2 6 25% 1 2 1 4 Students with LEP Indicator (Y)
Bonham 44% 4 4 1 9 30% 3 2 5 10 20% 1 1 3 5 Tier 1 Percentages By Grade Level & Campus
Bowie 59% 10 6 1 17 56% 9 3 4 16 56% 5 1 3 9 Source: Istation
Crockett 57% 13 6 4 23 47% 15 11 6 32 69% 11 5 16 Data pulled: 9/14/17
Dishman 50% 6 6 12 40% 2 1 2 5 38% 5 3 5 13 For Internal Use Only
Houston 25% 2 3 3 8 38% 5 6 2 13 57% 4 1 2 7
Jefferson 80% 12 1 2 15 67% 10 2 3 15 67% 12 3 3 18
Lamar 39% 16 10 15 41 36% 12 7 14 33 44% 12 7 8 27
Long 50% 5 5 10 40% 2 2 1 5 0% 3 3 6
Means 36% 8 8 6 22 58% 11 2 6 19 71% 12 2 3 17
Milam 47% 8 1 8 17 61% 11 2 5 18 33% 6 3 9 18
Rodriguez 36% 9 9 7 25 41% 9 4 9 22 33% 6 2 10 18
Stuart 60% 6 2 2 10 25% 3 6 3 12 88% 7 1 8
Travis 40% 6 6 3 15 75% 9 1 2 12 13% 1 2 5 8
Treasure Hills 58% 7 1 4 12 63% 5 1 2 8 43% 3 1 3 7
Wilson 56% 9 6 1 16 50% 6 4 2 12 83% 10 2 12
Zavala 57% 13 5 5 23 47% 8 3 6 17 67% 6 1 2 9
51% 282 47% 255 47% 202
Student % by Tier Student % by Tier Student % by Tier
*1stAssessmentinOctober
Istation Reading SEPTEMBER 2017 Assessment - Tier 1 Percentage for LEP
Student % by Tier Student % by Tier Student % by Tier Student % by Tier
3. PK Tested KG Tested 1ST Tested 2ND Tested 3RD Tested
Campus SEPT T1 T2 T3 # SEPT T1 T2 T3 # SEPT T1 T2 T3 # SEPT T1 T2 T3 # SEPT T1 T2 T3 #
Austin 0 56% 5 1 3 9 25% 1 3 4 100% 1 1 0
Bonham 0 67% 8 2 2 12 73% 11 2 2 15 0 0
Bowie 0 50% 1 1 2 0% 1 1 0 50% 1 1 2
Crockett 0 67% 8 4 12 0 0 0
Dishman 0 0% 1 1 0 0 100% 1 1
Houston 0 67% 6 3 9 73% 8 3 11 0 75% 3 1 4
Jefferson 0 55% 6 2 3 11 57% 8 5 1 14 0 0
Lamar 0 37% 7 5 7 19 58% 18 4 9 31 73% 11 4 15 36% 12 8 13 33
Long 0 ~~ 0 ~~ 0 ~~ 0 ~~ 0
Means 0 36% 5 5 4 14 72% 21 5 3 29 73% 22 7 1 30 50% 1 1 2
Milam 0 29% 5 3 9 17 39% 7 5 6 18 30% 8 8 11 27 26% 9 6 20 35
Rodriguez 0 38% 5 3 5 13 33% 4 3 5 12 0 33% 1 1 1 3
Stuart 0 36% 4 2 5 11 0 0 0% 1 1
Travis 0 38% 5 1 7 13 50% 8 2 6 16 33% 1 2 3 0% 1 1
Treasure Hills 0 40% 2 1 2 5 33% 1 2 3 0% 1 1 33% 1 2 3
Wilson 0 54% 7 4 2 13 80% 8 1 1 10 0 80% 4 1 5
Zavala 0 8% 1 4 7 12 0 67% 2 1 3 0
0 42% 173 49% 164 54% 80 44% 90
~~ No students assessed in Español for September
All Students assessed in Español
Tier 1 Percentages By Grade Level & Campus
Source: Istation
Data pulled: 9/14/17 For Internal Use Only
* PREK's first assessment is taken in October
Istation Reading Español SEPTEMBER 2017 Assessment - Tier 1 Percentage
Student % by Tier
*1stAssessmentinOctober
Student % by Tier Student % by Tier Student % by Tier Student % by Tier
4. PK Tested KG Tested 1ST Tested 2ND Tested
Campus SEPT T1 T2 T3 # SEPT T1 T2 T3 # SEPT T1 T2 T3 # SEPT T1 T2 T3 #
Austin 0 25% 1 3 4 25% 1 1 2 4 13% 1 2 5 8
Bonham 0 100% 1 1 0 33% 2 2 2 6
Bowie 0 0 0% 1 1 100% 2 2
Crockett 0 0% 1 1 0% 1 1 0% 1 4 5
Dishman 0 50% 1 1 2 100% 1 1 33% 1 2 3
Houston 0 0% 1 1 25% 1 3 4 0% 4 4
Jefferson 0 0 0% 1 1 2 40% 2 1 2 5
Lamar 0 0 25% 1 3 4 0% 1 6 7
Long 0 33% 1 2 3 17% 1 2 3 6 17% 2 1 9 12
Means 0 0 0% 3 3 67% 4 2 6
Milam 0 0% 2 2 0% 2 2 50% 1 1 2
Rodriguez 0 33% 1 2 3 17% 1 1 4 6 25% 1 3 4
Stuart 0 67% 2 1 3 20% 1 1 3 5 100% 2 2
Travis 0 0% 1 1 0% 1 1 50% 1 1 2
Treasure Hills 0 80% 4 1 5 33% 1 1 1 3 33% 1 1 1 3
Wilson 0 100% 1 1 0% 1 1 0
Zavala 0 40% 2 1 2 5 0% 3 2 5 67% 2 1 3
0 41% 32 16% 49 39% 74
3RD Tested 4TH Tested 5TH Tested
Campus SEPT T1 T2 T3 # SEPT T1 T2 T3 # SEPT T1 T2 T3 #
Austin 40% 2 1 2 5 0% 2 4 6 13% 1 1 6 8 Students with Special Education Indicator (Y)
Bonham 20% 1 2 2 5 17% 1 1 4 6 14% 1 2 4 7 Tier 1 Percentages By Grade Level & Campus
Bowie 0% 1 2 3 0% 1 4 5 0% 3 2 5 Source: Istation
Crockett 42% 5 7 12 0% 1 6 7 13% 1 1 6 8 Data pulled: 9/14/17
Dishman 0% 2 1 3 0% 5 5 25% 1 1 2 4 For Internal Use Only
Houston 13% 1 7 8 11% 1 2 6 9 50% 5 5 10
Jefferson 33% 1 2 3 0 0% 1 1 2
Lamar 0% 8 8 0% 9 9 0% 8 8
Long 7% 1 3 10 14 0% 3 8 11 6% 1 5 10 16
Means 0% 1 2 3 50% 1 1 2 25% 2 6 8
Milam 17% 1 2 3 6 0% 7 7 14% 1 6 7
Rodriguez 25% 2 6 8 25% 2 3 3 8 7% 1 1 12 14
Stuart 100% 1 1 33% 2 4 6 0% 1 1 2
Travis 0% 1 3 4 25% 1 3 4 11% 1 1 7 9
Treasure Hills 33% 3 1 5 9 17% 2 3 7 12 25% 1 3 4
Wilson 9% 1 5 5 11 10% 1 3 6 10 36% 4 1 6 11
Zavala 33% 1 2 3 33% 2 4 6 13% 1 3 4 8
22% 106 14% 113 15% 131
Student % by Tier Student % by Tier Student % by Tier
Istation Reading SEPTEMBER 2017 Assessment - Tier 1 Percentage for SPED
Student % by Tier Student % by Tier Student % by Tier Student % by Tier
*1stAssessmentinOctober