SlideShare ist ein Scribd-Unternehmen logo
1 von 9
Name of the Ratio
1. Liquidity Ratios
Current Ratio
= CA/CL

Calculations
2010-11

Calculations
2011-12

Analysis

739.21/661.15
=1.11:1

758.68/694.21
=1.09:1

Quick Ratio
=(CAInventories)/CL
Cash Ratio
=(Cash+Marketable
Securities)/CL

739.21- 153.70/
661.15=0.88:1

758.68- 217.68/
694.21=0.77:1

395.61+ 0/
661.15= 0.59
= 59% approx

309.81+0/
694.21=0.44
=44% approx

Networking Capital
Ratio = NWC/NA

78.06/384.10
=0.20

64.47/435.39
= 0.14

Deteriorated since 2011.

871,96.58/
(162,29.76+
77,73.62)/2=7.2
times
2,381.51/42.96
=55.43 times

1,050,22.17/
(199,69.59+
103,49.57 )/2
=6.9 times
2,805.54/87.27
= 32.14 times

The company had been holding an inventory
of 365/7.2= 51 days (approx) during 2010-11
but the holding has risen to approx 53 days.

2. Turnover Ratio
Inventory Turnover
Ratio = CoGS/ Avg
Inventory
Debtors Turnover
Ratio = Total Sales/
Drs

When seen in isolation, while the liquidity has
reduced from 2011 to 2012, the overall
liquidity of both the years appears to be
unsatisfactory since there is a very low margin
of safety in both the years.
In a case wherein inventories do not sell, the
company has pretty low Quick Ratios; overall
unsatisfactory for both the years.
Even though overall Cash Ratio has declined
from 2011 to 2012, considering bank credit
available and standing/credibility of the
company concerned, it does not look
worrisome.

Misc

Even though the overall figures have declined,
the company still maintains a healthy ratio
since even with reduced ratio in 2011-12, the
average collection period(ACP) is as low as
365/32.14 = 11 days (approx) and Drs are just
about 3% approx. of total sales, the stats look
healthy and assuring.

For these calculations, loans
and advances (146.93 and
143.92) have not been counted
in since same do not fall under
the category og marketable
securities.

1. Details of Credit Sales and
Average Drs not known.
2. Since the goods are not
seasonal, the formula being
used is logical.
3. Cr policy of the company is
not known.
Creditors Turnover
Ratio

750,35.73 /
491.84= 152.5

Asset Turnover
Ratio
Net Assets
Turnover Ratio
= Sales/NA

2,381.51/
384.10 = 6.2
times

Total Assets
Turnover Ratio
=Sales/Total Assets

Fixed Asset
Turnover Ratio
=Sales/NFA
Current Asset
Turnover Asset
=Sales/CA

89527.09/
586.96=152.5

There has been no change in the figures. It
translates into an APP (average Payment
Period) of less than three days!

For every ₹of capital employed, company has
been producing ₹ (approx) of sales
6
consistently over past two years. It means that
the company is not under-utilising its assets.
2,381.51/
2,805.54/(758.68 For every ₹of investment (NFA+CA)
(739.21 +
+254.42 )= 2.7
employed, company has been producing ₹
2.5
255.04)=2.4
times
(approx) of sales consistently over past two
times
years. This is significantly lower than Net Asset
Turn Over Ratio figures.
2,381.51/255.04 2,805.54/254.42 FA are being turned over faster than CA. In
=9.33 times
=11.02 times
other words, to generate a sale of ₹1,
company needs to invest ₹0.9 in FA and ₹
2,381.51/739.21 2,805.54/758.68 0.28 (approx). However, both these ratios are
on an increase between two financial periods.
=3.22 times
=3.6 times

1. Details of Credit purchases
and Average Drs not known.
2. Separate details of credit
purchases are not available;
being assumed from the figures
given in the balance sheet.

2,805.54/ 435.39
= 6.4 times

3. Leverage Ratios
Debt Ratio = TD/
(TD+NA)

0.05/.05+384.05 0.00/435.39 =0
=0.0001

Debt Equity Ratio
= TD/NW

0.05/384.05
=0.0001

0

These ratios indicate that the company has
been financed by the owners all by
themselves since there are hardly any
borrowings from lenders.
--do----

1.Total Assets= Net Fixed
Assets+ Current Assets.
2. Figures of Net Block being
taken as NFA here.
Capital Employed
to Net Worth Ratio
= CE or NA/NW
Coverage Ratios
Interest Coverage
Ratio=EBIT/Interest

4. Profitability
Ratios
Gross Profit Margin
=GP (or SalesCoGS)/Sales
Net Profit Margin
=PAT/Sales
Return on Equity
=PAT/NW (Equity)
Return on Capital
Employed= ROI
=EBIT(1-Tax)/NA

5. Investment
Ratios
Dividend Per Share
=Dividend/No of
shares
Earnings Per Share
=PAT/No of shares
Dividend Pay Out
Ratio = DPS/EPS

384.10/384.05=
1.0001

435.39/435.39
=1

Follows the same trend as two other leverage
ratios as also the thumb rule of 1+Debt-Equity
ratio.

522.13/ 8.61
=60.64:1

588.97/1.51
=390.04:1

Very high ratios here indicate an ultraconservative approach towards usage of debt.
However, since there is hardly any debt on the
company, these figures look justified.

520.19/2,284.47 578.55/2,688.01
=0.22 = 22%
=0.21 =21%
402.58/2,284.47
=0.17 = 17%
402.58/384.05
=1.04= 104%
522.13(1-0.24)/
384.10= 1.03
= 103%

446.47/2,688.01
=0.16 = 16%
446.47/435.39
=1.02 or 102%
588.97(1-0.22)/
435.39= 1.05
= 105%

299.18Crore/
1359.93 lac
=₹
21.99
402.58 Crore/
1359.93 lac
=₹
29.60
21.99/29.60
=74%

339.98Crore/
1359.93 lac
=₹
24.99
446.47 Crore/
1359.93 lac
=₹
32.83
24.99/32.83
=76%

A bit of decline (1%) between the accounting
periods indicates declining margins.
--- do--------do----; however, returns look good when
compared to market trends in general.
With a uniform figure of 135%*, the company
is doing well.

An increase of approx. 14% (year on year)
augurs well for the stock holders.
An increase of approx. 10% is in line with
industry averages.
Translates into a situation wherein growth in
equity is 26% approximately. This is in line

*If tax component is ignored
because same is not uniform,
the ROCE will be 135% in both
the years.
Dividend Yield
Ratio = DPS/ Mkt
value per share
Price Earnings
Ratio =Mkt value
per share/EPS

21.99/1563
= 1.4%

24.99/1563
=1.5%

1563/29.60
=52.80 times

1563/32.83
=47.60 times

with industry average and it has seen an
increase of 2% between two accounting
periods.
These ratios are perfectly in sync with industry Mkt Value of one share worth
averages (competitors like Godrej, P&G, Dabur FV of ₹ = ₹1563 as on 01 Jan
1
and so on). As a company, it is earning well for 2013
its investors while staying in meaningful
competition in the market.
Appendix giving out details of the inputs used in the assignment

Balance sheet - Colgate-Palmolive (India) Ltd.

Particulars

Mar'12

Mar'11

Liabilities 12 Months 12 Months
Share Capital

13.60

13.60

Reserves & Surplus

421.79

370.45

Net Worth

435.39

384.05

Secured Loans

0.00

0.00

Unsecured Loans

0.00

0.05

TOTAL LIABILITIES

435.39

384.10

Gross Block

522.50

579.83

(-) Acc. Depreciation

268.08

324.79

Net Block

254.42

255.04

Capital Work in Progress.

69.38

12.26

Investments.

47.12

38.74

Inventories

217.68

153.70

Sundry Debtors

87.27

42.96

Cash And Bank

309.81

395.61

Loans And Advances

143.92

146.93

Total Current Assets

758.68

739.21

Current Liabilities

586.96

491.84

Provisions

107.25

169.31

Total Current Liabilities

694.21

661.15

NET CURRENT ASSETS

64.47

78.06

Misc. Expenses

0.00

0.00

TOTAL ASSETS (A+B+C+D+E)

435.39

384.10
Profit & Loss - Colgate-Palmolive (India) Ltd.
Mar'12

Mar'11

12 Months

12 Months

INCOME:
Sales Turnover

2,805.54

2,381.51

Excise Duty

117.54

97.05

NET SALES

2,688.01

2,284.47

Other Income

0.00

0.00

TOTAL INCOME

2,737.74

2,320.66
EXPENDITURE:

Manufacturing Expenses

172.09

139.33

Material Consumed

1,055.58

881.18

Personal Expenses

215.61

193.22

Selling Expenses

0.00

422.35

Administrative Expenses

666.18

128.21

Expenses Capitalised

0.00

0.00

Provisions Made

0.00

0.00

TOTAL EXPENDITURE

2,109.46

1,764.28

Operating Profit

578.55

520.19

EBITDA

628.28

556.38

Depreciation

39.31

34.25

Other Write-offs

0.00

0.00

EBIT

588.97

522.13

Interest

1.51

8.61

EBT

587.46

513.52

Taxes

141.92

117.37

Profit and Loss for the Year

445.54

396.15

Non Recurring Items

0.29

0.29

Other Non Cash Adjustments

0.64

6.14
Other Adjustments

0.00

0.00

REPORTED PAT

446.47

402.58

KEY ITEMS
Preference Dividend

0.00

0.00

Equity Dividend

339.98

299.18

Equity Dividend (%)

2,499.99

2,199.99

Shares in Issue (Lakhs)

1,359.93

1,359.93

EPS - Annualised (Rs)

32.83

29.60

Capital Structure - Colgate-Palmolive (India) Ltd.
Authorized
Capital

Issued
Capital

(Rs. cr)

Period Instrument

(Rs. cr)

Shares
(nos)

Face
Value

Capital
(Rs.
Cr)

-PAIDUP-

From

To

2011

2012

Equity Share

137.0

13.6

135992817

1.0

13.6

2010

2011

Equity Share

137.0

13.6

135992817

1.0

13.6

2009

2010

Equity Share

137.0

13.6

135992817

1.0

13.6

Statements of Cost of Goods Sold
2011(₹ in Lacs)

2012 (₹ in Lacs)

Work-in-Process

6,08.33

10,36.30

Finished Goods

60,27.50

77,73.62

Add : Stock taken over on Amalgamation
of a Subsidiary

14,55.51

23,05.20

particular
Opening Stock

81,09.41

111,15.12

Raw and Packing Materials Consumed
Opening Stock

23,89.52

47,87.99

Add : Stock taken over on Amalgamation
of a Subsidiary

74.34

------

Add : Purchases

750,35.73

89527.09

774,99.59

943,15.08

35,47.71

49,28.10

739,51.88

893,86.98

Less : Closing Stock

820,61.29
Purchased Finished Goods

100,502.10
162,29.76

199,69.59

Less : Closing Stock
Work-in-Process

10,36.30

8,33.73

Finished Goods

77,73.62

103,49.57

Stock-in-trade

23,05.20

47,87.99
(-) 111,15.12

Excise Duty on Finished Goods
Cost of goods sold

20.65

871,96.58

(-) 159,71.29
5,21.77

1,050,22.17
Era Business School, Dwarka

ASSIGNMENT: CF

Group Members

NavdeepDahiya

-

0121pg005

Manoj Kajla

-

0121pg036

Col AK Raina, SM

-

0121pg014
(P.S.: Ratios have been worked out based on the data that has been placed as appendix after the ratios)

Weitere ähnliche Inhalte

Was ist angesagt?

Parle products ltd.
Parle products ltd.Parle products ltd.
Parle products ltd.ranajankiba
 
Britannia Company - Success story of a brand in a developing country
Britannia Company - Success story of a brand in a developing countryBritannia Company - Success story of a brand in a developing country
Britannia Company - Success story of a brand in a developing countryPHD Worldwide
 
Marketing Strategies in Ambuja Cement
Marketing Strategies in Ambuja CementMarketing Strategies in Ambuja Cement
Marketing Strategies in Ambuja CementYug Bokadia
 
Parker penning global strategy
Parker   penning global strategyParker   penning global strategy
Parker penning global strategyNilos Emelianenko
 
Amul - Marketing Plan
Amul - Marketing PlanAmul - Marketing Plan
Amul - Marketing PlanDisha Bedi
 
Stp & 4 p's of ACC cement ltd.
Stp & 4 p's of ACC cement ltd.Stp & 4 p's of ACC cement ltd.
Stp & 4 p's of ACC cement ltd.SHIVAMSHARMA1271
 
Marketing Project on Pen
Marketing Project on PenMarketing Project on Pen
Marketing Project on PenRahil Jain
 
Financial analysis : Britannia Industries Ltd
Financial analysis :  Britannia Industries LtdFinancial analysis :  Britannia Industries Ltd
Financial analysis : Britannia Industries LtdKaustubh Gupta
 
Marketing project maggi
Marketing project   maggiMarketing project   maggi
Marketing project maggitinuupadhyay
 
Management of Working Capital- Britannia Industries Ltd.
Management of Working Capital- Britannia Industries Ltd.Management of Working Capital- Britannia Industries Ltd.
Management of Working Capital- Britannia Industries Ltd.Nikita Jangid
 
COLGATE product life cycle
COLGATE product life cycleCOLGATE product life cycle
COLGATE product life cyclesahrudayaartz
 
Marketing management project on shoes. class 12th
Marketing management project on shoes. class 12thMarketing management project on shoes. class 12th
Marketing management project on shoes. class 12thTazkeerKhan
 

Was ist angesagt? (20)

Parle products ltd.
Parle products ltd.Parle products ltd.
Parle products ltd.
 
Britannia group- 11
Britannia   group- 11Britannia   group- 11
Britannia group- 11
 
Britannia Company - Success story of a brand in a developing country
Britannia Company - Success story of a brand in a developing countryBritannia Company - Success story of a brand in a developing country
Britannia Company - Success story of a brand in a developing country
 
Marketing Strategies in Ambuja Cement
Marketing Strategies in Ambuja CementMarketing Strategies in Ambuja Cement
Marketing Strategies in Ambuja Cement
 
Dabur
DaburDabur
Dabur
 
HUL BCG MATRIX
HUL BCG MATRIXHUL BCG MATRIX
HUL BCG MATRIX
 
Parker penning global strategy
Parker   penning global strategyParker   penning global strategy
Parker penning global strategy
 
Parle G Introduction
Parle G IntroductionParle G Introduction
Parle G Introduction
 
Amul - Marketing Plan
Amul - Marketing PlanAmul - Marketing Plan
Amul - Marketing Plan
 
Gcpl
GcplGcpl
Gcpl
 
Colgate
ColgateColgate
Colgate
 
Colgate new
Colgate newColgate new
Colgate new
 
Stp & 4 p's of ACC cement ltd.
Stp & 4 p's of ACC cement ltd.Stp & 4 p's of ACC cement ltd.
Stp & 4 p's of ACC cement ltd.
 
Marketing Project on Pen
Marketing Project on PenMarketing Project on Pen
Marketing Project on Pen
 
Financial analysis : Britannia Industries Ltd
Financial analysis :  Britannia Industries LtdFinancial analysis :  Britannia Industries Ltd
Financial analysis : Britannia Industries Ltd
 
Marketing project maggi
Marketing project   maggiMarketing project   maggi
Marketing project maggi
 
Management of Working Capital- Britannia Industries Ltd.
Management of Working Capital- Britannia Industries Ltd.Management of Working Capital- Britannia Industries Ltd.
Management of Working Capital- Britannia Industries Ltd.
 
COLGATE product life cycle
COLGATE product life cycleCOLGATE product life cycle
COLGATE product life cycle
 
Marketing management project on shoes. class 12th
Marketing management project on shoes. class 12thMarketing management project on shoes. class 12th
Marketing management project on shoes. class 12th
 
Dabur
DaburDabur
Dabur
 

Ähnlich wie Analyzing Liquidity, Turnover and Profitability Ratios of Colgate-Palmolive

Financial statement of Steel Ind..
Financial statement of Steel Ind..Financial statement of Steel Ind..
Financial statement of Steel Ind..ashoo2005
 
Basic principle of financial statement analysis
Basic principle of financial statement analysisBasic principle of financial statement analysis
Basic principle of financial statement analysiskhomsasatun
 
Financial Analysis 3.pptx
Financial Analysis 3.pptxFinancial Analysis 3.pptx
Financial Analysis 3.pptxNadeemSRimawi
 
How to calculate industry's capm ,pe ratio ggm,
How to calculate industry's capm ,pe ratio ggm,How to calculate industry's capm ,pe ratio ggm,
How to calculate industry's capm ,pe ratio ggm,Komal Bhandare
 
Ratio-Analysis of Asian Paints
Ratio-Analysis of Asian PaintsRatio-Analysis of Asian Paints
Ratio-Analysis of Asian PaintsSavita Marwal
 
Financial analysis of_sbi
Financial analysis of_sbiFinancial analysis of_sbi
Financial analysis of_sbiVishal Kapoor
 
Profitability of sbi
Profitability of sbiProfitability of sbi
Profitability of sbiSandeep Rai
 
Cox & Kings Financial Ratios
Cox & Kings Financial RatiosCox & Kings Financial Ratios
Cox & Kings Financial RatiosSantosh Hegde
 
Financial analysis of TATA TELESERVICES LTD
Financial analysis of TATA TELESERVICES LTDFinancial analysis of TATA TELESERVICES LTD
Financial analysis of TATA TELESERVICES LTDKHALIL AHMAD
 
Case Study on comparative finacial performance of BATA India & Shopper's Stop
Case Study on comparative finacial performance of BATA India & Shopper's Stop Case Study on comparative finacial performance of BATA India & Shopper's Stop
Case Study on comparative finacial performance of BATA India & Shopper's Stop Amitava Sengupta
 
Research report first source solution
Research report first source solutionResearch report first source solution
Research report first source solutionPreeti Srivastava
 
Stock Analysis of HDFC Bank.pptx
Stock Analysis of HDFC Bank.pptxStock Analysis of HDFC Bank.pptx
Stock Analysis of HDFC Bank.pptxAdarshSingh749984
 
Reasonable Investigation PowerPoint Presentation Slides
Reasonable Investigation PowerPoint Presentation Slides Reasonable Investigation PowerPoint Presentation Slides
Reasonable Investigation PowerPoint Presentation Slides SlideTeam
 
Yes bank balance sheet
Yes bank balance sheetYes bank balance sheet
Yes bank balance sheetAnujsingh11841
 

Ähnlich wie Analyzing Liquidity, Turnover and Profitability Ratios of Colgate-Palmolive (20)

Financial statement of Steel Ind..
Financial statement of Steel Ind..Financial statement of Steel Ind..
Financial statement of Steel Ind..
 
financial accounting
financial accounting financial accounting
financial accounting
 
Basic principle of financial statement analysis
Basic principle of financial statement analysisBasic principle of financial statement analysis
Basic principle of financial statement analysis
 
Financial Analysis 3.pptx
Financial Analysis 3.pptxFinancial Analysis 3.pptx
Financial Analysis 3.pptx
 
How to calculate industry's capm ,pe ratio ggm,
How to calculate industry's capm ,pe ratio ggm,How to calculate industry's capm ,pe ratio ggm,
How to calculate industry's capm ,pe ratio ggm,
 
Ratio-Analysis of Asian Paints
Ratio-Analysis of Asian PaintsRatio-Analysis of Asian Paints
Ratio-Analysis of Asian Paints
 
Financial analysis of_sbi
Financial analysis of_sbiFinancial analysis of_sbi
Financial analysis of_sbi
 
wasif file
wasif filewasif file
wasif file
 
Profitability of sbi
Profitability of sbiProfitability of sbi
Profitability of sbi
 
Cox & Kings Financial Ratios
Cox & Kings Financial RatiosCox & Kings Financial Ratios
Cox & Kings Financial Ratios
 
Kansai Nerolac Paints
Kansai Nerolac PaintsKansai Nerolac Paints
Kansai Nerolac Paints
 
Financial analysis of TATA TELESERVICES LTD
Financial analysis of TATA TELESERVICES LTDFinancial analysis of TATA TELESERVICES LTD
Financial analysis of TATA TELESERVICES LTD
 
Case Study on comparative finacial performance of BATA India & Shopper's Stop
Case Study on comparative finacial performance of BATA India & Shopper's Stop Case Study on comparative finacial performance of BATA India & Shopper's Stop
Case Study on comparative finacial performance of BATA India & Shopper's Stop
 
Research report first source solution
Research report first source solutionResearch report first source solution
Research report first source solution
 
Stock Analysis of HDFC Bank.pptx
Stock Analysis of HDFC Bank.pptxStock Analysis of HDFC Bank.pptx
Stock Analysis of HDFC Bank.pptx
 
Reasonable Investigation PowerPoint Presentation Slides
Reasonable Investigation PowerPoint Presentation Slides Reasonable Investigation PowerPoint Presentation Slides
Reasonable Investigation PowerPoint Presentation Slides
 
1620607 cia 3
1620607 cia 31620607 cia 3
1620607 cia 3
 
ch03.ppt
ch03.pptch03.ppt
ch03.ppt
 
ch03.ppt
ch03.pptch03.ppt
ch03.ppt
 
Yes bank balance sheet
Yes bank balance sheetYes bank balance sheet
Yes bank balance sheet
 

Mehr von AJ Raina

Final Research Project Synopsis ppt for viva : Islamic Banking in India
Final Research Project Synopsis ppt for viva : Islamic Banking in IndiaFinal Research Project Synopsis ppt for viva : Islamic Banking in India
Final Research Project Synopsis ppt for viva : Islamic Banking in IndiaAJ Raina
 
Dora Tiles - a case study
Dora Tiles - a case studyDora Tiles - a case study
Dora Tiles - a case studyAJ Raina
 
Indo-Korea relations with focus on trade
Indo-Korea relations with focus on tradeIndo-Korea relations with focus on trade
Indo-Korea relations with focus on tradeAJ Raina
 
Indo- Korean Trade Relationship (text)
Indo- Korean Trade Relationship (text)Indo- Korean Trade Relationship (text)
Indo- Korean Trade Relationship (text)AJ Raina
 
SocGen’s big loss in 2008
SocGen’s big loss in 2008SocGen’s big loss in 2008
SocGen’s big loss in 2008AJ Raina
 
ITC : Diversification
ITC : DiversificationITC : Diversification
ITC : DiversificationAJ Raina
 
Fundamental analysis of HDFC Bank (ppt)
Fundamental analysis of HDFC Bank (ppt)Fundamental analysis of HDFC Bank (ppt)
Fundamental analysis of HDFC Bank (ppt)AJ Raina
 
HDFC Bank : Fundamental Analysis (Text)
HDFC Bank : Fundamental Analysis (Text)HDFC Bank : Fundamental Analysis (Text)
HDFC Bank : Fundamental Analysis (Text)AJ Raina
 
Business Proposal ppt on a Motor Cycle based Adventure Company
Business Proposal ppt on a Motor Cycle based Adventure CompanyBusiness Proposal ppt on a Motor Cycle based Adventure Company
Business Proposal ppt on a Motor Cycle based Adventure CompanyAJ Raina
 
Motorcyle gypsies - a business proposal document
Motorcyle gypsies - a business proposal documentMotorcyle gypsies - a business proposal document
Motorcyle gypsies - a business proposal documentAJ Raina
 
MCX - what happened?
MCX - what happened?MCX - what happened?
MCX - what happened?AJ Raina
 
PART ANALYSIS OF CHAPTER NO 3 : BROADENING ACCESS TO FINANCE (From the Study ...
PART ANALYSIS OF CHAPTER NO 3 : BROADENING ACCESS TO FINANCE (From the Study ...PART ANALYSIS OF CHAPTER NO 3 : BROADENING ACCESS TO FINANCE (From the Study ...
PART ANALYSIS OF CHAPTER NO 3 : BROADENING ACCESS TO FINANCE (From the Study ...AJ Raina
 
Retail Management Case Study on SUPER SHAMPOO
Retail Management Case Study on SUPER SHAMPOORetail Management Case Study on SUPER SHAMPOO
Retail Management Case Study on SUPER SHAMPOOAJ Raina
 
MIS ppt on Business Process
MIS ppt on Business ProcessMIS ppt on Business Process
MIS ppt on Business ProcessAJ Raina
 
Case Study on GETTING AIRLINES ALLIANCES OFF THE GROUND
Case Study on GETTING AIRLINES  ALLIANCES OFF THE GROUNDCase Study on GETTING AIRLINES  ALLIANCES OFF THE GROUND
Case Study on GETTING AIRLINES ALLIANCES OFF THE GROUNDAJ Raina
 
Consumer Behaviour : Usage Situation
Consumer Behaviour : Usage SituationConsumer Behaviour : Usage Situation
Consumer Behaviour : Usage SituationAJ Raina
 
The collapse de-enron; Collapse of Enron
The collapse de-enron; Collapse of EnronThe collapse de-enron; Collapse of Enron
The collapse de-enron; Collapse of EnronAJ Raina
 
Business letter sample
Business letter sampleBusiness letter sample
Business letter sampleAJ Raina
 
Paradigmatic Challenges in India’s Consumer Market: A Report
Paradigmatic Challenges in India’s Consumer Market: A ReportParadigmatic Challenges in India’s Consumer Market: A Report
Paradigmatic Challenges in India’s Consumer Market: A ReportAJ Raina
 
Values - organisational behaviour
Values - organisational behaviourValues - organisational behaviour
Values - organisational behaviourAJ Raina
 

Mehr von AJ Raina (20)

Final Research Project Synopsis ppt for viva : Islamic Banking in India
Final Research Project Synopsis ppt for viva : Islamic Banking in IndiaFinal Research Project Synopsis ppt for viva : Islamic Banking in India
Final Research Project Synopsis ppt for viva : Islamic Banking in India
 
Dora Tiles - a case study
Dora Tiles - a case studyDora Tiles - a case study
Dora Tiles - a case study
 
Indo-Korea relations with focus on trade
Indo-Korea relations with focus on tradeIndo-Korea relations with focus on trade
Indo-Korea relations with focus on trade
 
Indo- Korean Trade Relationship (text)
Indo- Korean Trade Relationship (text)Indo- Korean Trade Relationship (text)
Indo- Korean Trade Relationship (text)
 
SocGen’s big loss in 2008
SocGen’s big loss in 2008SocGen’s big loss in 2008
SocGen’s big loss in 2008
 
ITC : Diversification
ITC : DiversificationITC : Diversification
ITC : Diversification
 
Fundamental analysis of HDFC Bank (ppt)
Fundamental analysis of HDFC Bank (ppt)Fundamental analysis of HDFC Bank (ppt)
Fundamental analysis of HDFC Bank (ppt)
 
HDFC Bank : Fundamental Analysis (Text)
HDFC Bank : Fundamental Analysis (Text)HDFC Bank : Fundamental Analysis (Text)
HDFC Bank : Fundamental Analysis (Text)
 
Business Proposal ppt on a Motor Cycle based Adventure Company
Business Proposal ppt on a Motor Cycle based Adventure CompanyBusiness Proposal ppt on a Motor Cycle based Adventure Company
Business Proposal ppt on a Motor Cycle based Adventure Company
 
Motorcyle gypsies - a business proposal document
Motorcyle gypsies - a business proposal documentMotorcyle gypsies - a business proposal document
Motorcyle gypsies - a business proposal document
 
MCX - what happened?
MCX - what happened?MCX - what happened?
MCX - what happened?
 
PART ANALYSIS OF CHAPTER NO 3 : BROADENING ACCESS TO FINANCE (From the Study ...
PART ANALYSIS OF CHAPTER NO 3 : BROADENING ACCESS TO FINANCE (From the Study ...PART ANALYSIS OF CHAPTER NO 3 : BROADENING ACCESS TO FINANCE (From the Study ...
PART ANALYSIS OF CHAPTER NO 3 : BROADENING ACCESS TO FINANCE (From the Study ...
 
Retail Management Case Study on SUPER SHAMPOO
Retail Management Case Study on SUPER SHAMPOORetail Management Case Study on SUPER SHAMPOO
Retail Management Case Study on SUPER SHAMPOO
 
MIS ppt on Business Process
MIS ppt on Business ProcessMIS ppt on Business Process
MIS ppt on Business Process
 
Case Study on GETTING AIRLINES ALLIANCES OFF THE GROUND
Case Study on GETTING AIRLINES  ALLIANCES OFF THE GROUNDCase Study on GETTING AIRLINES  ALLIANCES OFF THE GROUND
Case Study on GETTING AIRLINES ALLIANCES OFF THE GROUND
 
Consumer Behaviour : Usage Situation
Consumer Behaviour : Usage SituationConsumer Behaviour : Usage Situation
Consumer Behaviour : Usage Situation
 
The collapse de-enron; Collapse of Enron
The collapse de-enron; Collapse of EnronThe collapse de-enron; Collapse of Enron
The collapse de-enron; Collapse of Enron
 
Business letter sample
Business letter sampleBusiness letter sample
Business letter sample
 
Paradigmatic Challenges in India’s Consumer Market: A Report
Paradigmatic Challenges in India’s Consumer Market: A ReportParadigmatic Challenges in India’s Consumer Market: A Report
Paradigmatic Challenges in India’s Consumer Market: A Report
 
Values - organisational behaviour
Values - organisational behaviourValues - organisational behaviour
Values - organisational behaviour
 

Kürzlich hochgeladen

0183760ssssssssssssssssssssssssssss00101011 (27).pdf
0183760ssssssssssssssssssssssssssss00101011 (27).pdf0183760ssssssssssssssssssssssssssss00101011 (27).pdf
0183760ssssssssssssssssssssssssssss00101011 (27).pdfRenandantas16
 
MONA 98765-12871 CALL GIRLS IN LUDHIANA LUDHIANA CALL GIRL
MONA 98765-12871 CALL GIRLS IN LUDHIANA LUDHIANA CALL GIRLMONA 98765-12871 CALL GIRLS IN LUDHIANA LUDHIANA CALL GIRL
MONA 98765-12871 CALL GIRLS IN LUDHIANA LUDHIANA CALL GIRLSeo
 
Progress Report - Oracle Database Analyst Summit
Progress  Report - Oracle Database Analyst SummitProgress  Report - Oracle Database Analyst Summit
Progress Report - Oracle Database Analyst SummitHolger Mueller
 
Socio-economic-Impact-of-business-consumers-suppliers-and.pptx
Socio-economic-Impact-of-business-consumers-suppliers-and.pptxSocio-economic-Impact-of-business-consumers-suppliers-and.pptx
Socio-economic-Impact-of-business-consumers-suppliers-and.pptxtrishalcan8
 
Ensure the security of your HCL environment by applying the Zero Trust princi...
Ensure the security of your HCL environment by applying the Zero Trust princi...Ensure the security of your HCL environment by applying the Zero Trust princi...
Ensure the security of your HCL environment by applying the Zero Trust princi...Roland Driesen
 
Monthly Social Media Update April 2024 pptx.pptx
Monthly Social Media Update April 2024 pptx.pptxMonthly Social Media Update April 2024 pptx.pptx
Monthly Social Media Update April 2024 pptx.pptxAndy Lambert
 
Catalogue ONG NUOC PPR DE NHAT .pdf
Catalogue ONG NUOC PPR DE NHAT      .pdfCatalogue ONG NUOC PPR DE NHAT      .pdf
Catalogue ONG NUOC PPR DE NHAT .pdfOrient Homes
 
A DAY IN THE LIFE OF A SALESMAN / WOMAN
A DAY IN THE LIFE OF A  SALESMAN / WOMANA DAY IN THE LIFE OF A  SALESMAN / WOMAN
A DAY IN THE LIFE OF A SALESMAN / WOMANIlamathiKannappan
 
DEPED Work From Home WORKWEEK-PLAN.docx
DEPED Work From Home  WORKWEEK-PLAN.docxDEPED Work From Home  WORKWEEK-PLAN.docx
DEPED Work From Home WORKWEEK-PLAN.docxRodelinaLaud
 
GD Birla and his contribution in management
GD Birla and his contribution in managementGD Birla and his contribution in management
GD Birla and his contribution in managementchhavia330
 
Best VIP Call Girls Noida Sector 40 Call Me: 8448380779
Best VIP Call Girls Noida Sector 40 Call Me: 8448380779Best VIP Call Girls Noida Sector 40 Call Me: 8448380779
Best VIP Call Girls Noida Sector 40 Call Me: 8448380779Delhi Call girls
 
It will be International Nurses' Day on 12 May
It will be International Nurses' Day on 12 MayIt will be International Nurses' Day on 12 May
It will be International Nurses' Day on 12 MayNZSG
 
Pharma Works Profile of Karan Communications
Pharma Works Profile of Karan CommunicationsPharma Works Profile of Karan Communications
Pharma Works Profile of Karan Communicationskarancommunications
 
Cash Payment 9602870969 Escort Service in Udaipur Call Girls
Cash Payment 9602870969 Escort Service in Udaipur Call GirlsCash Payment 9602870969 Escort Service in Udaipur Call Girls
Cash Payment 9602870969 Escort Service in Udaipur Call GirlsApsara Of India
 
Call Girls in Gomti Nagar - 7388211116 - With room Service
Call Girls in Gomti Nagar - 7388211116  - With room ServiceCall Girls in Gomti Nagar - 7388211116  - With room Service
Call Girls in Gomti Nagar - 7388211116 - With room Servicediscovermytutordmt
 
Vip Dewas Call Girls #9907093804 Contact Number Escorts Service Dewas
Vip Dewas Call Girls #9907093804 Contact Number Escorts Service DewasVip Dewas Call Girls #9907093804 Contact Number Escorts Service Dewas
Vip Dewas Call Girls #9907093804 Contact Number Escorts Service Dewasmakika9823
 
Creating Low-Code Loan Applications using the Trisotech Mortgage Feature Set
Creating Low-Code Loan Applications using the Trisotech Mortgage Feature SetCreating Low-Code Loan Applications using the Trisotech Mortgage Feature Set
Creating Low-Code Loan Applications using the Trisotech Mortgage Feature SetDenis Gagné
 
Catalogue ONG NƯỚC uPVC - HDPE DE NHAT.pdf
Catalogue ONG NƯỚC uPVC - HDPE DE NHAT.pdfCatalogue ONG NƯỚC uPVC - HDPE DE NHAT.pdf
Catalogue ONG NƯỚC uPVC - HDPE DE NHAT.pdfOrient Homes
 

Kürzlich hochgeladen (20)

0183760ssssssssssssssssssssssssssss00101011 (27).pdf
0183760ssssssssssssssssssssssssssss00101011 (27).pdf0183760ssssssssssssssssssssssssssss00101011 (27).pdf
0183760ssssssssssssssssssssssssssss00101011 (27).pdf
 
MONA 98765-12871 CALL GIRLS IN LUDHIANA LUDHIANA CALL GIRL
MONA 98765-12871 CALL GIRLS IN LUDHIANA LUDHIANA CALL GIRLMONA 98765-12871 CALL GIRLS IN LUDHIANA LUDHIANA CALL GIRL
MONA 98765-12871 CALL GIRLS IN LUDHIANA LUDHIANA CALL GIRL
 
Progress Report - Oracle Database Analyst Summit
Progress  Report - Oracle Database Analyst SummitProgress  Report - Oracle Database Analyst Summit
Progress Report - Oracle Database Analyst Summit
 
Socio-economic-Impact-of-business-consumers-suppliers-and.pptx
Socio-economic-Impact-of-business-consumers-suppliers-and.pptxSocio-economic-Impact-of-business-consumers-suppliers-and.pptx
Socio-economic-Impact-of-business-consumers-suppliers-and.pptx
 
Ensure the security of your HCL environment by applying the Zero Trust princi...
Ensure the security of your HCL environment by applying the Zero Trust princi...Ensure the security of your HCL environment by applying the Zero Trust princi...
Ensure the security of your HCL environment by applying the Zero Trust princi...
 
Monthly Social Media Update April 2024 pptx.pptx
Monthly Social Media Update April 2024 pptx.pptxMonthly Social Media Update April 2024 pptx.pptx
Monthly Social Media Update April 2024 pptx.pptx
 
Catalogue ONG NUOC PPR DE NHAT .pdf
Catalogue ONG NUOC PPR DE NHAT      .pdfCatalogue ONG NUOC PPR DE NHAT      .pdf
Catalogue ONG NUOC PPR DE NHAT .pdf
 
A DAY IN THE LIFE OF A SALESMAN / WOMAN
A DAY IN THE LIFE OF A  SALESMAN / WOMANA DAY IN THE LIFE OF A  SALESMAN / WOMAN
A DAY IN THE LIFE OF A SALESMAN / WOMAN
 
DEPED Work From Home WORKWEEK-PLAN.docx
DEPED Work From Home  WORKWEEK-PLAN.docxDEPED Work From Home  WORKWEEK-PLAN.docx
DEPED Work From Home WORKWEEK-PLAN.docx
 
GD Birla and his contribution in management
GD Birla and his contribution in managementGD Birla and his contribution in management
GD Birla and his contribution in management
 
Best VIP Call Girls Noida Sector 40 Call Me: 8448380779
Best VIP Call Girls Noida Sector 40 Call Me: 8448380779Best VIP Call Girls Noida Sector 40 Call Me: 8448380779
Best VIP Call Girls Noida Sector 40 Call Me: 8448380779
 
Forklift Operations: Safety through Cartoons
Forklift Operations: Safety through CartoonsForklift Operations: Safety through Cartoons
Forklift Operations: Safety through Cartoons
 
It will be International Nurses' Day on 12 May
It will be International Nurses' Day on 12 MayIt will be International Nurses' Day on 12 May
It will be International Nurses' Day on 12 May
 
Pharma Works Profile of Karan Communications
Pharma Works Profile of Karan CommunicationsPharma Works Profile of Karan Communications
Pharma Works Profile of Karan Communications
 
Cash Payment 9602870969 Escort Service in Udaipur Call Girls
Cash Payment 9602870969 Escort Service in Udaipur Call GirlsCash Payment 9602870969 Escort Service in Udaipur Call Girls
Cash Payment 9602870969 Escort Service in Udaipur Call Girls
 
Call Girls in Gomti Nagar - 7388211116 - With room Service
Call Girls in Gomti Nagar - 7388211116  - With room ServiceCall Girls in Gomti Nagar - 7388211116  - With room Service
Call Girls in Gomti Nagar - 7388211116 - With room Service
 
Vip Dewas Call Girls #9907093804 Contact Number Escorts Service Dewas
Vip Dewas Call Girls #9907093804 Contact Number Escorts Service DewasVip Dewas Call Girls #9907093804 Contact Number Escorts Service Dewas
Vip Dewas Call Girls #9907093804 Contact Number Escorts Service Dewas
 
Creating Low-Code Loan Applications using the Trisotech Mortgage Feature Set
Creating Low-Code Loan Applications using the Trisotech Mortgage Feature SetCreating Low-Code Loan Applications using the Trisotech Mortgage Feature Set
Creating Low-Code Loan Applications using the Trisotech Mortgage Feature Set
 
KestrelPro Flyer Japan IT Week 2024 (English)
KestrelPro Flyer Japan IT Week 2024 (English)KestrelPro Flyer Japan IT Week 2024 (English)
KestrelPro Flyer Japan IT Week 2024 (English)
 
Catalogue ONG NƯỚC uPVC - HDPE DE NHAT.pdf
Catalogue ONG NƯỚC uPVC - HDPE DE NHAT.pdfCatalogue ONG NƯỚC uPVC - HDPE DE NHAT.pdf
Catalogue ONG NƯỚC uPVC - HDPE DE NHAT.pdf
 

Analyzing Liquidity, Turnover and Profitability Ratios of Colgate-Palmolive

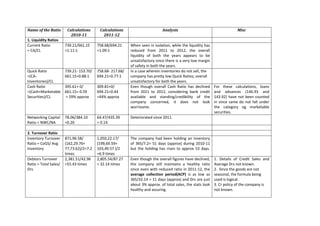
  • 1. Name of the Ratio 1. Liquidity Ratios Current Ratio = CA/CL Calculations 2010-11 Calculations 2011-12 Analysis 739.21/661.15 =1.11:1 758.68/694.21 =1.09:1 Quick Ratio =(CAInventories)/CL Cash Ratio =(Cash+Marketable Securities)/CL 739.21- 153.70/ 661.15=0.88:1 758.68- 217.68/ 694.21=0.77:1 395.61+ 0/ 661.15= 0.59 = 59% approx 309.81+0/ 694.21=0.44 =44% approx Networking Capital Ratio = NWC/NA 78.06/384.10 =0.20 64.47/435.39 = 0.14 Deteriorated since 2011. 871,96.58/ (162,29.76+ 77,73.62)/2=7.2 times 2,381.51/42.96 =55.43 times 1,050,22.17/ (199,69.59+ 103,49.57 )/2 =6.9 times 2,805.54/87.27 = 32.14 times The company had been holding an inventory of 365/7.2= 51 days (approx) during 2010-11 but the holding has risen to approx 53 days. 2. Turnover Ratio Inventory Turnover Ratio = CoGS/ Avg Inventory Debtors Turnover Ratio = Total Sales/ Drs When seen in isolation, while the liquidity has reduced from 2011 to 2012, the overall liquidity of both the years appears to be unsatisfactory since there is a very low margin of safety in both the years. In a case wherein inventories do not sell, the company has pretty low Quick Ratios; overall unsatisfactory for both the years. Even though overall Cash Ratio has declined from 2011 to 2012, considering bank credit available and standing/credibility of the company concerned, it does not look worrisome. Misc Even though the overall figures have declined, the company still maintains a healthy ratio since even with reduced ratio in 2011-12, the average collection period(ACP) is as low as 365/32.14 = 11 days (approx) and Drs are just about 3% approx. of total sales, the stats look healthy and assuring. For these calculations, loans and advances (146.93 and 143.92) have not been counted in since same do not fall under the category og marketable securities. 1. Details of Credit Sales and Average Drs not known. 2. Since the goods are not seasonal, the formula being used is logical. 3. Cr policy of the company is not known.
  • 2. Creditors Turnover Ratio 750,35.73 / 491.84= 152.5 Asset Turnover Ratio Net Assets Turnover Ratio = Sales/NA 2,381.51/ 384.10 = 6.2 times Total Assets Turnover Ratio =Sales/Total Assets Fixed Asset Turnover Ratio =Sales/NFA Current Asset Turnover Asset =Sales/CA 89527.09/ 586.96=152.5 There has been no change in the figures. It translates into an APP (average Payment Period) of less than three days! For every ₹of capital employed, company has been producing ₹ (approx) of sales 6 consistently over past two years. It means that the company is not under-utilising its assets. 2,381.51/ 2,805.54/(758.68 For every ₹of investment (NFA+CA) (739.21 + +254.42 )= 2.7 employed, company has been producing ₹ 2.5 255.04)=2.4 times (approx) of sales consistently over past two times years. This is significantly lower than Net Asset Turn Over Ratio figures. 2,381.51/255.04 2,805.54/254.42 FA are being turned over faster than CA. In =9.33 times =11.02 times other words, to generate a sale of ₹1, company needs to invest ₹0.9 in FA and ₹ 2,381.51/739.21 2,805.54/758.68 0.28 (approx). However, both these ratios are on an increase between two financial periods. =3.22 times =3.6 times 1. Details of Credit purchases and Average Drs not known. 2. Separate details of credit purchases are not available; being assumed from the figures given in the balance sheet. 2,805.54/ 435.39 = 6.4 times 3. Leverage Ratios Debt Ratio = TD/ (TD+NA) 0.05/.05+384.05 0.00/435.39 =0 =0.0001 Debt Equity Ratio = TD/NW 0.05/384.05 =0.0001 0 These ratios indicate that the company has been financed by the owners all by themselves since there are hardly any borrowings from lenders. --do---- 1.Total Assets= Net Fixed Assets+ Current Assets. 2. Figures of Net Block being taken as NFA here.
  • 3. Capital Employed to Net Worth Ratio = CE or NA/NW Coverage Ratios Interest Coverage Ratio=EBIT/Interest 4. Profitability Ratios Gross Profit Margin =GP (or SalesCoGS)/Sales Net Profit Margin =PAT/Sales Return on Equity =PAT/NW (Equity) Return on Capital Employed= ROI =EBIT(1-Tax)/NA 5. Investment Ratios Dividend Per Share =Dividend/No of shares Earnings Per Share =PAT/No of shares Dividend Pay Out Ratio = DPS/EPS 384.10/384.05= 1.0001 435.39/435.39 =1 Follows the same trend as two other leverage ratios as also the thumb rule of 1+Debt-Equity ratio. 522.13/ 8.61 =60.64:1 588.97/1.51 =390.04:1 Very high ratios here indicate an ultraconservative approach towards usage of debt. However, since there is hardly any debt on the company, these figures look justified. 520.19/2,284.47 578.55/2,688.01 =0.22 = 22% =0.21 =21% 402.58/2,284.47 =0.17 = 17% 402.58/384.05 =1.04= 104% 522.13(1-0.24)/ 384.10= 1.03 = 103% 446.47/2,688.01 =0.16 = 16% 446.47/435.39 =1.02 or 102% 588.97(1-0.22)/ 435.39= 1.05 = 105% 299.18Crore/ 1359.93 lac =₹ 21.99 402.58 Crore/ 1359.93 lac =₹ 29.60 21.99/29.60 =74% 339.98Crore/ 1359.93 lac =₹ 24.99 446.47 Crore/ 1359.93 lac =₹ 32.83 24.99/32.83 =76% A bit of decline (1%) between the accounting periods indicates declining margins. --- do--------do----; however, returns look good when compared to market trends in general. With a uniform figure of 135%*, the company is doing well. An increase of approx. 14% (year on year) augurs well for the stock holders. An increase of approx. 10% is in line with industry averages. Translates into a situation wherein growth in equity is 26% approximately. This is in line *If tax component is ignored because same is not uniform, the ROCE will be 135% in both the years.
  • 4. Dividend Yield Ratio = DPS/ Mkt value per share Price Earnings Ratio =Mkt value per share/EPS 21.99/1563 = 1.4% 24.99/1563 =1.5% 1563/29.60 =52.80 times 1563/32.83 =47.60 times with industry average and it has seen an increase of 2% between two accounting periods. These ratios are perfectly in sync with industry Mkt Value of one share worth averages (competitors like Godrej, P&G, Dabur FV of ₹ = ₹1563 as on 01 Jan 1 and so on). As a company, it is earning well for 2013 its investors while staying in meaningful competition in the market.
  • 5. Appendix giving out details of the inputs used in the assignment Balance sheet - Colgate-Palmolive (India) Ltd. Particulars Mar'12 Mar'11 Liabilities 12 Months 12 Months Share Capital 13.60 13.60 Reserves & Surplus 421.79 370.45 Net Worth 435.39 384.05 Secured Loans 0.00 0.00 Unsecured Loans 0.00 0.05 TOTAL LIABILITIES 435.39 384.10 Gross Block 522.50 579.83 (-) Acc. Depreciation 268.08 324.79 Net Block 254.42 255.04 Capital Work in Progress. 69.38 12.26 Investments. 47.12 38.74 Inventories 217.68 153.70 Sundry Debtors 87.27 42.96 Cash And Bank 309.81 395.61 Loans And Advances 143.92 146.93 Total Current Assets 758.68 739.21 Current Liabilities 586.96 491.84 Provisions 107.25 169.31 Total Current Liabilities 694.21 661.15 NET CURRENT ASSETS 64.47 78.06 Misc. Expenses 0.00 0.00 TOTAL ASSETS (A+B+C+D+E) 435.39 384.10
  • 6. Profit & Loss - Colgate-Palmolive (India) Ltd. Mar'12 Mar'11 12 Months 12 Months INCOME: Sales Turnover 2,805.54 2,381.51 Excise Duty 117.54 97.05 NET SALES 2,688.01 2,284.47 Other Income 0.00 0.00 TOTAL INCOME 2,737.74 2,320.66 EXPENDITURE: Manufacturing Expenses 172.09 139.33 Material Consumed 1,055.58 881.18 Personal Expenses 215.61 193.22 Selling Expenses 0.00 422.35 Administrative Expenses 666.18 128.21 Expenses Capitalised 0.00 0.00 Provisions Made 0.00 0.00 TOTAL EXPENDITURE 2,109.46 1,764.28 Operating Profit 578.55 520.19 EBITDA 628.28 556.38 Depreciation 39.31 34.25 Other Write-offs 0.00 0.00 EBIT 588.97 522.13 Interest 1.51 8.61 EBT 587.46 513.52 Taxes 141.92 117.37 Profit and Loss for the Year 445.54 396.15 Non Recurring Items 0.29 0.29 Other Non Cash Adjustments 0.64 6.14
  • 7. Other Adjustments 0.00 0.00 REPORTED PAT 446.47 402.58 KEY ITEMS Preference Dividend 0.00 0.00 Equity Dividend 339.98 299.18 Equity Dividend (%) 2,499.99 2,199.99 Shares in Issue (Lakhs) 1,359.93 1,359.93 EPS - Annualised (Rs) 32.83 29.60 Capital Structure - Colgate-Palmolive (India) Ltd. Authorized Capital Issued Capital (Rs. cr) Period Instrument (Rs. cr) Shares (nos) Face Value Capital (Rs. Cr) -PAIDUP- From To 2011 2012 Equity Share 137.0 13.6 135992817 1.0 13.6 2010 2011 Equity Share 137.0 13.6 135992817 1.0 13.6 2009 2010 Equity Share 137.0 13.6 135992817 1.0 13.6 Statements of Cost of Goods Sold 2011(₹ in Lacs) 2012 (₹ in Lacs) Work-in-Process 6,08.33 10,36.30 Finished Goods 60,27.50 77,73.62 Add : Stock taken over on Amalgamation of a Subsidiary 14,55.51 23,05.20 particular Opening Stock 81,09.41 111,15.12 Raw and Packing Materials Consumed Opening Stock 23,89.52 47,87.99 Add : Stock taken over on Amalgamation of a Subsidiary 74.34 ------ Add : Purchases 750,35.73 89527.09 774,99.59 943,15.08 35,47.71 49,28.10 739,51.88 893,86.98 Less : Closing Stock 820,61.29 Purchased Finished Goods 100,502.10 162,29.76 199,69.59 Less : Closing Stock Work-in-Process 10,36.30 8,33.73 Finished Goods 77,73.62 103,49.57 Stock-in-trade 23,05.20 47,87.99 (-) 111,15.12 Excise Duty on Finished Goods Cost of goods sold 20.65 871,96.58 (-) 159,71.29 5,21.77 1,050,22.17
  • 8. Era Business School, Dwarka ASSIGNMENT: CF Group Members NavdeepDahiya - 0121pg005 Manoj Kajla - 0121pg036 Col AK Raina, SM - 0121pg014
  • 9. (P.S.: Ratios have been worked out based on the data that has been placed as appendix after the ratios)