SlideShare ist ein Scribd-Unternehmen logo
1 von 14
Historic Home Prices When adjusted for inflation, American home prices increased by an average of about half a percentage point per year from 1890 through 2008, according to data compiled by Yale University Professor Robert Shiller. ( www. USNews .com/money -  Luke Mullins, March 4, 2010)
Home Prices Now Now, however, as a result of many economic factors since 2008, the median American home prices have settled back to 2003 levels.  Source: Case Schiller Non-Seasonally Adjusted Composite 20 U.S. Home Price Index as of March 2010
Top Five Rules for Understanding the Real Estate Market: ,[object Object],[object Object],[object Object],[object Object],[object Object]
Understand the Local Market That  You are Buying into/ Selling out of…
How do we assess vitality  in our real estate markets?   By checking the  Absorption Rate .  It is the number of homes available in the market  divided by  the number of homes  that  have gone  under contract  in the past 30 days.  It is our most accurate measure  of current market  strength .
 
Market Scale for Supply & Demand Weichert has been studying market conditions for more than 3 decades and has found a direct correlation between market absorption and property values.  As absorption rates increase beyond a normal market level of 5-6 months, property values depreciate annually.   Market Absorption in Months 1 2 3 4 5 6 7 8 9 10 11 12 Normal
12/6/10 Towns Active Listings Pending in Last 30 Days Absorption Rate in Months New Listings in 30 Days Net Gain (Loss) to Market Listings Reduced in 30 Days % of Invent. Reduced Expired Listings W/drawn Listings Closed Listings Princeton Boro:  All Styles 43 2 21.5 5 3 2 4.7% 2 3 10 Pton -Boro Condo/ Thouses 16 0 99 1 1 1 6.3% 1 1 7 Pton-Boro Single Family 27 2 13.5 4 2 1 3.7% 1 2 3 Princeton Twp: All Styles 122 11 11.1 14 3 12 9.8% 3 9 12 Pton Twp: Condo/ Thouses 21 1 21 5 4 2 9.5% 1 0 1 Pton Twp: Single Family 101 10 10.1 9 -1 10 9.9% 2 9 11
12/6/10 Towns Active Listings Pending in Last 30 Days Absorption Rate in Months New Listings in 30 Days Net Gain (Loss) to Market Li1stings Reduced in 30 Days % of Invent. Reduced Expired Listings W/drawn Listings Closed Listings West Windsor:  All Styles 97 16 6.1 12 -4 25 25.8% 10 6 17 West Windsor Condo/ T.Houses 24 6 4 3 -3 7 29.2% 1 2 5 West Windsor 55+ 5 1 5 2 1 -- -- 0 1 1 West Windsor  Single Family 68 9 7.6 7 -2 18 26.5% 9 3 11 Lawrence: All Styles 189 11 17.2 30 19 27 14.3% 13 14 20 Lawrence: Condo/ THouses 65 3 21.7 10 7 14 21.5% 4 5 4 Lawrence:  55+ 14 1 14 3 2 -- -- 0 1 2 Lawrence:  Single Family 110 7 15.7 17 10 13 11.8% 9 8 14
12/6/10 Towns Active Listings Pending in Last 30 Days Absorption Rate in Months New Listings in 30 Days Net Gain (Loss) to Market Listings Reduced in 30 Days % of Invent. Reduced Expired Listings W/drawn Listings Closed Listings PlainsboroAll Styles 84 4 21 21 17 15 18% 7 0 9 Plainsboro Condo/ THouses 45 1 45 9 8 8 18% 3 0 4 Plainsboro 55+ 19 1 19 8 7 2 11% 1 0 1 Plainsboro Single Family 20 2 10 4 2 5 25% 3 0 4 Cranbury: All Styles 21 0 99 3 3 1 4% 2 0 2 Cranbury: 55+ 4 0 99 0 0 1 25% 0 0 0 Cranbury: Single Family 17 0 99 3 3 0 0 2 0 2
12/6/10 Towns Active Listings Pending in Last 30 Days Absorption Rate in Months New Listings in 30 Days Net Gain (Loss) to Market Listings Reduced in 30 Days % of Invent. Reduced Expired Listings W/drawn Listings Closed Listings Ewing:  All Styles 272 9 30.2 38 29 25 9.2% 16 12 22 Ewing : Condo/ T.Houses 36 1 36 6 5 15 41.7% 3 3 2 Ewing 55+: 8 0 99 2 2 -- -- 0 0 0 Ewing: Single Family 228 8 28.5 30 22 10 4.4% 13 9 20 East Windsor: All Styles 217 0 99 30 30 71 32.7% 14 3 12 East Windsor: Condo/ THouses 141 0 99 19 19 60 42.5% 9 2 8 East Windsor: 55+ 17 0 99 3 3 -- -- 2 0 0 East Windsor: Single Family 59 0 99 8 8 11 18.6% 3 1 4
12/6/10 Towns Active Listings Pending in Last 30 Days Absorption Rate in Months New Listings in 30 Days Net Gain (Loss) to Market Listings Reduced in 30 Days % of Invent. Reduced Expired Listings W/drawn Listings Closed Listings Hopewell Twp. All Styles 130 1 130 18 17 25 19% 16 5 4 Hopewell Twp. Condo/ T.Houses 11 0 0 2 2 3 27% 2 1 0 Hopewell Twp.: 55+ 8 0 0 1 1 -- -- 0 1 0 Hopewell Twp Single Family 111 1 111 15 14 22 20% 14 3 4 Hamilton: All Styles 588 100 6 84 -16 115 19.5% 44 25 39 Hamilton: Condo/ THouses 106 20 5 14 -6 24 23% 5 6 2 Hamilton: 55+ 38 6 6 3 -3 -- -- 1 2 4 Hamilton:  Single Family 444 74 6 67 -7 91 20% 38 17 33
12/6/10 Towns Active Listings Pending in Last 30 Days Absorption Rate in Months New Listings in 30 Days Net Gain (Loss) to Market Listings Reduced in 30 Days % of Invent. Reduced Expired Listings W/drawn Listings Closed Listings Robbinsvill All Styles 144 18 8 29 11 37 26% 13 6 11 Robbinsvill Condo/ T.Houses 64 6 11 14 9 20 31% 7 4 7 Robbinsvill Single  Family 80 12 7 15 3 7 21% 6 2 4 Hightstown Boro: All Styles 65 1 65 10 9 9 14% 8 5 4 Pennington 15 2 7.5 2 0 1 6% 1 2 3 Hopewell Boro 18 2 9 2 0 1 5% 1 2 3
12/6/10 Towns Active Listings Pending in Last 30 Days Absorption Rate in Months New Listings in 30 Days Net Gain (Loss) to Market Listings Reduced in 30 Days % of Invent. Reduced Expired Listings W/drawn Listings Closed Listings Montgomery All Styles 130 22 5.9 26 +4 21 16 16 12 16 Montgomery Condo/Twnhms 26 5 5.2 10 +5 3 11 2 2 5 Single  Family 104 17 6.1 16 -1 18 17 14 10 11 Hillsborough All Styles 259 28 9.2 25 -3 40 15 14 10 14 Hillsborough Condo/Twnhms 89 9 9.9 14 +5 21 23 5 6 5 Hillsborough Single Family 170 19 8.9 11 -8 19 11 9 4 9

Weitere ähnliche Inhalte

Was ist angesagt?

Princeton NJ Market Data april 29 10
Princeton NJ Market Data april 29 10Princeton NJ Market Data april 29 10
Princeton NJ Market Data april 29 10
Ann Harwood
 

Was ist angesagt? (20)

Princeton Area Real Estate Update5 1 14
Princeton Area Real Estate Update5 1 14Princeton Area Real Estate Update5 1 14
Princeton Area Real Estate Update5 1 14
 
Stats 7 5-10
Stats 7 5-10Stats 7 5-10
Stats 7 5-10
 
Princeton Area Real Estate Stats October 25th
Princeton Area Real Estate Stats October 25thPrinceton Area Real Estate Stats October 25th
Princeton Area Real Estate Stats October 25th
 
Market Update 10.09
Market Update 10.09Market Update 10.09
Market Update 10.09
 
Forsale
ForsaleForsale
Forsale
 
Greater Princeton NJ Real Estate Markets April 27, 2011
Greater Princeton NJ Real Estate Markets April 27, 2011Greater Princeton NJ Real Estate Markets April 27, 2011
Greater Princeton NJ Real Estate Markets April 27, 2011
 
Stats 7 12-10
Stats 7 12-10Stats 7 12-10
Stats 7 12-10
 
Town Stats January 2012
Town Stats January 2012Town Stats January 2012
Town Stats January 2012
 
Princeton Real Estate Stats 9/6/2011
Princeton Real Estate Stats 9/6/2011Princeton Real Estate Stats 9/6/2011
Princeton Real Estate Stats 9/6/2011
 
Princeton NJ Market Data april 29 10
Princeton NJ Market Data april 29 10Princeton NJ Market Data april 29 10
Princeton NJ Market Data april 29 10
 
Greater Princeton Area Market Data May 21 10
Greater Princeton Area Market Data May 21 10Greater Princeton Area Market Data May 21 10
Greater Princeton Area Market Data May 21 10
 
Sales Stats June 15, 2011
Sales Stats June 15, 2011Sales Stats June 15, 2011
Sales Stats June 15, 2011
 
Real Estate Stats by Town
Real Estate Stats by TownReal Estate Stats by Town
Real Estate Stats by Town
 
September Market Seminar Part I
September Market Seminar Part ISeptember Market Seminar Part I
September Market Seminar Part I
 
Princeton, NJ Market Report
Princeton, NJ Market ReportPrinceton, NJ Market Report
Princeton, NJ Market Report
 
November Market Update Seminar
November Market Update SeminarNovember Market Update Seminar
November Market Update Seminar
 
December 2011 Market Seminar
December 2011 Market SeminarDecember 2011 Market Seminar
December 2011 Market Seminar
 
February Princeton Market Seminar
February Princeton Market SeminarFebruary Princeton Market Seminar
February Princeton Market Seminar
 
September market seminar
September market seminarSeptember market seminar
September market seminar
 
October 2011
October 2011October 2011
October 2011
 

Andere mochten auch

Greater Princeton NJ Real Estate Market Update 1 31 13
Greater Princeton NJ Real Estate Market Update 1 31 13Greater Princeton NJ Real Estate Market Update 1 31 13
Greater Princeton NJ Real Estate Market Update 1 31 13
Ann Harwood
 

Andere mochten auch (10)

West Windsor, NJ SOLD Homes 2010
West Windsor, NJ SOLD Homes 2010West Windsor, NJ SOLD Homes 2010
West Windsor, NJ SOLD Homes 2010
 
Greater Princeton NJ Real Estate Market Update
Greater Princeton NJ Real Estate Market UpdateGreater Princeton NJ Real Estate Market Update
Greater Princeton NJ Real Estate Market Update
 
Greater Princeton Area Sold homes 2010
Greater Princeton Area Sold homes 2010Greater Princeton Area Sold homes 2010
Greater Princeton Area Sold homes 2010
 
Greater Princeton Area Real Estate Trends March 14 2013
Greater Princeton Area Real Estate Trends March 14 2013Greater Princeton Area Real Estate Trends March 14 2013
Greater Princeton Area Real Estate Trends March 14 2013
 
Greater Princeton NJ Real Estate Market Update 1 31 13
Greater Princeton NJ Real Estate Market Update 1 31 13Greater Princeton NJ Real Estate Market Update 1 31 13
Greater Princeton NJ Real Estate Market Update 1 31 13
 
Slideshare pres 7 21 15
Slideshare pres 7 21 15Slideshare pres 7 21 15
Slideshare pres 7 21 15
 
Greater Princeton NJ Area Real Estate Market Data
Greater Princeton NJ Area Real Estate Market DataGreater Princeton NJ Area Real Estate Market Data
Greater Princeton NJ Area Real Estate Market Data
 
Princeton Area Real Estate July 24 12
Princeton Area Real Estate July 24 12Princeton Area Real Estate July 24 12
Princeton Area Real Estate July 24 12
 
Princeton Area Sold homes July thru Dec 2010
Princeton Area Sold homes July thru Dec 2010Princeton Area Sold homes July thru Dec 2010
Princeton Area Sold homes July thru Dec 2010
 
Greater Princeton NJ Real Estate Market October 2012
Greater Princeton NJ Real Estate Market October 2012Greater Princeton NJ Real Estate Market October 2012
Greater Princeton NJ Real Estate Market October 2012
 

Ähnlich wie Slideshare pres dec 12 10

Ähnlich wie Slideshare pres dec 12 10 (10)

October 2009 Princeton Market Seminar
October 2009 Princeton Market SeminarOctober 2009 Princeton Market Seminar
October 2009 Princeton Market Seminar
 
Mercer County Real Estate Market Update Feb 2010
Mercer County Real Estate Market Update Feb 2010Mercer County Real Estate Market Update Feb 2010
Mercer County Real Estate Market Update Feb 2010
 
Town By Town Analysis Mercer County 8.11.09
Town By Town Analysis Mercer County 8.11.09Town By Town Analysis Mercer County 8.11.09
Town By Town Analysis Mercer County 8.11.09
 
Sales May 2010
Sales May 2010Sales May 2010
Sales May 2010
 
April Market Seminar
April Market SeminarApril Market Seminar
April Market Seminar
 
September 2010 Market Seminar
September 2010 Market SeminarSeptember 2010 Market Seminar
September 2010 Market Seminar
 
January 2011 Princeton Area Market Update
January 2011 Princeton Area Market UpdateJanuary 2011 Princeton Area Market Update
January 2011 Princeton Area Market Update
 
Princeton Twp Market Update
Princeton Twp Market UpdatePrinceton Twp Market Update
Princeton Twp Market Update
 
Market Update 6 6 11
Market Update 6 6 11Market Update 6 6 11
Market Update 6 6 11
 
Market Update 6 6 11
Market Update 6 6 11Market Update 6 6 11
Market Update 6 6 11
 

Slideshare pres dec 12 10

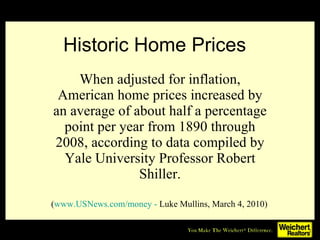
  • 1. Historic Home Prices When adjusted for inflation, American home prices increased by an average of about half a percentage point per year from 1890 through 2008, according to data compiled by Yale University Professor Robert Shiller. ( www. USNews .com/money - Luke Mullins, March 4, 2010)
  • 2. Home Prices Now Now, however, as a result of many economic factors since 2008, the median American home prices have settled back to 2003 levels. Source: Case Schiller Non-Seasonally Adjusted Composite 20 U.S. Home Price Index as of March 2010
  • 3.
  • 4. Understand the Local Market That You are Buying into/ Selling out of…
  • 5. How do we assess vitality in our real estate markets? By checking the Absorption Rate . It is the number of homes available in the market divided by the number of homes that have gone under contract in the past 30 days. It is our most accurate measure of current market strength .
  • 6.  
  • 7. Market Scale for Supply & Demand Weichert has been studying market conditions for more than 3 decades and has found a direct correlation between market absorption and property values. As absorption rates increase beyond a normal market level of 5-6 months, property values depreciate annually. Market Absorption in Months 1 2 3 4 5 6 7 8 9 10 11 12 Normal
  • 8. 12/6/10 Towns Active Listings Pending in Last 30 Days Absorption Rate in Months New Listings in 30 Days Net Gain (Loss) to Market Listings Reduced in 30 Days % of Invent. Reduced Expired Listings W/drawn Listings Closed Listings Princeton Boro: All Styles 43 2 21.5 5 3 2 4.7% 2 3 10 Pton -Boro Condo/ Thouses 16 0 99 1 1 1 6.3% 1 1 7 Pton-Boro Single Family 27 2 13.5 4 2 1 3.7% 1 2 3 Princeton Twp: All Styles 122 11 11.1 14 3 12 9.8% 3 9 12 Pton Twp: Condo/ Thouses 21 1 21 5 4 2 9.5% 1 0 1 Pton Twp: Single Family 101 10 10.1 9 -1 10 9.9% 2 9 11
  • 9. 12/6/10 Towns Active Listings Pending in Last 30 Days Absorption Rate in Months New Listings in 30 Days Net Gain (Loss) to Market Li1stings Reduced in 30 Days % of Invent. Reduced Expired Listings W/drawn Listings Closed Listings West Windsor: All Styles 97 16 6.1 12 -4 25 25.8% 10 6 17 West Windsor Condo/ T.Houses 24 6 4 3 -3 7 29.2% 1 2 5 West Windsor 55+ 5 1 5 2 1 -- -- 0 1 1 West Windsor Single Family 68 9 7.6 7 -2 18 26.5% 9 3 11 Lawrence: All Styles 189 11 17.2 30 19 27 14.3% 13 14 20 Lawrence: Condo/ THouses 65 3 21.7 10 7 14 21.5% 4 5 4 Lawrence: 55+ 14 1 14 3 2 -- -- 0 1 2 Lawrence: Single Family 110 7 15.7 17 10 13 11.8% 9 8 14
  • 10. 12/6/10 Towns Active Listings Pending in Last 30 Days Absorption Rate in Months New Listings in 30 Days Net Gain (Loss) to Market Listings Reduced in 30 Days % of Invent. Reduced Expired Listings W/drawn Listings Closed Listings PlainsboroAll Styles 84 4 21 21 17 15 18% 7 0 9 Plainsboro Condo/ THouses 45 1 45 9 8 8 18% 3 0 4 Plainsboro 55+ 19 1 19 8 7 2 11% 1 0 1 Plainsboro Single Family 20 2 10 4 2 5 25% 3 0 4 Cranbury: All Styles 21 0 99 3 3 1 4% 2 0 2 Cranbury: 55+ 4 0 99 0 0 1 25% 0 0 0 Cranbury: Single Family 17 0 99 3 3 0 0 2 0 2
  • 11. 12/6/10 Towns Active Listings Pending in Last 30 Days Absorption Rate in Months New Listings in 30 Days Net Gain (Loss) to Market Listings Reduced in 30 Days % of Invent. Reduced Expired Listings W/drawn Listings Closed Listings Ewing: All Styles 272 9 30.2 38 29 25 9.2% 16 12 22 Ewing : Condo/ T.Houses 36 1 36 6 5 15 41.7% 3 3 2 Ewing 55+: 8 0 99 2 2 -- -- 0 0 0 Ewing: Single Family 228 8 28.5 30 22 10 4.4% 13 9 20 East Windsor: All Styles 217 0 99 30 30 71 32.7% 14 3 12 East Windsor: Condo/ THouses 141 0 99 19 19 60 42.5% 9 2 8 East Windsor: 55+ 17 0 99 3 3 -- -- 2 0 0 East Windsor: Single Family 59 0 99 8 8 11 18.6% 3 1 4
  • 12. 12/6/10 Towns Active Listings Pending in Last 30 Days Absorption Rate in Months New Listings in 30 Days Net Gain (Loss) to Market Listings Reduced in 30 Days % of Invent. Reduced Expired Listings W/drawn Listings Closed Listings Hopewell Twp. All Styles 130 1 130 18 17 25 19% 16 5 4 Hopewell Twp. Condo/ T.Houses 11 0 0 2 2 3 27% 2 1 0 Hopewell Twp.: 55+ 8 0 0 1 1 -- -- 0 1 0 Hopewell Twp Single Family 111 1 111 15 14 22 20% 14 3 4 Hamilton: All Styles 588 100 6 84 -16 115 19.5% 44 25 39 Hamilton: Condo/ THouses 106 20 5 14 -6 24 23% 5 6 2 Hamilton: 55+ 38 6 6 3 -3 -- -- 1 2 4 Hamilton: Single Family 444 74 6 67 -7 91 20% 38 17 33
  • 13. 12/6/10 Towns Active Listings Pending in Last 30 Days Absorption Rate in Months New Listings in 30 Days Net Gain (Loss) to Market Listings Reduced in 30 Days % of Invent. Reduced Expired Listings W/drawn Listings Closed Listings Robbinsvill All Styles 144 18 8 29 11 37 26% 13 6 11 Robbinsvill Condo/ T.Houses 64 6 11 14 9 20 31% 7 4 7 Robbinsvill Single Family 80 12 7 15 3 7 21% 6 2 4 Hightstown Boro: All Styles 65 1 65 10 9 9 14% 8 5 4 Pennington 15 2 7.5 2 0 1 6% 1 2 3 Hopewell Boro 18 2 9 2 0 1 5% 1 2 3
  • 14. 12/6/10 Towns Active Listings Pending in Last 30 Days Absorption Rate in Months New Listings in 30 Days Net Gain (Loss) to Market Listings Reduced in 30 Days % of Invent. Reduced Expired Listings W/drawn Listings Closed Listings Montgomery All Styles 130 22 5.9 26 +4 21 16 16 12 16 Montgomery Condo/Twnhms 26 5 5.2 10 +5 3 11 2 2 5 Single Family 104 17 6.1 16 -1 18 17 14 10 11 Hillsborough All Styles 259 28 9.2 25 -3 40 15 14 10 14 Hillsborough Condo/Twnhms 89 9 9.9 14 +5 21 23 5 6 5 Hillsborough Single Family 170 19 8.9 11 -8 19 11 9 4 9

Hinweis der Redaktion

  1. Populate this table to show the local absorption rate in the various price ranges that are appropriate for your market area. Please add or delete rows as necessary to adequately reflect local conditions.
  2. Populate this table to show the local absorption rate in the various price ranges that are appropriate for your market area. Please add or delete rows as necessary to adequately reflect local conditions.
  3. Populate this table to show the local absorption rate in the various price ranges that are appropriate for your market area. Please add or delete rows as necessary to adequately reflect local conditions.
  4. Populate this table to show the local absorption rate in the various price ranges that are appropriate for your market area. Please add or delete rows as necessary to adequately reflect local conditions.
  5. Populate this table to show the local absorption rate in the various price ranges that are appropriate for your market area. Please add or delete rows as necessary to adequately reflect local conditions.
  6. Populate this table to show the local absorption rate in the various price ranges that are appropriate for your market area. Please add or delete rows as necessary to adequately reflect local conditions.
  7. Populate this table to show the local absorption rate in the various price ranges that are appropriate for your market area. Please add or delete rows as necessary to adequately reflect local conditions.