Greater Princeton NJ Real Estate Markets April 27, 2011
•Als PPT, PDF herunterladen•
0 gefällt mir•387 views

Real Estate Market Data for the Greater Princeton New Jersey Area as of April 27, 2011

Empfohlen
Empfohlen
Weitere ähnliche Inhalte
Was ist angesagt?
Was ist angesagt? (20)
Ähnlich wie Greater Princeton NJ Real Estate Markets April 27, 2011
Ähnlich wie Greater Princeton NJ Real Estate Markets April 27, 2011 (13)
Mehr von Ann Harwood
Mehr von Ann Harwood (11)
Kürzlich hochgeladen
Kürzlich hochgeladen (20)
Greater Princeton NJ Real Estate Markets April 27, 2011
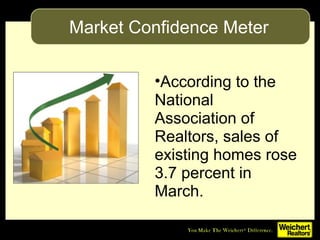
- 1. •According to the National Association of Realtors, sales of existing homes rose 3.7 percent in March. Market Confidence Meter
- 2. Historic Home Prices When adjusted for inflation, American home prices increased by an average of about half a percentage point per year from 1890 through 2008, according to data compiled by Yale University Professor Robert Shiller. (www.USNews.com/money - Luke Mullins, March 4, 2010)
- 3. Home Prices Now Now, however, as a result of many economic factors since 2008, the median American home prices have settled back to 2003 levels. Source: Case Schiller Non-Seasonally Adjusted Composite 20 U.S. Home Price Index as of March 2010
- 4. If you are a Buyer, • with today’s low interest rates AFFORDABILITY is still HIGH ! • consult with an experienced New Jersey mortgage counselor to assess your buying power and properly position yourself in the market. In this way, sellers will take your offers seriously! If you are a Seller, • Pinpoint pricing is all important in this challenging market. • Professional staging can make all the difference in getting a good, negotiable offer. • Pre-inspections prevent later fall-throughs once you have a contract for sale! • Marketing for 2011 buyers and the way they search for homes makes all the difference With an eye to Moving This Year!
- 5. Home Prices and Affordability • Effective monthly rent payments moved above after-tax mortgage payments for the first time since 1991. • Housing affordability in Q4 2010 improved over Q3. • Average mortgage rates appear to have bottomed in Q4 2010. Source: Deutsche Bank, National Association of Realtors, REIS - 20 Deutsche Bank Survey, 2011 OPPORTUNITY IS EVERYWHERE!
- 6. Top Five Rules for Understanding the Real Estate Market: 1. Real Estate is Local 2. Real Estate is Local 3. Real Estate is Local 4. Real Estate is Local. 5. Real Estate is Local
- 7. Understand the Local Market That You are Buying into/ Selling out of…
- 8. How do we assess strength and vitality in our real estate markets? By checking the “Absorption Rate.” This is the number of homes available divided by the number of homes that have gone under contract in the past 30 days. It is our most accurate measure of current market strength.
- 9. Sample Market Absorption RateSample Market Absorption Rate 100 current active listings 4 reported sales in last 30 days = 25 Months’ absorption rate Anytow n., NJ 5-6 Months Market Absorption Rate indicates a normal market.
- 10. MarketAbsorptioninMonths 1 2 3 4 5 6 7 8 9 10 11 12 Normal Market Scale for Supply & DemandMarket Scale for Supply & Demand Weichert has been studying market conditions for more than 3 decades and has found a direct correlation between market absorption and property values. As absorption rates increase beyond a normal market level of 5-6 months, property values depreciate annually.
- 11. 4/26/11 Towns Active Listings Pending in Last 30 Days Absorption Rate in Months New Listings in 30 Days Net Gain (Loss) to Market Listings Reduced in 30 Days % of Invent. Reduced Expired Listings W/drawn Listings Princeton Boro: All Styles 60 5 12 20 15 9 15% 1 2 Pton -Boro Condo/ Thouses 31 3 10 10 7 5 16% 1 0 Pton-Boro Single Family 29 2 15 10 8 4 14% 0 2 Pton Twp: All Styles 161 8 20 37 29 23 14% 6 3 Pton Twp: Condo/ Thouses 20 1 20 5 4 4 20% 1 2 Pton Twp: Single Family 141 7 20 32 25 19 13% 5 1
- 12. 4/26/11 Towns Active Listings Pending in Last 30 Days Absorption Rate in Months New Listings in 30 Days Net Gain (Loss) to Market Li1stings Reduced in 30 Days % of Invent. Reduced Expired Listings W/drawn Listings West Windsor: All Styles 140 13 10.8 48 35 37 26% 5 5 West Windsor Condo/ T.Houses 31 4 7.75 14 10 6 19% 2 3 West Windsor 55+ 8 0 99 4 4 - - 0 0 West Windsor Single Family 101 9 11.2 32 23 31 31% 3 2 Lawrence: All Styles 234 20 11.7 55 35 56 24% 10 4 Lawrence: Condo/ THouses 84 7 12 19 12 20 24% 3 2 Lawrence: 55+ 17 0 99 2 2 - - 1 0
- 13. 4/26/11 Towns Active Listings Pending in Last 30 Days Absorption Rate in Months New Listings in 30 Days Net Gain (Loss) to Market Listings Reduced in 30 Days % of Invent. Reduced Expired Listings W/drawn Listings Closed Listings Plainsboro All Styles 118 19 6 34 15 24 20% 6 0 7 Plainsboro Condo/ THouses 63 10 6 16 6 12 19% 6 0 3 Plainsboro 55+ 19 2 5 5 1 2 11% 0 0 1 Plainsboro Single Family 36 7 5 15 8 10 27% 0 0 3 Cranbury: Single Family 25 1 25 8 7 3 12% 1 0 2
- 14. 4/26/11 Towns Active Listings Pending in Last 30 Days Absorption Rate in Months New Listings in 30 Days Net Gain (Loss) to Market Listings Reduced in 30 Days % of Invent. Reduced Expired Listings W/drawn Listings Ewing: All Styles 306 16 19.1 63 47 76 25% 14 4 Ewing : Condo/ T.Houses 43 3 14.3 9 6 9 21% 3 1 Ewing 55+: 12 0 99 1 1 - - 0 0 Ewing: Single Family 251 13 19.3 53 40 67 27% 11 3 East Windsor: All Styles 236 14 17 41 27 43 18% 7 5 East Windsor: Condo/ THouses 144 7 21 17 10 22 15% 5 3 East Windsor: 55+ 14 2 7 2 0 -- -- 0 1 East Windsor: Single 81 5 16 22 17 21 26% 2 1
- 15. Towns Active Listings Pending in Last 30 Days Absorption Rate in Months New Listings in 30 Days Net Gain (Loss) to Market Listings Reduced in 30 Days % of Invent. Reduced Expired Listings W/drawn Listings Hopewell Twp. All Styles 158 8 20 47 39 42 26.5% 5 1 Hopewell Twp. Condo/ T.Houses 17 3 6 6 3 5 29% 0 0 Hopewell Twp.: 55+ 9 1 9 0 -1 -- -- 0 0 Hopewell Twp Single Family 132 4 33 41 37 37 28% 5 0 Hamilton: All Styles 671 115 6 173 58 158 23.5% 24 16 Hamilton: Condo/ THouses 130 18 7 37 19 36 28% 4 2 Hamilton: 55+ 42 6 7 11 5 -- -- 0 0 Hamilton: Single Family 499 91 5 125 34 122 24% 20 14 Towns Active Listings Pending in Last 30 Days Absorption Rate in Months New Listings in 30 Days Net Gain (Loss) to Market Listings Reduced in 30 Days % of Invent. Reduced Expired Listings W/drawn Listings Hopewell Twp. All Styles 158 8 20 47 39 42 26.5% 5 1 Hopewell Twp. Condo/ T.Houses 17 3 6 6 3 5 29% 0 0 Hopewell Twp.: 55+ 9 1 9 0 -1 -- -- 0 0 Hopewell Twp Single Family 132 4 33 41 37 37 28% 5 0 Hamilton: All Styles 671 115 6 173 58 158 23.5% 24 16 Hamilton: Condo/ THouses 130 18 7 37 19 36 28% 4 2 Hamilton: 55+ 42 6 7 11 5 -- -- 0 0 Hamilton: Single Family 499 91 5 125 34 122 24% 20 14 4/26/11
- 16. 4/26/11 Towns Active Listings Pending in Last 30 Days Absorption Rate in Months New Listings in 30 Days Net Gain (Loss) to Market Listings Reduced in 30 Days % of Invent. Reduced Expired Listings W/drawn Listings Closed Listings Robbinsville All Styles 152 14 11 38 24 40 26% 9 11 9 Robbinsville Condo/ T.Houses 70 8 9 16 8 19 27% 3 4 6 Single Family 82 6 14 16 10 21 36% 6 7 3 Hightstown Boro: All Styles 77 2 38 18 16 15 19% 1 2 4 Pennington 14 3 5 6 3 5 36% 0 0 2 Hopewell Boro 17 3 5 7 4 3 18% 1 0 3