SlideShare ist ein Scribd-Unternehmen logo
1 von 20
Data Analysis, Statistics, 
and Probability Review 
The SAT doesn’t include 
computation of standard deviation
Data Interpretation 
• interpret information in graphs, tables, or 
charts 
• then compare quantities, recognize trends 
and changes in the data 
• perform calculations based on the 
information you have found
Graphs 
Circle Graphs
Line Graphs
Bar Graphs
Pictographs
Scatterplot
Data Interpretation 
Questions 
When working with data interpretation questions: 
• Look at the graph, table, or chart to make sure 
you understand it. 
• Make sure you know what type of information is 
being displayed. 
• Read the labels. 
• Make sure you know the units. 
• Make sure you understand what is happening to 
the data as you move through the table, graph, 
or chart. 
• Read the question carefully.
Example: 
In what month did the profits of the two 
companies show the greatest difference? 
Since the distance between the two graph 
points is greatest at April, that is the 
answer.
Example: 
If the rate of increase or decrease for each 
company continues for the next six months at the 
same rate shown between April and May, which 
company would have higher profits at the end of 
that time? 
Answer is Company Y. Extend the lines out and 
Company Y crosses to go above Company X.
Example: 
As an experiment, Josh bought 20 
different batteries of various 
brands and prices. He tested each 
battery to see how long it would 
keep a toy car working before 
losing power. For each battery, he 
plotted the duration against the 
price. Of the five labeled points, 
which one corresponds to the 
battery that cost the least per 
length of duration? 
Answer: Cost per hour of 
duration is price/time which is 
the slope of each line drawn from 
the Origin to a Point. 
has the smallest slope so 
OC 
battery C has the least cost per 
hour of duration.
Statistics 
Arithmetic Mean 
• average 
• 
sum of list of values 
number of values in list 
Median 
• middle value of a list when the numbers are in 
order 
Mode 
• value or values that appear the greatest number of 
times
Weighted Average 
• average of two or more groups that do not all 
have the same number of members 
Example: 
What is the average of Ms. Smith’s Geometry 
Exams if one class of 27 students averaged 
84%, another class of 10 students averaged 70% 
and her third class of 15 students had an 
average of 62%? 
Answer is 75% rounded to the nearest tenth. 
´ + ´ + ´ = = 
27 84 10 70 15 62 74.96 75% 
+ + 
27 10 15
Average of Algebraic Expressions 
• also called arithmetic mean 
Example: 
Find the arithmetic mean of 3x+4 and 5x -10. 
Answer: 
x + + x - = x - = x - 
3 4 5 10 8 6 4 3 
2 2
Using Averages to Find Missing Numbers 
• average = 
sum of list of values 
number of • therefore, average ´ 
values in list number of values = sum of 
values 
Example: 
Sean has test scores of 88, 83, 72 and 90. 
What does he need to make on his fifth test 
to have an 85 average? 
Answer: 
85 x 5 = 425 88 + 83 +72 +90 = 333 
425 – 333 = 92
Probability 
Probability of Event 
• number between 0 and 1, inclusive 
• if an event is certain, it has probability 1 
• if an event is impossible, it has probability 0 
Independent Events 
• the outcome of either event has no effect on the 
other 
• to find the probability of two or more independent 
events occurring together, multiply the 
probabilities of the individual events
Dependent Events 
• the outcome of one event affects the 
probability of another event 
• use logical reasoning to help figure out 
probabilities involving dependent events
Geometric Probability 
• Probability involving geometric figures 
Example: Given the large circle has 
radius 8 and the small circle has 
radius 2. If a point is chosen at 
random from the large circle, what is 
the probability that the point chosen 
will be in the small circle? 
p ´(8)2 = 64p 
Answer: Area of large circle = 
Area of small circle = 
p ´(2)2 = 4p 
So the probability of the point being in the small circle 
is . 
p 
p 
4 = 
1 
64 16
Example: 
A game at the state fair has a circular target with a 
radius of 10.7 cm on a square board measuring 
30 cm on a side. Players win prizes if they 
throw a dart and hit the circular area only. What 
is the probability of winning with one throw of a 
dart? 
measure of geometric model representing 
P(E) = desired outcomes in the event 
measure of geometric model representing 
all outcomes in the same space
Solution: 
Area of circle A = 
Area of entire square board A = 
p (10.7)2 = 359.7 
302 = 900 
359.7 .40 
900 
P (E) = = 
or 40% chance of hitting in the 
circle.

Weitere ähnliche Inhalte

Was ist angesagt?

Skewness & Kurtosis
Skewness & KurtosisSkewness & Kurtosis
Skewness & KurtosisNavin Bafna
 
Hypothesis testing , T test , chi square test, z test
Hypothesis testing , T test , chi square test, z test Hypothesis testing , T test , chi square test, z test
Hypothesis testing , T test , chi square test, z test Irfan Ullah
 
Statistics: Probability
Statistics: ProbabilityStatistics: Probability
Statistics: ProbabilitySultan Mahmood
 
inferencial statistics
inferencial statisticsinferencial statistics
inferencial statisticsanjaemerry
 
INFERENTIAL STATISTICS: AN INTRODUCTION
INFERENTIAL STATISTICS: AN INTRODUCTIONINFERENTIAL STATISTICS: AN INTRODUCTION
INFERENTIAL STATISTICS: AN INTRODUCTIONJohn Labrador
 
Confidence Intervals––Exact Intervals, Jackknife, and Bootstrap
Confidence Intervals––Exact Intervals, Jackknife, and BootstrapConfidence Intervals––Exact Intervals, Jackknife, and Bootstrap
Confidence Intervals––Exact Intervals, Jackknife, and BootstrapFrancesco Casalegno
 
Complements and Conditional Probability, and Bayes' Theorem
 Complements and Conditional Probability, and Bayes' Theorem Complements and Conditional Probability, and Bayes' Theorem
Complements and Conditional Probability, and Bayes' TheoremLong Beach City College
 
PROBABILITY AND IT'S TYPES WITH RULES
PROBABILITY AND IT'S TYPES WITH RULESPROBABILITY AND IT'S TYPES WITH RULES
PROBABILITY AND IT'S TYPES WITH RULESBhargavi Bhanu
 
Introduction to probability distributions-Statistics and probability analysis
Introduction to probability distributions-Statistics and probability analysis Introduction to probability distributions-Statistics and probability analysis
Introduction to probability distributions-Statistics and probability analysis Vijay Hemmadi
 

Was ist angesagt? (20)

Probability
ProbabilityProbability
Probability
 
Probability
Probability Probability
Probability
 
Normal distribution
Normal distributionNormal distribution
Normal distribution
 
Skewness & Kurtosis
Skewness & KurtosisSkewness & Kurtosis
Skewness & Kurtosis
 
Hypothesis testing , T test , chi square test, z test
Hypothesis testing , T test , chi square test, z test Hypothesis testing , T test , chi square test, z test
Hypothesis testing , T test , chi square test, z test
 
Basic concepts of probability
Basic concepts of probability Basic concepts of probability
Basic concepts of probability
 
coefficient variation
coefficient variationcoefficient variation
coefficient variation
 
Binomial distribution
Binomial distributionBinomial distribution
Binomial distribution
 
Statistics: Probability
Statistics: ProbabilityStatistics: Probability
Statistics: Probability
 
Probability concept and Probability distribution
Probability concept and Probability distributionProbability concept and Probability distribution
Probability concept and Probability distribution
 
Statistical analysis
Statistical  analysisStatistical  analysis
Statistical analysis
 
Binomial probability distributions
Binomial probability distributions  Binomial probability distributions
Binomial probability distributions
 
Probability
ProbabilityProbability
Probability
 
inferencial statistics
inferencial statisticsinferencial statistics
inferencial statistics
 
INFERENTIAL STATISTICS: AN INTRODUCTION
INFERENTIAL STATISTICS: AN INTRODUCTIONINFERENTIAL STATISTICS: AN INTRODUCTION
INFERENTIAL STATISTICS: AN INTRODUCTION
 
Confidence Intervals––Exact Intervals, Jackknife, and Bootstrap
Confidence Intervals––Exact Intervals, Jackknife, and BootstrapConfidence Intervals––Exact Intervals, Jackknife, and Bootstrap
Confidence Intervals––Exact Intervals, Jackknife, and Bootstrap
 
Complements and Conditional Probability, and Bayes' Theorem
 Complements and Conditional Probability, and Bayes' Theorem Complements and Conditional Probability, and Bayes' Theorem
Complements and Conditional Probability, and Bayes' Theorem
 
Descriptive statistics
Descriptive statisticsDescriptive statistics
Descriptive statistics
 
PROBABILITY AND IT'S TYPES WITH RULES
PROBABILITY AND IT'S TYPES WITH RULESPROBABILITY AND IT'S TYPES WITH RULES
PROBABILITY AND IT'S TYPES WITH RULES
 
Introduction to probability distributions-Statistics and probability analysis
Introduction to probability distributions-Statistics and probability analysis Introduction to probability distributions-Statistics and probability analysis
Introduction to probability distributions-Statistics and probability analysis
 

Andere mochten auch

Data Analysis And Probability
Data Analysis And ProbabilityData Analysis And Probability
Data Analysis And Probabilityguest048a607
 
NCTM Data Analysis
NCTM Data AnalysisNCTM Data Analysis
NCTM Data AnalysisBill
 
Probability and basic statistics with R
Probability and basic statistics with RProbability and basic statistics with R
Probability and basic statistics with RAlberto Labarga
 
Decision Analysis
Decision AnalysisDecision Analysis
Decision Analysiss junaid
 
Decision Tree Analysis
Decision Tree AnalysisDecision Tree Analysis
Decision Tree AnalysisAnand Arora
 
Monte carlo simulation
Monte carlo simulationMonte carlo simulation
Monte carlo simulationRajesh Piryani
 
Research Methodology
Research MethodologyResearch Methodology
Research Methodologysh_neha252
 

Andere mochten auch (9)

Data Analysis And Probability
Data Analysis And ProbabilityData Analysis And Probability
Data Analysis And Probability
 
Data Analysis And Probability Pp
Data Analysis And Probability PpData Analysis And Probability Pp
Data Analysis And Probability Pp
 
NCTM Data Analysis
NCTM Data AnalysisNCTM Data Analysis
NCTM Data Analysis
 
Probability and basic statistics with R
Probability and basic statistics with RProbability and basic statistics with R
Probability and basic statistics with R
 
Decision analysis
Decision analysisDecision analysis
Decision analysis
 
Decision Analysis
Decision AnalysisDecision Analysis
Decision Analysis
 
Decision Tree Analysis
Decision Tree AnalysisDecision Tree Analysis
Decision Tree Analysis
 
Monte carlo simulation
Monte carlo simulationMonte carlo simulation
Monte carlo simulation
 
Research Methodology
Research MethodologyResearch Methodology
Research Methodology
 

Ähnlich wie Data analysis, statistics, and probability review

Random Variable & Probability Distribution 1.pptx
Random Variable & Probability Distribution 1.pptxRandom Variable & Probability Distribution 1.pptx
Random Variable & Probability Distribution 1.pptxJAYARSOCIAS3
 
SAMPLING MEAN DEFINITION The term sampling mean .docx
SAMPLING MEAN DEFINITION The term sampling mean .docxSAMPLING MEAN DEFINITION The term sampling mean .docx
SAMPLING MEAN DEFINITION The term sampling mean .docxanhlodge
 
SAMPLING MEAN DEFINITION The term sampling mean is.docx
SAMPLING MEAN  DEFINITION  The term sampling mean is.docxSAMPLING MEAN  DEFINITION  The term sampling mean is.docx
SAMPLING MEAN DEFINITION The term sampling mean is.docxagnesdcarey33086
 
C2 st lecture 13 revision for test b handout
C2 st lecture 13   revision for test b handoutC2 st lecture 13   revision for test b handout
C2 st lecture 13 revision for test b handoutfatima d
 
Special webinar on tips for perfect score in sat math
Special webinar on tips for perfect score in sat mathSpecial webinar on tips for perfect score in sat math
Special webinar on tips for perfect score in sat mathCareerGOD
 
Math-Stage-8-Scheme-of-Work.docx
Math-Stage-8-Scheme-of-Work.docxMath-Stage-8-Scheme-of-Work.docx
Math-Stage-8-Scheme-of-Work.docxjayashreekrishna5
 
A General Manger of Harley-Davidson has to decide on the size of a.docx
A General Manger of Harley-Davidson has to decide on the size of a.docxA General Manger of Harley-Davidson has to decide on the size of a.docx
A General Manger of Harley-Davidson has to decide on the size of a.docxevonnehoggarth79783
 
SAMPLING MEANDEFINITIONThe term sampling mean is a stati.docx
SAMPLING MEANDEFINITIONThe term sampling mean is a stati.docxSAMPLING MEANDEFINITIONThe term sampling mean is a stati.docx
SAMPLING MEANDEFINITIONThe term sampling mean is a stati.docxanhlodge
 
SAMPLING MEANDEFINITIONThe term sampling mean is a stati.docx
SAMPLING MEANDEFINITIONThe term sampling mean is a stati.docxSAMPLING MEANDEFINITIONThe term sampling mean is a stati.docx
SAMPLING MEANDEFINITIONThe term sampling mean is a stati.docxagnesdcarey33086
 
Statistical thinking
Statistical thinkingStatistical thinking
Statistical thinkingmij1120
 
Final examexamplesapr2013
Final examexamplesapr2013Final examexamplesapr2013
Final examexamplesapr2013Brent Heard
 
(7) Lesson 9.1
(7) Lesson 9.1(7) Lesson 9.1
(7) Lesson 9.1wzuri
 
Let’S Re Cap Sigfigs
Let’S Re Cap SigfigsLet’S Re Cap Sigfigs
Let’S Re Cap Sigfigsalehman
 
Statistics for math (English Version)
Statistics for math (English Version)Statistics for math (English Version)
Statistics for math (English Version)Tito_14
 
counting techniques
counting techniquescounting techniques
counting techniquesUnsa Shakir
 

Ähnlich wie Data analysis, statistics, and probability review (20)

Random Variable & Probability Distribution 1.pptx
Random Variable & Probability Distribution 1.pptxRandom Variable & Probability Distribution 1.pptx
Random Variable & Probability Distribution 1.pptx
 
SAMPLING MEAN DEFINITION The term sampling mean .docx
SAMPLING MEAN DEFINITION The term sampling mean .docxSAMPLING MEAN DEFINITION The term sampling mean .docx
SAMPLING MEAN DEFINITION The term sampling mean .docx
 
Probability unit2.pptx
Probability unit2.pptxProbability unit2.pptx
Probability unit2.pptx
 
SAMPLING MEAN DEFINITION The term sampling mean is.docx
SAMPLING MEAN  DEFINITION  The term sampling mean is.docxSAMPLING MEAN  DEFINITION  The term sampling mean is.docx
SAMPLING MEAN DEFINITION The term sampling mean is.docx
 
C2 st lecture 13 revision for test b handout
C2 st lecture 13   revision for test b handoutC2 st lecture 13   revision for test b handout
C2 st lecture 13 revision for test b handout
 
Special webinar on tips for perfect score in sat math
Special webinar on tips for perfect score in sat mathSpecial webinar on tips for perfect score in sat math
Special webinar on tips for perfect score in sat math
 
Math-Stage-8-Scheme-of-Work.docx
Math-Stage-8-Scheme-of-Work.docxMath-Stage-8-Scheme-of-Work.docx
Math-Stage-8-Scheme-of-Work.docx
 
151334702 gmat
151334702 gmat151334702 gmat
151334702 gmat
 
ANSWERS
ANSWERSANSWERS
ANSWERS
 
Stat.pptx
Stat.pptxStat.pptx
Stat.pptx
 
A General Manger of Harley-Davidson has to decide on the size of a.docx
A General Manger of Harley-Davidson has to decide on the size of a.docxA General Manger of Harley-Davidson has to decide on the size of a.docx
A General Manger of Harley-Davidson has to decide on the size of a.docx
 
Les5e ppt 03
Les5e ppt 03Les5e ppt 03
Les5e ppt 03
 
SAMPLING MEANDEFINITIONThe term sampling mean is a stati.docx
SAMPLING MEANDEFINITIONThe term sampling mean is a stati.docxSAMPLING MEANDEFINITIONThe term sampling mean is a stati.docx
SAMPLING MEANDEFINITIONThe term sampling mean is a stati.docx
 
SAMPLING MEANDEFINITIONThe term sampling mean is a stati.docx
SAMPLING MEANDEFINITIONThe term sampling mean is a stati.docxSAMPLING MEANDEFINITIONThe term sampling mean is a stati.docx
SAMPLING MEANDEFINITIONThe term sampling mean is a stati.docx
 
Statistical thinking
Statistical thinkingStatistical thinking
Statistical thinking
 
Final examexamplesapr2013
Final examexamplesapr2013Final examexamplesapr2013
Final examexamplesapr2013
 
(7) Lesson 9.1
(7) Lesson 9.1(7) Lesson 9.1
(7) Lesson 9.1
 
Let’S Re Cap Sigfigs
Let’S Re Cap SigfigsLet’S Re Cap Sigfigs
Let’S Re Cap Sigfigs
 
Statistics for math (English Version)
Statistics for math (English Version)Statistics for math (English Version)
Statistics for math (English Version)
 
counting techniques
counting techniquescounting techniques
counting techniques
 

Mehr von Institute of Applied Technology

Mehr von Institute of Applied Technology (20)

1.6 calculating limits using the limit laws
1.6 calculating limits using the limit laws1.6 calculating limits using the limit laws
1.6 calculating limits using the limit laws
 
1.2 precalculus glencoe
1.2 precalculus glencoe 1.2 precalculus glencoe
1.2 precalculus glencoe
 
1.5 precalculus glencoe
1.5 precalculus glencoe1.5 precalculus glencoe
1.5 precalculus glencoe
 
Stewart calc7e 01_08
Stewart calc7e 01_08Stewart calc7e 01_08
Stewart calc7e 01_08
 
1.8 continuity Stewart
1.8 continuity Stewart 1.8 continuity Stewart
1.8 continuity Stewart
 
Finding limits analytically by larson
Finding limits analytically by larsonFinding limits analytically by larson
Finding limits analytically by larson
 
Lar calc10 ch07_sec1
Lar calc10 ch07_sec1Lar calc10 ch07_sec1
Lar calc10 ch07_sec1
 
Lar calc10 ch05_sec5
Lar calc10 ch05_sec5Lar calc10 ch05_sec5
Lar calc10 ch05_sec5
 
Lar calc10 ch05_sec4
Lar calc10 ch05_sec4Lar calc10 ch05_sec4
Lar calc10 ch05_sec4
 
Lar calc10 ch05_sec3
Lar calc10 ch05_sec3Lar calc10 ch05_sec3
Lar calc10 ch05_sec3
 
Lar calc10 ch05_sec1
Lar calc10 ch05_sec1Lar calc10 ch05_sec1
Lar calc10 ch05_sec1
 
Lar calc10 ch05_sec2
Lar calc10 ch05_sec2Lar calc10 ch05_sec2
Lar calc10 ch05_sec2
 
Lar calc10 ch04_sec6
Lar calc10 ch04_sec6Lar calc10 ch04_sec6
Lar calc10 ch04_sec6
 
Lar calc10 ch04_sec5
Lar calc10 ch04_sec5Lar calc10 ch04_sec5
Lar calc10 ch04_sec5
 
Lar calc10 ch04_sec4
Lar calc10 ch04_sec4Lar calc10 ch04_sec4
Lar calc10 ch04_sec4
 
Lar calc10 ch04_sec3
Lar calc10 ch04_sec3Lar calc10 ch04_sec3
Lar calc10 ch04_sec3
 
Lar calc10 ch04_sec2
Lar calc10 ch04_sec2Lar calc10 ch04_sec2
Lar calc10 ch04_sec2
 
Lar calc10 ch04_sec1
Lar calc10 ch04_sec1Lar calc10 ch04_sec1
Lar calc10 ch04_sec1
 
Lar calc10 ch03_sec7
Lar calc10 ch03_sec7Lar calc10 ch03_sec7
Lar calc10 ch03_sec7
 
Lar calc10 ch03_sec6
Lar calc10 ch03_sec6Lar calc10 ch03_sec6
Lar calc10 ch03_sec6
 

Kürzlich hochgeladen

Disha NEET Physics Guide for classes 11 and 12.pdf
Disha NEET Physics Guide for classes 11 and 12.pdfDisha NEET Physics Guide for classes 11 and 12.pdf
Disha NEET Physics Guide for classes 11 and 12.pdfchloefrazer622
 
Presentation by Andreas Schleicher Tackling the School Absenteeism Crisis 30 ...
Presentation by Andreas Schleicher Tackling the School Absenteeism Crisis 30 ...Presentation by Andreas Schleicher Tackling the School Absenteeism Crisis 30 ...
Presentation by Andreas Schleicher Tackling the School Absenteeism Crisis 30 ...EduSkills OECD
 
Sports & Fitness Value Added Course FY..
Sports & Fitness Value Added Course FY..Sports & Fitness Value Added Course FY..
Sports & Fitness Value Added Course FY..Disha Kariya
 
Accessible design: Minimum effort, maximum impact
Accessible design: Minimum effort, maximum impactAccessible design: Minimum effort, maximum impact
Accessible design: Minimum effort, maximum impactdawncurless
 
Beyond the EU: DORA and NIS 2 Directive's Global Impact
Beyond the EU: DORA and NIS 2 Directive's Global ImpactBeyond the EU: DORA and NIS 2 Directive's Global Impact
Beyond the EU: DORA and NIS 2 Directive's Global ImpactPECB
 
fourth grading exam for kindergarten in writing
fourth grading exam for kindergarten in writingfourth grading exam for kindergarten in writing
fourth grading exam for kindergarten in writingTeacherCyreneCayanan
 
The Most Excellent Way | 1 Corinthians 13
The Most Excellent Way | 1 Corinthians 13The Most Excellent Way | 1 Corinthians 13
The Most Excellent Way | 1 Corinthians 13Steve Thomason
 
Kisan Call Centre - To harness potential of ICT in Agriculture by answer farm...
Kisan Call Centre - To harness potential of ICT in Agriculture by answer farm...Kisan Call Centre - To harness potential of ICT in Agriculture by answer farm...
Kisan Call Centre - To harness potential of ICT in Agriculture by answer farm...Krashi Coaching
 
BAG TECHNIQUE Bag technique-a tool making use of public health bag through wh...
BAG TECHNIQUE Bag technique-a tool making use of public health bag through wh...BAG TECHNIQUE Bag technique-a tool making use of public health bag through wh...
BAG TECHNIQUE Bag technique-a tool making use of public health bag through wh...Sapna Thakur
 
A Critique of the Proposed National Education Policy Reform
A Critique of the Proposed National Education Policy ReformA Critique of the Proposed National Education Policy Reform
A Critique of the Proposed National Education Policy ReformChameera Dedduwage
 
Software Engineering Methodologies (overview)
Software Engineering Methodologies (overview)Software Engineering Methodologies (overview)
Software Engineering Methodologies (overview)eniolaolutunde
 
APM Welcome, APM North West Network Conference, Synergies Across Sectors
APM Welcome, APM North West Network Conference, Synergies Across SectorsAPM Welcome, APM North West Network Conference, Synergies Across Sectors
APM Welcome, APM North West Network Conference, Synergies Across SectorsAssociation for Project Management
 
Measures of Central Tendency: Mean, Median and Mode
Measures of Central Tendency: Mean, Median and ModeMeasures of Central Tendency: Mean, Median and Mode
Measures of Central Tendency: Mean, Median and ModeThiyagu K
 
microwave assisted reaction. General introduction
microwave assisted reaction. General introductionmicrowave assisted reaction. General introduction
microwave assisted reaction. General introductionMaksud Ahmed
 
Interactive Powerpoint_How to Master effective communication
Interactive Powerpoint_How to Master effective communicationInteractive Powerpoint_How to Master effective communication
Interactive Powerpoint_How to Master effective communicationnomboosow
 
SOCIAL AND HISTORICAL CONTEXT - LFTVD.pptx
SOCIAL AND HISTORICAL CONTEXT - LFTVD.pptxSOCIAL AND HISTORICAL CONTEXT - LFTVD.pptx
SOCIAL AND HISTORICAL CONTEXT - LFTVD.pptxiammrhaywood
 
Student login on Anyboli platform.helpin
Student login on Anyboli platform.helpinStudent login on Anyboli platform.helpin
Student login on Anyboli platform.helpinRaunakKeshri1
 
Call Girls in Dwarka Mor Delhi Contact Us 9654467111
Call Girls in Dwarka Mor Delhi Contact Us 9654467111Call Girls in Dwarka Mor Delhi Contact Us 9654467111
Call Girls in Dwarka Mor Delhi Contact Us 9654467111Sapana Sha
 

Kürzlich hochgeladen (20)

Disha NEET Physics Guide for classes 11 and 12.pdf
Disha NEET Physics Guide for classes 11 and 12.pdfDisha NEET Physics Guide for classes 11 and 12.pdf
Disha NEET Physics Guide for classes 11 and 12.pdf
 
Presentation by Andreas Schleicher Tackling the School Absenteeism Crisis 30 ...
Presentation by Andreas Schleicher Tackling the School Absenteeism Crisis 30 ...Presentation by Andreas Schleicher Tackling the School Absenteeism Crisis 30 ...
Presentation by Andreas Schleicher Tackling the School Absenteeism Crisis 30 ...
 
Sports & Fitness Value Added Course FY..
Sports & Fitness Value Added Course FY..Sports & Fitness Value Added Course FY..
Sports & Fitness Value Added Course FY..
 
Accessible design: Minimum effort, maximum impact
Accessible design: Minimum effort, maximum impactAccessible design: Minimum effort, maximum impact
Accessible design: Minimum effort, maximum impact
 
Beyond the EU: DORA and NIS 2 Directive's Global Impact
Beyond the EU: DORA and NIS 2 Directive's Global ImpactBeyond the EU: DORA and NIS 2 Directive's Global Impact
Beyond the EU: DORA and NIS 2 Directive's Global Impact
 
fourth grading exam for kindergarten in writing
fourth grading exam for kindergarten in writingfourth grading exam for kindergarten in writing
fourth grading exam for kindergarten in writing
 
The Most Excellent Way | 1 Corinthians 13
The Most Excellent Way | 1 Corinthians 13The Most Excellent Way | 1 Corinthians 13
The Most Excellent Way | 1 Corinthians 13
 
Kisan Call Centre - To harness potential of ICT in Agriculture by answer farm...
Kisan Call Centre - To harness potential of ICT in Agriculture by answer farm...Kisan Call Centre - To harness potential of ICT in Agriculture by answer farm...
Kisan Call Centre - To harness potential of ICT in Agriculture by answer farm...
 
BAG TECHNIQUE Bag technique-a tool making use of public health bag through wh...
BAG TECHNIQUE Bag technique-a tool making use of public health bag through wh...BAG TECHNIQUE Bag technique-a tool making use of public health bag through wh...
BAG TECHNIQUE Bag technique-a tool making use of public health bag through wh...
 
A Critique of the Proposed National Education Policy Reform
A Critique of the Proposed National Education Policy ReformA Critique of the Proposed National Education Policy Reform
A Critique of the Proposed National Education Policy Reform
 
INDIA QUIZ 2024 RLAC DELHI UNIVERSITY.pptx
INDIA QUIZ 2024 RLAC DELHI UNIVERSITY.pptxINDIA QUIZ 2024 RLAC DELHI UNIVERSITY.pptx
INDIA QUIZ 2024 RLAC DELHI UNIVERSITY.pptx
 
Software Engineering Methodologies (overview)
Software Engineering Methodologies (overview)Software Engineering Methodologies (overview)
Software Engineering Methodologies (overview)
 
APM Welcome, APM North West Network Conference, Synergies Across Sectors
APM Welcome, APM North West Network Conference, Synergies Across SectorsAPM Welcome, APM North West Network Conference, Synergies Across Sectors
APM Welcome, APM North West Network Conference, Synergies Across Sectors
 
Advance Mobile Application Development class 07
Advance Mobile Application Development class 07Advance Mobile Application Development class 07
Advance Mobile Application Development class 07
 
Measures of Central Tendency: Mean, Median and Mode
Measures of Central Tendency: Mean, Median and ModeMeasures of Central Tendency: Mean, Median and Mode
Measures of Central Tendency: Mean, Median and Mode
 
microwave assisted reaction. General introduction
microwave assisted reaction. General introductionmicrowave assisted reaction. General introduction
microwave assisted reaction. General introduction
 
Interactive Powerpoint_How to Master effective communication
Interactive Powerpoint_How to Master effective communicationInteractive Powerpoint_How to Master effective communication
Interactive Powerpoint_How to Master effective communication
 
SOCIAL AND HISTORICAL CONTEXT - LFTVD.pptx
SOCIAL AND HISTORICAL CONTEXT - LFTVD.pptxSOCIAL AND HISTORICAL CONTEXT - LFTVD.pptx
SOCIAL AND HISTORICAL CONTEXT - LFTVD.pptx
 
Student login on Anyboli platform.helpin
Student login on Anyboli platform.helpinStudent login on Anyboli platform.helpin
Student login on Anyboli platform.helpin
 
Call Girls in Dwarka Mor Delhi Contact Us 9654467111
Call Girls in Dwarka Mor Delhi Contact Us 9654467111Call Girls in Dwarka Mor Delhi Contact Us 9654467111
Call Girls in Dwarka Mor Delhi Contact Us 9654467111
 

Data analysis, statistics, and probability review

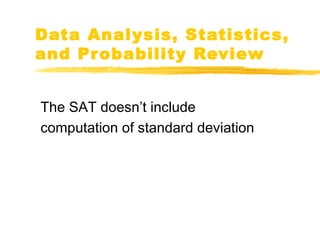
  • 1. Data Analysis, Statistics, and Probability Review The SAT doesn’t include computation of standard deviation
  • 2. Data Interpretation • interpret information in graphs, tables, or charts • then compare quantities, recognize trends and changes in the data • perform calculations based on the information you have found
  • 8. Data Interpretation Questions When working with data interpretation questions: • Look at the graph, table, or chart to make sure you understand it. • Make sure you know what type of information is being displayed. • Read the labels. • Make sure you know the units. • Make sure you understand what is happening to the data as you move through the table, graph, or chart. • Read the question carefully.
  • 9. Example: In what month did the profits of the two companies show the greatest difference? Since the distance between the two graph points is greatest at April, that is the answer.
  • 10. Example: If the rate of increase or decrease for each company continues for the next six months at the same rate shown between April and May, which company would have higher profits at the end of that time? Answer is Company Y. Extend the lines out and Company Y crosses to go above Company X.
  • 11. Example: As an experiment, Josh bought 20 different batteries of various brands and prices. He tested each battery to see how long it would keep a toy car working before losing power. For each battery, he plotted the duration against the price. Of the five labeled points, which one corresponds to the battery that cost the least per length of duration? Answer: Cost per hour of duration is price/time which is the slope of each line drawn from the Origin to a Point. has the smallest slope so OC battery C has the least cost per hour of duration.
  • 12. Statistics Arithmetic Mean • average • sum of list of values number of values in list Median • middle value of a list when the numbers are in order Mode • value or values that appear the greatest number of times
  • 13. Weighted Average • average of two or more groups that do not all have the same number of members Example: What is the average of Ms. Smith’s Geometry Exams if one class of 27 students averaged 84%, another class of 10 students averaged 70% and her third class of 15 students had an average of 62%? Answer is 75% rounded to the nearest tenth. ´ + ´ + ´ = = 27 84 10 70 15 62 74.96 75% + + 27 10 15
  • 14. Average of Algebraic Expressions • also called arithmetic mean Example: Find the arithmetic mean of 3x+4 and 5x -10. Answer: x + + x - = x - = x - 3 4 5 10 8 6 4 3 2 2
  • 15. Using Averages to Find Missing Numbers • average = sum of list of values number of • therefore, average ´ values in list number of values = sum of values Example: Sean has test scores of 88, 83, 72 and 90. What does he need to make on his fifth test to have an 85 average? Answer: 85 x 5 = 425 88 + 83 +72 +90 = 333 425 – 333 = 92
  • 16. Probability Probability of Event • number between 0 and 1, inclusive • if an event is certain, it has probability 1 • if an event is impossible, it has probability 0 Independent Events • the outcome of either event has no effect on the other • to find the probability of two or more independent events occurring together, multiply the probabilities of the individual events
  • 17. Dependent Events • the outcome of one event affects the probability of another event • use logical reasoning to help figure out probabilities involving dependent events
  • 18. Geometric Probability • Probability involving geometric figures Example: Given the large circle has radius 8 and the small circle has radius 2. If a point is chosen at random from the large circle, what is the probability that the point chosen will be in the small circle? p ´(8)2 = 64p Answer: Area of large circle = Area of small circle = p ´(2)2 = 4p So the probability of the point being in the small circle is . p p 4 = 1 64 16
  • 19. Example: A game at the state fair has a circular target with a radius of 10.7 cm on a square board measuring 30 cm on a side. Players win prizes if they throw a dart and hit the circular area only. What is the probability of winning with one throw of a dart? measure of geometric model representing P(E) = desired outcomes in the event measure of geometric model representing all outcomes in the same space
  • 20. Solution: Area of circle A = Area of entire square board A = p (10.7)2 = 359.7 302 = 900 359.7 .40 900 P (E) = = or 40% chance of hitting in the circle.