SlideShare ist ein Scribd-Unternehmen logo
1 von 7
MANDY QUINTANAR                            PAGE 1                                   10/7/2005


The New Seven Tools of Quality

The Affinity Diagram

       This Affinity Diagram is a very useful tool to use when brainstorming is the main

goal. This is an especially effective tool because it allows the participants to be both

creative and logical. By generating ideas the participants are tapping into their creative

side, and organizing those ideas allows them to exercise logic. According to

http://www.Pekin.net, there are 3 main instances when an affinity diagram is especially

useful. First, when the problem is complex or hard to understand. Second, when the

problem is very large and could appear to be overwhelming. Last, when support and

involvement of another group is required. There are six basic steps to creating an

affinity diagram:

       1.      Identify the problem or issue
       2.      Each person writes issues related to problem on note card or sticky notes
       3.      Organize the cards or sticky notes into logical piles
       4.      Name each pile with a header
       5.      Draw an affinity diagram
       6.      Discuss the piles created

Below is an example of an affinity diagram:


The Interrelationship Digraph

       The main purpose of the interrelationship digraph is to depict the relationships

between different issues. Often times this digraph is used in conjunction with the affinity
MANDY QUINTANAR                           PAGE 2                                    10/7/2005


diagram. It can be very powerful in that it reveals the impact one issue can have on other

issues. There are seven steps to create an interrelationship diagram:

       1.      Identify problem or issue
       2.      Write each element that relates to problem in a box
       3.      Draw arrows from the element that influences to the element that is
               influenced
       4.      Draw the strongest influence if two elements impact each other
       5.      Count the arrows
       6.      Elements with the most outgoing arrows will be root causes or drivers
       7.      The elements with the most incoming arrows will be key outcomes or
               results

Below is an example of an interrelationship digraph:


Tree Diagram

       A tree diagram is often used to discover the steps needed to solve a given

problem. It always the user(s) to gain further insight into the problem and helps the team

focus on specific tasks to complement the tasks at hand to solve the problem. There are

five major steps in creating a tree diagram. They are:

       1.      Determine the main goal
       2.      Be concise
       3.      Brainstorm the main tasks involved in solving the problem and add them
               to the tree
       4.      Brainstorm subtask that can also be added to the tree
       5.      Do this until all possibilities have been exhausted

Below is an example of a tree diagram:
MANDY QUINTANAR                           PAGE 3                                      10/7/2005


Prioritization Grid

       A prioritization grid is typically used to make decisions that require analysis of

several criteria. These situations could have several options that need to be compared

and several criteria that need to be considered. There are eight steps to develop a

prioritization grid. They are:

       1.      Identify your goal
       2.      Rank the criteria in order from least important to most important
       3.      Assign each criterion a weight for each option, and be sure the sum of all
               weights equals one
       4.      Sum the individual rating for each criterion to come to an overall ranking.
               Divide by the number of options to find an average ranking.
       5.      Rank order each option with respect to the criteria. Average the rankings
               and apply a completed ranking
       6.      Multiply the criteria weight by its associated criterion rank for each
               criterion in the matrix. The result in each cell of the matrix is called an
               importance score
       7.      Sum the importance scores for each alternative
       8.      Rank the alternatives in order of importance


Below is an example of a prioritization grid:
MANDY QUINTANAR                           PAGE 4                                   10/7/2005


Matrix Diagram

       The matrix diagram is a good tool to use to compare the efficiency and

effectiveness of alternatives based on the relationship between two criteria. It uses

criteria and symbols to visually depict the relationship between For example, a user

could analyze the relationship between cost and performance. Matrix diagrams can be

used with up to four dimensions. There are several styles of matrix diagrams. The most

common styles are the L-shape, the T- shape, and the Y-shape. There are five steps in

constructing a matrix diagram.

       1.      Decide the factors that are the most important to make the decision
       2.      Select the style of matrix that will help the best
       3.      Select the symbols to be used to represent the relationships
       4.      Complete the matrix using the determined factors and symbols
       5.      Analyze the completed matrix

Below is an example of a matrix diagram:


Process Decision Program Chart

       The Process Decision Program Chart is a good tool to use for contingency

planning. It helps to realize what could go wrong or problems associated with the

implementation of programs and improvements. There are four main steps to creating a

Process Decision Program Chart. They are:

       1.      List the steps in the process you wish to analyze
       2.      List what could go wrong at each step
       3.      List the counter measures to the problems
MANDY QUINTANAR                           PAGE 5                                  10/7/2005


       4.      Evaluate the counter measures by placing an O for feasible or an X for not
               feasible

Below is an example of a Process Decision Program Chart


Activity Network Diagrams

       The Activity Network Diagram is also known as the PERT diagram or the critical

path diagram. It evaluates the time it takes from the beginning of a process to the end of

a process and determines where there is slack time, and what parts of the process can be

improved in relation to time. There are several steps in developing an Activity Network

Diagram. They are:

       1.      List all tasks
       2.      Determine the time it takes for each task
       3.      For each task, determine the task that must happen before the current task
               can take place
       4.      Draw the network diagram
       5.      Compute early start and early finish times for each task
       6.      Compute the late start and late finish times for each task
       7.      Compute slack time
       8.      Determine the critical path

Below is an example of an Activity Network Diagram:
MANDY QUINTANAR                       PAGE 6                                10/7/2005


Where to find more information regarding the new seven tools of quality:

Foster Jr., S. Thomas. Managing Quality: An Integrative Approach. New Jersey:
        Prentice Hall, 2001

http://www.goalqpc.org/nonflash/whatweteach/RESEARCH/
http://www.goalqpc.org/nonflash/whatweteach/RESEARCH/7mp.html
http://www.pekin.net/
http://www.skymark.com/resources/tools/
http://www.uvm.edu/~auditwww/tools/?Page=interrel.html
http://www.systma.com/tqmtools/
MANDY QUINTANAR              PAGE 7                10/7/2005


                  The New Seven Tools of Quality


                             By:
                       Amanda Quintanar


                         Dr. Tom Foster
                             OP 380


                        November 25, 2001

Weitere ähnliche Inhalte

Was ist angesagt?

THE 5 DIMENSIONS OF PROBLEM SOLVING USING DINNA: CASE STUDY IN THE ELECTRONIC...
THE 5 DIMENSIONS OF PROBLEM SOLVING USING DINNA: CASE STUDY IN THE ELECTRONIC...THE 5 DIMENSIONS OF PROBLEM SOLVING USING DINNA: CASE STUDY IN THE ELECTRONIC...
THE 5 DIMENSIONS OF PROBLEM SOLVING USING DINNA: CASE STUDY IN THE ELECTRONIC...
IJDKP
 
Mgt tools and planning prof. moyani
Mgt tools and planning prof. moyaniMgt tools and planning prof. moyani
Mgt tools and planning prof. moyani
Jose Mendez
 
Continuos improvement tools ii
Continuos improvement tools iiContinuos improvement tools ii
Continuos improvement tools ii
DEPROCESS
 
Cause and effect diagram
Cause and effect diagramCause and effect diagram
Cause and effect diagram
Lizzette Danan
 

Was ist angesagt? (20)

Innovation explained
Innovation explainedInnovation explained
Innovation explained
 
New seven management tools
New seven management toolsNew seven management tools
New seven management tools
 
Affinity and relationship diagram
Affinity and relationship diagramAffinity and relationship diagram
Affinity and relationship diagram
 
Developing a problem tree
Developing a problem treeDeveloping a problem tree
Developing a problem tree
 
Tqm new tools
Tqm new toolsTqm new tools
Tqm new tools
 
New seven qc tools
New seven qc toolsNew seven qc tools
New seven qc tools
 
THE 5 DIMENSIONS OF PROBLEM SOLVING USING DINNA: CASE STUDY IN THE ELECTRONIC...
THE 5 DIMENSIONS OF PROBLEM SOLVING USING DINNA: CASE STUDY IN THE ELECTRONIC...THE 5 DIMENSIONS OF PROBLEM SOLVING USING DINNA: CASE STUDY IN THE ELECTRONIC...
THE 5 DIMENSIONS OF PROBLEM SOLVING USING DINNA: CASE STUDY IN THE ELECTRONIC...
 
New7managementtools ppt
New7managementtools pptNew7managementtools ppt
New7managementtools ppt
 
7 steps to master problem solving
7 steps to master problem solving7 steps to master problem solving
7 steps to master problem solving
 
04.problem situation
04.problem situation04.problem situation
04.problem situation
 
Seven management and planning tools
Seven management and planning tools Seven management and planning tools
Seven management and planning tools
 
Mgt tools and planning prof. moyani
Mgt tools and planning prof. moyaniMgt tools and planning prof. moyani
Mgt tools and planning prof. moyani
 
01.introduction
01.introduction01.introduction
01.introduction
 
7 new QC TOOLS
7 new QC TOOLS7 new QC TOOLS
7 new QC TOOLS
 
Csc 102 lecture note(introduction to problem solving)
Csc 102 lecture note(introduction to problem solving)Csc 102 lecture note(introduction to problem solving)
Csc 102 lecture note(introduction to problem solving)
 
Management quality tools (6) 19 1-2016
Management quality tools (6)  19 1-2016Management quality tools (6)  19 1-2016
Management quality tools (6) 19 1-2016
 
Continuos improvement tools ii
Continuos improvement tools iiContinuos improvement tools ii
Continuos improvement tools ii
 
New seven management tools
New seven management toolsNew seven management tools
New seven management tools
 
7 qc tools
7 qc tools7 qc tools
7 qc tools
 
Cause and effect diagram
Cause and effect diagramCause and effect diagram
Cause and effect diagram
 

Andere mochten auch

Penyusunan buku pedoman, juklak, juknis dan standar gizi
Penyusunan buku pedoman, juklak, juknis  dan standar giziPenyusunan buku pedoman, juklak, juknis  dan standar gizi
Penyusunan buku pedoman, juklak, juknis dan standar gizi
Agus ParLy
 

Andere mochten auch (13)

Virtual Tour
Virtual TourVirtual Tour
Virtual Tour
 
2012 Children's Program
2012 Children's Program2012 Children's Program
2012 Children's Program
 
For Erazmus Plus project by Blanka & Magda
For Erazmus Plus project by Blanka & MagdaFor Erazmus Plus project by Blanka & Magda
For Erazmus Plus project by Blanka & Magda
 
Unit2
Unit2Unit2
Unit2
 
2012 June programs and On-going programs
2012 June programs and On-going programs2012 June programs and On-going programs
2012 June programs and On-going programs
 
MY_SNS
MY_SNSMY_SNS
MY_SNS
 
0
00
0
 
Performance Leadership Paschane Aplin 2011
Performance Leadership Paschane Aplin 2011Performance Leadership Paschane Aplin 2011
Performance Leadership Paschane Aplin 2011
 
Código Ético de COMSA Corporación
Código Ético de COMSA CorporaciónCódigo Ético de COMSA Corporación
Código Ético de COMSA Corporación
 
Key Factors required to Implement Total Quality Management within the Textile...
Key Factors required to Implement Total Quality Management within the Textile...Key Factors required to Implement Total Quality Management within the Textile...
Key Factors required to Implement Total Quality Management within the Textile...
 
Effect of nanofluid on heat transfer characteristics of double pipe heat exch...
Effect of nanofluid on heat transfer characteristics of double pipe heat exch...Effect of nanofluid on heat transfer characteristics of double pipe heat exch...
Effect of nanofluid on heat transfer characteristics of double pipe heat exch...
 
Sistem pernafasan
Sistem pernafasanSistem pernafasan
Sistem pernafasan
 
Penyusunan buku pedoman, juklak, juknis dan standar gizi
Penyusunan buku pedoman, juklak, juknis  dan standar giziPenyusunan buku pedoman, juklak, juknis  dan standar gizi
Penyusunan buku pedoman, juklak, juknis dan standar gizi
 

Ähnlich wie The New Seven Tools Of Quality Paper

7 New QC Tools.ppt
7 New QC Tools.ppt7 New QC Tools.ppt
7 New QC Tools.ppt
neeru.s
 
1.2.3.4.5.6.7.8..docx
1.2.3.4.5.6.7.8..docx1.2.3.4.5.6.7.8..docx
1.2.3.4.5.6.7.8..docx
jeremylockett77
 
Individual Case InstructionsYou will identify a problem that req
Individual Case InstructionsYou will identify a problem that reqIndividual Case InstructionsYou will identify a problem that req
Individual Case InstructionsYou will identify a problem that req
LizbethQuinonez813
 
Individual Case InstructionsYou will identify a problem that req
Individual Case InstructionsYou will identify a problem that reqIndividual Case InstructionsYou will identify a problem that req
Individual Case InstructionsYou will identify a problem that req
LaticiaGrissomzz
 
DAT 520 Final Project Guidelines and Rubric Overview .docx
DAT 520 Final Project Guidelines and Rubric  Overview .docxDAT 520 Final Project Guidelines and Rubric  Overview .docx
DAT 520 Final Project Guidelines and Rubric Overview .docx
simonithomas47935
 
@Quality management tools
@Quality management tools@Quality management tools
@Quality management tools
keshavrasal
 

Ähnlich wie The New Seven Tools Of Quality Paper (20)

Advanced quality tools
Advanced quality toolsAdvanced quality tools
Advanced quality tools
 
New 7QC tools for the quality person during RCa
New 7QC tools for the quality person during RCaNew 7QC tools for the quality person during RCa
New 7QC tools for the quality person during RCa
 
Brainstorming
BrainstormingBrainstorming
Brainstorming
 
Assignment 6.1
Assignment 6.1Assignment 6.1
Assignment 6.1
 
7 New QC Tools.ppt
7 New QC Tools.ppt7 New QC Tools.ppt
7 New QC Tools.ppt
 
1.2.3.4.5.6.7.8..docx
1.2.3.4.5.6.7.8..docx1.2.3.4.5.6.7.8..docx
1.2.3.4.5.6.7.8..docx
 
concept of evaluation "Character insight"
concept of evaluation "Character insight"concept of evaluation "Character insight"
concept of evaluation "Character insight"
 
Visual tools for Risk Management Process
Visual tools for Risk Management ProcessVisual tools for Risk Management Process
Visual tools for Risk Management Process
 
Individual Case InstructionsYou will identify a problem that req
Individual Case InstructionsYou will identify a problem that reqIndividual Case InstructionsYou will identify a problem that req
Individual Case InstructionsYou will identify a problem that req
 
Individual Case InstructionsYou will identify a problem that req
Individual Case InstructionsYou will identify a problem that reqIndividual Case InstructionsYou will identify a problem that req
Individual Case InstructionsYou will identify a problem that req
 
Log frame-analysis
Log frame-analysisLog frame-analysis
Log frame-analysis
 
7 QC Tools training presentation
7 QC Tools training presentation7 QC Tools training presentation
7 QC Tools training presentation
 
Qaulity tools
Qaulity toolsQaulity tools
Qaulity tools
 
Quality tools in JUST 2 HOURS !!
Quality tools in JUST 2 HOURS !!Quality tools in JUST 2 HOURS !!
Quality tools in JUST 2 HOURS !!
 
Analysis in Action 21 September 2021
Analysis in Action 21 September 2021Analysis in Action 21 September 2021
Analysis in Action 21 September 2021
 
DAT 520 Final Project Guidelines and Rubric Overview .docx
DAT 520 Final Project Guidelines and Rubric  Overview .docxDAT 520 Final Project Guidelines and Rubric  Overview .docx
DAT 520 Final Project Guidelines and Rubric Overview .docx
 
quality-tools.ppt
quality-tools.pptquality-tools.ppt
quality-tools.ppt
 
Usability testing
Usability testingUsability testing
Usability testing
 
@Quality management tools
@Quality management tools@Quality management tools
@Quality management tools
 
How to prioritize criteria - process overview
How to prioritize criteria - process overviewHow to prioritize criteria - process overview
How to prioritize criteria - process overview
 

Mehr von ahmad bassiouny (20)

Work Study & Productivity
Work Study & ProductivityWork Study & Productivity
Work Study & Productivity
 
Work Study
Work StudyWork Study
Work Study
 
Motion And Time Study
Motion And Time StudyMotion And Time Study
Motion And Time Study
 
Motion Study
Motion StudyMotion Study
Motion Study
 
The Christmas Story
The Christmas StoryThe Christmas Story
The Christmas Story
 
Turkey Photos
Turkey PhotosTurkey Photos
Turkey Photos
 
Mission Bo Kv3
Mission Bo Kv3Mission Bo Kv3
Mission Bo Kv3
 
Miramar
MiramarMiramar
Miramar
 
Mom
MomMom
Mom
 
Linearization
LinearizationLinearization
Linearization
 
Kblmt B000 Intro Kaizen Based Lean Manufacturing
Kblmt B000 Intro Kaizen Based Lean ManufacturingKblmt B000 Intro Kaizen Based Lean Manufacturing
Kblmt B000 Intro Kaizen Based Lean Manufacturing
 
How To Survive
How To SurviveHow To Survive
How To Survive
 
Dad
DadDad
Dad
 
Ancient Hieroglyphics
Ancient HieroglyphicsAncient Hieroglyphics
Ancient Hieroglyphics
 
Dubai In 2009
Dubai In 2009Dubai In 2009
Dubai In 2009
 
DesignPeopleSystem
DesignPeopleSystemDesignPeopleSystem
DesignPeopleSystem
 
Organizational Behavior
Organizational BehaviorOrganizational Behavior
Organizational Behavior
 
Work Study Workshop
Work Study WorkshopWork Study Workshop
Work Study Workshop
 
Workstudy
WorkstudyWorkstudy
Workstudy
 
Time And Motion Study
Time And  Motion  StudyTime And  Motion  Study
Time And Motion Study
 

Kürzlich hochgeladen

Spellings Wk 3 English CAPS CARES Please Practise
Spellings Wk 3 English CAPS CARES Please PractiseSpellings Wk 3 English CAPS CARES Please Practise
Spellings Wk 3 English CAPS CARES Please Practise
AnaAcapella
 

Kürzlich hochgeladen (20)

TỔNG ÔN TẬP THI VÀO LỚP 10 MÔN TIẾNG ANH NĂM HỌC 2023 - 2024 CÓ ĐÁP ÁN (NGỮ Â...
TỔNG ÔN TẬP THI VÀO LỚP 10 MÔN TIẾNG ANH NĂM HỌC 2023 - 2024 CÓ ĐÁP ÁN (NGỮ Â...TỔNG ÔN TẬP THI VÀO LỚP 10 MÔN TIẾNG ANH NĂM HỌC 2023 - 2024 CÓ ĐÁP ÁN (NGỮ Â...
TỔNG ÔN TẬP THI VÀO LỚP 10 MÔN TIẾNG ANH NĂM HỌC 2023 - 2024 CÓ ĐÁP ÁN (NGỮ Â...
 
Unit-V; Pricing (Pharma Marketing Management).pptx
Unit-V; Pricing (Pharma Marketing Management).pptxUnit-V; Pricing (Pharma Marketing Management).pptx
Unit-V; Pricing (Pharma Marketing Management).pptx
 
Single or Multiple melodic lines structure
Single or Multiple melodic lines structureSingle or Multiple melodic lines structure
Single or Multiple melodic lines structure
 
Google Gemini An AI Revolution in Education.pptx
Google Gemini An AI Revolution in Education.pptxGoogle Gemini An AI Revolution in Education.pptx
Google Gemini An AI Revolution in Education.pptx
 
Unit 3 Emotional Intelligence and Spiritual Intelligence.pdf
Unit 3 Emotional Intelligence and Spiritual Intelligence.pdfUnit 3 Emotional Intelligence and Spiritual Intelligence.pdf
Unit 3 Emotional Intelligence and Spiritual Intelligence.pdf
 
Interdisciplinary_Insights_Data_Collection_Methods.pptx
Interdisciplinary_Insights_Data_Collection_Methods.pptxInterdisciplinary_Insights_Data_Collection_Methods.pptx
Interdisciplinary_Insights_Data_Collection_Methods.pptx
 
Accessible Digital Futures project (20/03/2024)
Accessible Digital Futures project (20/03/2024)Accessible Digital Futures project (20/03/2024)
Accessible Digital Futures project (20/03/2024)
 
Jamworks pilot and AI at Jisc (20/03/2024)
Jamworks pilot and AI at Jisc (20/03/2024)Jamworks pilot and AI at Jisc (20/03/2024)
Jamworks pilot and AI at Jisc (20/03/2024)
 
Key note speaker Neum_Admir Softic_ENG.pdf
Key note speaker Neum_Admir Softic_ENG.pdfKey note speaker Neum_Admir Softic_ENG.pdf
Key note speaker Neum_Admir Softic_ENG.pdf
 
80 ĐỀ THI THỬ TUYỂN SINH TIẾNG ANH VÀO 10 SỞ GD – ĐT THÀNH PHỐ HỒ CHÍ MINH NĂ...
80 ĐỀ THI THỬ TUYỂN SINH TIẾNG ANH VÀO 10 SỞ GD – ĐT THÀNH PHỐ HỒ CHÍ MINH NĂ...80 ĐỀ THI THỬ TUYỂN SINH TIẾNG ANH VÀO 10 SỞ GD – ĐT THÀNH PHỐ HỒ CHÍ MINH NĂ...
80 ĐỀ THI THỬ TUYỂN SINH TIẾNG ANH VÀO 10 SỞ GD – ĐT THÀNH PHỐ HỒ CHÍ MINH NĂ...
 
2024-NATIONAL-LEARNING-CAMP-AND-OTHER.pptx
2024-NATIONAL-LEARNING-CAMP-AND-OTHER.pptx2024-NATIONAL-LEARNING-CAMP-AND-OTHER.pptx
2024-NATIONAL-LEARNING-CAMP-AND-OTHER.pptx
 
How to Create and Manage Wizard in Odoo 17
How to Create and Manage Wizard in Odoo 17How to Create and Manage Wizard in Odoo 17
How to Create and Manage Wizard in Odoo 17
 
General Principles of Intellectual Property: Concepts of Intellectual Proper...
General Principles of Intellectual Property: Concepts of Intellectual  Proper...General Principles of Intellectual Property: Concepts of Intellectual  Proper...
General Principles of Intellectual Property: Concepts of Intellectual Proper...
 
How to Give a Domain for a Field in Odoo 17
How to Give a Domain for a Field in Odoo 17How to Give a Domain for a Field in Odoo 17
How to Give a Domain for a Field in Odoo 17
 
FSB Advising Checklist - Orientation 2024
FSB Advising Checklist - Orientation 2024FSB Advising Checklist - Orientation 2024
FSB Advising Checklist - Orientation 2024
 
Making communications land - Are they received and understood as intended? we...
Making communications land - Are they received and understood as intended? we...Making communications land - Are they received and understood as intended? we...
Making communications land - Are they received and understood as intended? we...
 
Spellings Wk 3 English CAPS CARES Please Practise
Spellings Wk 3 English CAPS CARES Please PractiseSpellings Wk 3 English CAPS CARES Please Practise
Spellings Wk 3 English CAPS CARES Please Practise
 
Sensory_Experience_and_Emotional_Resonance_in_Gabriel_Okaras_The_Piano_and_Th...
Sensory_Experience_and_Emotional_Resonance_in_Gabriel_Okaras_The_Piano_and_Th...Sensory_Experience_and_Emotional_Resonance_in_Gabriel_Okaras_The_Piano_and_Th...
Sensory_Experience_and_Emotional_Resonance_in_Gabriel_Okaras_The_Piano_and_Th...
 
How to Manage Global Discount in Odoo 17 POS
How to Manage Global Discount in Odoo 17 POSHow to Manage Global Discount in Odoo 17 POS
How to Manage Global Discount in Odoo 17 POS
 
Sociology 101 Demonstration of Learning Exhibit
Sociology 101 Demonstration of Learning ExhibitSociology 101 Demonstration of Learning Exhibit
Sociology 101 Demonstration of Learning Exhibit
 

The New Seven Tools Of Quality Paper

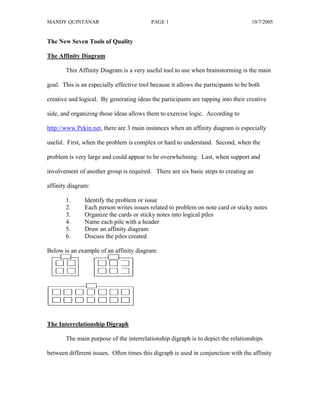
  • 1. MANDY QUINTANAR PAGE 1 10/7/2005 The New Seven Tools of Quality The Affinity Diagram This Affinity Diagram is a very useful tool to use when brainstorming is the main goal. This is an especially effective tool because it allows the participants to be both creative and logical. By generating ideas the participants are tapping into their creative side, and organizing those ideas allows them to exercise logic. According to http://www.Pekin.net, there are 3 main instances when an affinity diagram is especially useful. First, when the problem is complex or hard to understand. Second, when the problem is very large and could appear to be overwhelming. Last, when support and involvement of another group is required. There are six basic steps to creating an affinity diagram: 1. Identify the problem or issue 2. Each person writes issues related to problem on note card or sticky notes 3. Organize the cards or sticky notes into logical piles 4. Name each pile with a header 5. Draw an affinity diagram 6. Discuss the piles created Below is an example of an affinity diagram: The Interrelationship Digraph The main purpose of the interrelationship digraph is to depict the relationships between different issues. Often times this digraph is used in conjunction with the affinity
  • 2. MANDY QUINTANAR PAGE 2 10/7/2005 diagram. It can be very powerful in that it reveals the impact one issue can have on other issues. There are seven steps to create an interrelationship diagram: 1. Identify problem or issue 2. Write each element that relates to problem in a box 3. Draw arrows from the element that influences to the element that is influenced 4. Draw the strongest influence if two elements impact each other 5. Count the arrows 6. Elements with the most outgoing arrows will be root causes or drivers 7. The elements with the most incoming arrows will be key outcomes or results Below is an example of an interrelationship digraph: Tree Diagram A tree diagram is often used to discover the steps needed to solve a given problem. It always the user(s) to gain further insight into the problem and helps the team focus on specific tasks to complement the tasks at hand to solve the problem. There are five major steps in creating a tree diagram. They are: 1. Determine the main goal 2. Be concise 3. Brainstorm the main tasks involved in solving the problem and add them to the tree 4. Brainstorm subtask that can also be added to the tree 5. Do this until all possibilities have been exhausted Below is an example of a tree diagram:
  • 3. MANDY QUINTANAR PAGE 3 10/7/2005 Prioritization Grid A prioritization grid is typically used to make decisions that require analysis of several criteria. These situations could have several options that need to be compared and several criteria that need to be considered. There are eight steps to develop a prioritization grid. They are: 1. Identify your goal 2. Rank the criteria in order from least important to most important 3. Assign each criterion a weight for each option, and be sure the sum of all weights equals one 4. Sum the individual rating for each criterion to come to an overall ranking. Divide by the number of options to find an average ranking. 5. Rank order each option with respect to the criteria. Average the rankings and apply a completed ranking 6. Multiply the criteria weight by its associated criterion rank for each criterion in the matrix. The result in each cell of the matrix is called an importance score 7. Sum the importance scores for each alternative 8. Rank the alternatives in order of importance Below is an example of a prioritization grid:
  • 4. MANDY QUINTANAR PAGE 4 10/7/2005 Matrix Diagram The matrix diagram is a good tool to use to compare the efficiency and effectiveness of alternatives based on the relationship between two criteria. It uses criteria and symbols to visually depict the relationship between For example, a user could analyze the relationship between cost and performance. Matrix diagrams can be used with up to four dimensions. There are several styles of matrix diagrams. The most common styles are the L-shape, the T- shape, and the Y-shape. There are five steps in constructing a matrix diagram. 1. Decide the factors that are the most important to make the decision 2. Select the style of matrix that will help the best 3. Select the symbols to be used to represent the relationships 4. Complete the matrix using the determined factors and symbols 5. Analyze the completed matrix Below is an example of a matrix diagram: Process Decision Program Chart The Process Decision Program Chart is a good tool to use for contingency planning. It helps to realize what could go wrong or problems associated with the implementation of programs and improvements. There are four main steps to creating a Process Decision Program Chart. They are: 1. List the steps in the process you wish to analyze 2. List what could go wrong at each step 3. List the counter measures to the problems
  • 5. MANDY QUINTANAR PAGE 5 10/7/2005 4. Evaluate the counter measures by placing an O for feasible or an X for not feasible Below is an example of a Process Decision Program Chart Activity Network Diagrams The Activity Network Diagram is also known as the PERT diagram or the critical path diagram. It evaluates the time it takes from the beginning of a process to the end of a process and determines where there is slack time, and what parts of the process can be improved in relation to time. There are several steps in developing an Activity Network Diagram. They are: 1. List all tasks 2. Determine the time it takes for each task 3. For each task, determine the task that must happen before the current task can take place 4. Draw the network diagram 5. Compute early start and early finish times for each task 6. Compute the late start and late finish times for each task 7. Compute slack time 8. Determine the critical path Below is an example of an Activity Network Diagram:
  • 6. MANDY QUINTANAR PAGE 6 10/7/2005 Where to find more information regarding the new seven tools of quality: Foster Jr., S. Thomas. Managing Quality: An Integrative Approach. New Jersey: Prentice Hall, 2001 http://www.goalqpc.org/nonflash/whatweteach/RESEARCH/ http://www.goalqpc.org/nonflash/whatweteach/RESEARCH/7mp.html http://www.pekin.net/ http://www.skymark.com/resources/tools/ http://www.uvm.edu/~auditwww/tools/?Page=interrel.html http://www.systma.com/tqmtools/
  • 7. MANDY QUINTANAR PAGE 7 10/7/2005 The New Seven Tools of Quality By: Amanda Quintanar Dr. Tom Foster OP 380 November 25, 2001