Regression analysis: Simple Linear Regression Multiple Linear Regression
AEM Corporate Update - December 2009 Presentation
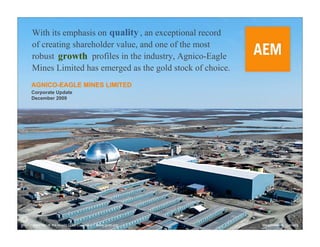
1. With its emphasis on quality , an exceptional record
of creating shareholder value, and one of the most
robust growth profiles in the industry, Agnico-Eagle
Mines Limited has emerged as the gold stock of choice.
AGNICO-EAGLE MINES LIMITED
Corporate Update
December 2009
Member of the World Gold Council www.gold.org Meadowbank, Canada
2. Forward Looking Statements
The information in this document has been prepared as at December 1, 2009. Certain statements contained in this document constitute
“forward-looking statements” within the meaning of the United States Private Securities Litigation Reform Act of 1995 and forward looking
information under the provisions of Canadian provincial securities laws. When used in this document, the words “anticipate”, “expect”,
“estimate”, “forecast”, “will”, “planned”, and similar expressions are intended to identify forward-looking statements or information.
Such statements include without limitation: statements regarding timing and amounts of capital expenditures and other assumptions;
estimates of future reserves, resources, mineral production and sales; estimates of mine life; estimates of future internal rates of return,
mining costs, cash costs, minesite costs and other expenses; estimates of future capital expenditures and other cash needs, and
expectations as to the funding thereof; statements and information as to the projected development of certain ore deposits, including
estimates of exploration, development and production and other capital costs, and estimates of the timing of such exploration,
development and production or decisions with respect to such exploration, development and production; estimates of reserves and
resources, and statements and information regarding anticipated future exploration; the anticipated timing of events with respect to the
Company's minesites and statements and information regarding the sufficiency of the Company's cash resources. Such statements and
information reflect the Company's views as at the date of this document and are subject to certain risks, uncertainties and assumptions,
and undue reliance should not be placed on such statements and information. Many factors, known and unknown could cause the actual
results to be materially different from those expressed or implied by such forward looking statements and information. Such risks include,
but are not limited to: the volatility of prices of gold and other metals; uncertainty of mineral reserves, mineral resources, mineral grades
and mineral recovery estimates; uncertainty of future production, capital expenditures, and other costs; currency fluctuations; financing of
additional capital requirements; cost of exploration and development programs; mining risks; community protests; risks associated with
foreign operations; governmental and environmental regulation; the volatility of the Company's stock price; and risks associated with the
Company's byproduct metal derivative strategies. For a more detailed discussion of such risks and other factors that may affect the
Company’s ability to achieve the expectations set forth in the forward-looking statements contained in this document, see the Company's
Annual Report on Form 20-F for the year ended December 31, 2008, as well as the Company's other filings with the Canadian Securities
Administrators and the U.S. Securities and Exchange Commission. The Company does not intend, and does not assume any obligation,
to update these forward-looking statements and information. Marc Legault, a Qualified Person and the Company’s Vice-President, Project
Development, reviewed the technical information disclosed herein. For a detailed breakdown of the Company’s reserve and resource
position see the February 18, 2009 press release on the Company’s website. That press release also lists the Qualified Persons for each
project.
2
3. Note To Investors
Note to Investors Regarding the Use of Non-GAAP Financial Measures
This document presents estimates of future "total cash cost per ounce" and "minesite cost per tonne" that are not recognized measures
under United States generally accepted accounting principles ("US GAAP"). This data may not be comparable to data presented by other
gold producers. These future estimates are based upon the total cash costs per ounce and minesite costs per tonne that the Company
expects to incur to mine gold at the applicable projects and do not include production costs attributable to accretion expense and other
asset retirement costs, which will vary over time as each project is developed and mined. It is therefore not practicable to reconcile these
forward-looking non-GAAP financial measures to the most comparable GAAP measure. A reconciliation of the Company's total cash cost
per ounce and minesite cost per tonne to the most comparable financial measures calculated and presented in accordance with US GAAP
for the Company's historical results of operations is set forth in the notes to the financial statements included in the Company's Annual
Information Form and Annual Report on Form 20-F, for the year ended December 31, 2008, as well as the Company's other filings with
the Canadian Securities Administrators and the SEC.
3
4. Corporate Strategy
Strategy Remains Focused On Per Share Metrics
■ Increase gold production
■ Record nine month gold production of 329,628 oz
■ Five internal expansions expected to contribute to
continued growth post-2010
■ Grow gold reserves
■ Record reserves of 18.1 million ounces*
■ Four of six deposits may ultimately exceed 5 million oz
■ Acquire small, think big
■ Since being acquired, gold reserves and resources up
89%* in Finland, Mexico and Nunavut
■ Be a low-cost leader
■ Expect to remain in the lowest quartile of total cash
cost per ounce long term
■ Maintain a solid financial profile
■ Credit facilities of $900M with a large syndicate of
banks
* See attached reserve and resource tables
4
5. Operating Results
Record quarterly gold production expected in Q4/09
Q3 Q3 2009 Total Cash Costs
All $ amounts are in US$,
unless otherwise indicated 2009 2008 Estimate ($/oz)
$340
est.
Gold 118,763* 68,753** 500,000
(ounces) $269
$188
$155 $182 $162
Silver 1,011* 1,167 4,200 $56 $43
(ounces in thousands)
Zinc 12,516 18,040 58,000
(tonnes)
Copper 1,400 1,567 6,800 -$365
(tonnes)
Total cash
$449 $240 $340***
costs ($/oz) -$690
* Includes 3,175 ounces Au and 16,000 ounces Ag of non commercial production from Pinos Altos 00 01 02 03 04 05 06 07 08 09E
** Includes 1,784 ounces of non commercial production from Goldex
*** Assumptions for 2009 include Ag $11/oz, Zn $1,300/t, Cu $4,000/t, C$/US$ of 1.22.and US$/Euro of 1.30
5
6. Strong Financial Position
Only 171 million shares, fully diluted, over 52 years of operating history
All amounts are in US$, Sept. 30 June 30
unless otherwise indicated 2009 2009
Cash and cash equivalents $239.0 $173.9
(millions)
Long term debt $685.0 $485.0
(millions)
Available credit facilities $194.8 $394.9
(millions)
Common shares outstanding 156.5 156.0
(millions)
Common shares, fully diluted 171.3 170.8
(millions)
6
8. Gold reserves per share up almost 5x over past 11 years
Has provided much better leverage to gold price than ETF’s
■ Shares outstanding increased only 3.1 times since 1998. Gold reserves up 13.9 times
■ Targeting additional reserve conversion at Kittila, Pinos Altos, Goldex and Meadowbank
■ Uniquely positioned with potential for up to four 5 million ounce gold deposits
GOLD RESERVES 20-21
(Millions of Ounces)
18.1
16.7
Meadowbank
12.5
10.4
Pinos Altos
7.9 7.9
Kittila
Lapa
4.0
3.0 3.3 3.3 Goldex
1.3
LaRonde
1998 1999 2000 2001 2002 2003 2004 2005 2006 2007 2008 2010
EST.
8
9. Gold Reserves Per Share Among Highest In Industry
Growth In Proven and Probable Reserves / Share
300%
250%
Agnico-Eagle
Goldcorp
200%
150%
IAMGOLD
100% Barrick
Newmont
Kinross
Eldorado
Yamana
50%
0%
2002 2003 2004 2005 2006 2007 2008
A g ni co - Eag le B ar r i ck El d o r ad o G o ld co r p I A M GO LD Ki nr o ss N ew mo nt Y amana
Source: Company filings
9
10. Industry Leading1 Gold Production Growth Estimates
Studies on potential internal expansions underway at Pinos Altos,
Meadowbank & Kittila
Payable Gold Production
(ounces)
1,800,000
1,600,000
1,400,000
1,200,000
1,000,000
800,000
600,000
400,000
200,000
0
2008A 2009E 2010E 2011E 2012E 2013E 2014E
LaRonde Goldex Lapa Kittila Pinos Altos Meadowbank
1 For an intermediate or senior gold producer
10
11. Leading Growth Profile Among Senior Producers
Gold production (oz) / 1000 shares
14
2007A 2008A 2009E 2010E 2011E
12
10
8
6
4
2
0
New m ont Buenaventura Randgold Agnico-Eagle Barrick Goldcorp Kinross IAMGold Yam ana Eldorado
Source: AEM guidance, Merrill Lynch estimates – Oct/09
11
12. Production Growth At Low Costs Leads To Strong
Cash Flow Generation
Strong cash flow per share in 2010*
$6
2009 2010
$5
4.16
$4
$3
$2
1.18
$1
$0
Newmont
IAMGOLD
NXG
Yamana
YGAM
GSS
Barrick
Kinross
YCG
Agnico-Eagle
Goldcorp
Eldorado
* Source: Merrill Lynch Research - 11/23/09. Before working capital adjustments. Assumes Au price of US$960/oz in 2009 and US$1,110/oz in 2010.
12
15. Operations At A Glance
Five mines now operating. One new gold mine nearing completion
■ Located in mining-friendly regions of low political risk
■ 100% owned, with low total acquisition costs
■ Each region has long-term mining camp potential
Fraser Institute’s Fraser Institute’s Fraser Institute’s
ranking
1 ranking
1 ranking
14
LaRonde Goldex Kittila
QUEBEC, CANADA QUEBEC, CANADA KITTILA, FINLAND
Fraser Institute’s Fraser Institute’s Fraser Institute’s
ranking
1 ranking
28 ranking
44
Lapa Pinos Altos Meadowbank
QUEBEC, CANADA CHIHUAHUA, MEXICO NUNAVUT, CANADA
Fraser Institute’s 2008/2009 ranking of 71 mining jurisdictions 15
16. LaRonde – Canada
Good production and cost performance continues
■ Project
■ Shaft sinking for Extension complete.
2,854 metres final depth
■ Start of production from Extension expected in 2011.
On time, on budget
■ 2009 Exploration Au reserves (m oz)
Average reserve
5.0
■ Focus on resource conversion, additional grade (g/t)
4.3
potential at depth and to the East Measured & Indicated
0.4
resource (m oz)
■ Drilling possible extension of Westwood zone on Ellison Inferred resource
3.0
(m oz)
Estimated average
320
production (k oz/yr)
Est. LOM (years) 13
2009 exploration budget $1M
16
17. Goldex – Canada
Drilling and blasting approximately 1.5 years ahead of schedule
■ Mined lower grade eastern stope during Q3
■ Project
■ Increase production rate from 6,900 tpd to 8,000 tpd
(an additional 20,000 oz/yr), starting in late-2011
■ Capital cost approximately $10 million. Estimated IRR 76% Au reserves (m oz) 1.6
■ 2009 Exploration
Average reserve
2.1
grade (g/t)
■ Focus on resource conversion, exploration to west, Measured & Indicated
resource (m oz)
0.0
east and at depth Inferred resource
0.9
(m oz)
Estimated average
175
production (k oz/yr)
Est. LOM (yrs) 8
2009 exploration budget $1M
17
18. Lapa – Canada
Efforts focused on reducing mining cycle time
■ Operations
■ Commercial production achieved May 1, 2009
■ Milled grade reconciles with expected reserve grade
■ Process optimization underway
– mill recoveries approaching design
Au reserves (m oz) 1.1
■ 2009 Exploration Average reserve
grade (g/t)
8.8
■ Focus on resource conversion, further exploration upside Measured & Indicated
0.1
at depth and to the East resource (m oz)
Inferred resource
0.2
(m oz)
Estimated average
115
production (k oz/yr)
Est. LOM (yrs) 6
2009 exploration budget $1M
18
19. Kittila – Finland
Overall mill recoveries now exceeding 80%
■ Mill has periodically exceeded design throughput
and recoveries. Optimization ongoing
■ Project
■ Examining options to significantly increase production
rate of this growing deposit. Study results expected in 2010 Au reserves (m oz) 3.2
■ 2009 Exploration Average reserve
grade (g/t)
4.7
■ Focus on resource conversion, expansion below Suuri Measured & Indicated
0.3
and Roura, and along strike resource (m oz)
Inferred resource
2.5
(m oz)
Estimated average
150
production (k oz/yr)
Est. LOM (yrs) 14
2009 exploration budget $16M
19
20. Kittila – Mill Optimization Underway
Gold recoveries progressing as expected
Gold Recovery Gold Payable
(%) (ounces)
90 33,500 oz 14000
18,284 oz
80 23,000 oz 12000
13,771 oz
70 13,300 oz
10000
60
8000
50
E
6000
s
40 t
4,514 oz i
m 4000
30
a
t
e 2000
20
10 0
J F M A M J J A S O N D
Au Ounces : Realised Forecasted / May 2009 Estimated / October 2009
Au Recovery : Forecasted / May 2009
Realised
20
21. Kittila – Expansion Opportunity
Examining large capacity increase. Potential reserve increases at depth
■ Studying production rate of 300,000 ounces per year
■ Examining underground mining via shaft access
■ Orebody remains open at depth and along strike
■ Eleven drills currently operating
21
22. Pinos Altos – Mexico
Plant commissioning in progress. Commercial production
expected in Q4 2009
■ Mill recoveries as expected but slower tonnage
ramp-up due to tailings filters
■ Project
■ Plant expansion from 4,000 tpd to 6,000 tpd is being
studied. Reflects 125% increase in reserve tonnage Au reserves (m oz) 3.6
since 2007 Average reserve
2.7
grade (g/t)
■ Stand-alone heap leach project at Creston Mascota underway
Measured & Indicated
■ 2009 Exploration resource (m oz)
0.4
Inferred resource
■ Potential to develop additional satellite (m oz)
0.2
deposits (Cubiro, Sinter, San Eligio) Estimated average
165
■ Focus on resource conversion, expansion of production (k oz/yr)
Pinos Altos zones, Reyna de Plata, Creston Mascota Est. LOM (yrs) 20
2009 exploration budget $12M
22
23. Meadowbank – Canada
Plant start-up on schedule for Q1 2010
■ All necessary supplies and consumables for
project completion now on site
■ Cushion for start-up provided by large
surface ore stockpile
■ Project Au reserves (m oz) 3.6
■ Potential production increase from 8,500 tpd to 10,000 tpd Average reserve
3.5
■ Study results expected Q3 2009; review in Q4 2009 grade (g/t)
Measured & Indicated
■ 2009 Exploration
1.5
resource (m oz)
Inferred resource
■ Focus on resource conversion and expansion of Vault, (m oz)
0.4
Goose South and Portage Estimated average
350
production (k oz/yr)
Est. LOM (yrs) 10
2009 exploration budget $11M
23
24. Upcoming News
Exploration driving expansions
• Scoping study on
Q4 expansion at Meadowbank
• Budget and production
guidance
• Technical Session in
Toronto
• Dividend announcement
• 2009 Reserves and
Q1 Resources
24
29. A solid financial position, low-cost structure, well-funded
growth projects in regions of low political risk, and a
focused, consistent strategy put Agnico-Eagle in a strong
position to continue creating exceptional per share value.
Sean Boyd
Vice Chairman and Chief Executive Officer
Ebe Scherkus
President and Chief Operating Officer
David Garofalo
Senior Vice President, Finance and Chief Financial Officer
Trading Symbol: AEM on TSX & NYSE
Executive and Registered Office:
145 King Street East, Suite 400
Toronto, Ontario, Canada, M5C 2Y7
Tel: 416-947-1212
Toll-Free: 888-822-6714
Fax: 416-367-4681
www.agnico-eagle.com
Investor Relations:
416-947-1212
info@agnico-eagle.com
Member of the World Gold Council www.gold.org