ADP National Franchise Report: February 2015
•
0 gefällt mir•916 views

http://bit.ly/ADPNFRFeb15
Empfohlen

Empfohlen
Weitere ähnliche Inhalte
Ähnlich wie ADP National Franchise Report: February 2015
Ähnlich wie ADP National Franchise Report: February 2015 (20)
Mehr von ADP, LLC
Mehr von ADP, LLC (20)
Kürzlich hochgeladen
Kürzlich hochgeladen (20)
ADP National Franchise Report: February 2015
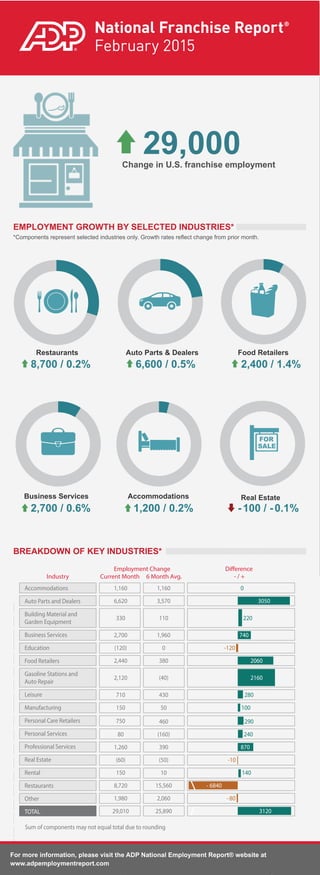
- 1. National Franchise Report® February 2015 Change in U.S. franchise employment *Components represent selected industries only. Growth rates reflect change from prior month. EMPLOYMENT GROWTH BY SELECTED INDUSTRIES* BREAKDOWN OF KEY INDUSTRIES* Restaurants Auto Parts & Dealers Food Retailers Business Services Accommodations Real Estate 8,700 / 0.2% 6,600 / 0.5% 2,400 / 1.4% 2,700 / 0.6% 1,200 / 0.2% -100 / -0.1% Industry Current Month Employment Change 6 Month Avg. Difference - / + Accommodations Auto Parts and Dealers Building Material and Garden Equipment Business Services Education Food Retailers Gasoline Stations and Auto Repair Leisure Manufacturing Personal Care Retailers Personal Services Professional Services Real Estate Rental Restaurants Other TOTAL 0 3050 220 740 -120 2060 2160 280 100 290 240 870 -10 140 - 6840 -80 3120 1,160 3,570 110 1,960 0 380 (40) 430 50 460 (160) 390 (50) 10 15,560 2,060 25,890 1,160 6,620 330 2,700 (120) 2,440 2,120 710 150 750 80 1,260 (60) 150 8,720 1,980 29,010 Sum of components may not equal total due to rounding 29,000