

Empfohlen
Empfohlen
Weitere ähnliche Inhalte
Was ist angesagt?
Was ist angesagt? (10)
Ähnlich wie External Trade Bulletin - February 2014
Ähnlich wie External Trade Bulletin - February 2014 (20)
Mehr von Adele Ramos
Mehr von Adele Ramos (20)
External Trade Bulletin - February 2014
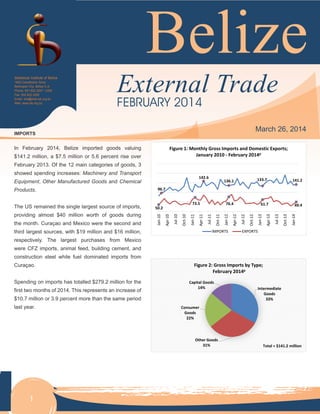
- 1. Statistical Institute of Belize .............................................................................. Belize External Trade Bulletin February 2014 1 Belize External TradeStatistical Institute of Belize 1902 Constitution Drive Belmopan City, Belize C.A. Phone: 501.822.2207 / 2352 Fax: 502.822.3206 Email: info@mail.sib.org.bz Web: www.sib.org.bz 1 IMPORTS In February 2014, Belize imported goods valuing $141.2 million, a $7.5 million or 5.6 percent rise over February 2013. Of the 12 main categories of goods, 3 showed spending increases: Machinery and Transport Equipment, Other Manufactured Goods and Chemical Products. The US remained the single largest source of imports, providing almost $40 million worth of goods during the month. Curaçao and Mexico were the second and third largest sources, with $19 million and $16 million, respectively. The largest purchases from Mexico were CFZ imports, animal feed, building cement, and construction steel while fuel dominated imports from Curaçao. Spending on imports has totalled $279.2 million for the first two months of 2014. This represents an increase of $10.7 million or 3.9 percent more than the same period last year. FEBRUARY 2014 March 26, 2014 96.7 142.6 136.1 133.7 141.2 50.2 73.5 76.4 61.7 49.4 Jan-10 Apr-10 Jul-10 Oct-10 Jan-11 Apr-11 Jul-11 Oct-11 Jan-12 Apr-12 Jul-12 Oct-12 Jan-13 Apr-13 Jul-13 Oct-13 Jan-14 Figure 1: Monthly Gross Imports and Domestic Exports; January 2010 - February 2014p IMPORTS EXPORTS Intermediate Goods 33% Other Goods 31% Consumer Goods 22% Capital Goods 14% Figure 2: Gross Imports by Type; February 2014p Total = $141.2 million
- 2. Statistical Institute of Belize .............................................................................. Belize External Trade Bulletin February 2014 2 DOMESTIC EXPORTS Belize export receipts for February 2014 stood at $49.5 million. This represents a decrease of approximately $12 million or 20 percent over the same month last year. There were decreased earnings from all major exports except marine products. The largest fall in earnings occurred in the export of sugar, which fell by roughly one-half to $7.7 million. This was due to poor weather conditions and the delayed opening of the sugar factory. Even with these setbacks, the Belize Sugar Industries Limited is still optimistic for a very good production year. Despite an increase in world prices, Belize exported slightly less crude oil in the month, resulting in a $2 million reduction in revenues. Similarly, grapefruit concentrate sales were down mainly because of the product being stored to be blended later in the year. Farm shrimp continues to perform well, generating an additional $3.9 million in receipts and increasing the share of exports to Mexico. For more information contact Data Dissemination Department at telephone number 822-2207/2352 or e-mail at info@mail.sib.org.bz. An Excel version of the tables contained in this release can be downloaded from our website at www.sib.org.bz 39.1 7.4 5.7 16.6 14.0 21.2 19.5 2.8 4.3 0.1 United States European Union Caricom Mexico China Gross Imports Domestic Exports Figure 3: Merchandise Trade with Selected Countries/Regions; February 2014p Crude Oil 27% Citrus 20% Sugar 15% Marine Products 13% Bananas 13% Other Goods 12% Figure 4: Domestic Exports by Type; February 2014p Total = $49.4 million
- 3. ..............................................................................Statistical Institute of Belize 3 Belize External Trade Bulletin February 2014 Table 1: Value of Belize’s Imports and Exports by Section of the S.I.T.C for February of 2013 and 2014p (BZ $’000) S.I.T.C Section Imports (C.I.F) Exports (F.O.B) Balance of Trade Domestic Re-Exports Total Feb-14 Feb-13 Feb-14 Feb-13 Feb-14 Feb-13 Feb-14 Feb-13 Feb-14 Feb-13 Food and Live Animals 13,912.8 16,289.7 34,958.7 44,947.1 141.4 131.6 35,100.1 45,078.7 21,187.2 28,789.0 Beverages and Tobacco 3,096.7 3,571.2 14.9 27.1 226.0 151.1 240.8 178.2 -2,855.8 -3,392.9 Crude Materials 2,043.0 1,073.5 340.4 138.1 0.1 125.6 340.4 263.7 -1,702.5 -809.8 Mineral Fuels & Lub. 23,530.1 25,257.6 13,337.6 15,345.2 1,705.9 1,796.4 15,043.5 17,141.5 -8,486.6 -8,116.1 Oils and Fats 1,202.7 1,226.2 - - 0.1 - 0.1 - -1,202.6 -1,226.2 Chemical Products 11,229.9 9,982.9 696.7 1,160.8 21.6 308.2 718.3 1,469.0 -10,511.5 -8,513.9 Manufactured Goods 14,295.1 15,967.9 93.8 97.9 260.3 1,378.1 354.1 1,476.1 -13,941.0 -14,491.9 Mach. & Transp. Eqt 31,602.1 20,549.1 - - 968.0 1,490.0 968.0 1,490.0 -30,634.1 -19,059.1 Other Manufactures 10,729.3 8,385.7 7.3 3.5 315.8 758.1 323.0 761.6 -10,406.2 -7,624.1 Commodities n.e.s - - - - - - - - - - Commercial Free Zone 23,912.4 25,318.9 - - 1,303.1 6,912.6 1,303.1 6,912.6 N.A N.A. Export Processing Zones 5,187.3 5,791.5 - - - - - - -5,187.3 -5,791.5 Personal Goods 505.6 258.2 - - 238.2 77.4 238.2 77.4 -267.5 -180.8 Total 141,247.0 133,672.3 49,449.3 61,719.7 5,180.3 13,129.1 54,629.6 74,848.8 -64,008.0* -40,417.2* Source: Statistical Institute of Belize Figures may not add up to total due to rounding *Excluding CFZ figures. Table 2: Value of Belize’s Imports and Exports by Major Trading Partners for February of 2013 and 2014p (BZ $ ‘000) Country Imports (C.I.F) Exports (F.O.B) Domestic Re-Exports Total Feb-14 Feb-13 Feb-14 Feb-13 Feb-14 Feb-13 Feb-14 Feb-13 United States of America 39,050.4 40,418.8 21,225.7 25,650.7 2,879.9 5,035.5 24,105.7 30,686.1 Mexico 16,646.1 13,073.3 4,316.1 1,144.7 262.9 346.9 4,579.0 1,491.7 United Kingdom 2,736.0 1,445.4 12,201.4 20,902.6 138.0 288.7 12,339.4 21,191.4 Other European Union 4,705.7 4,847.5 7,324.5 7,110.2 83.7 10.3 7,408.3 7,120.6 Panama 3,025.8 3,603.1 - - 5.5 554.0 5.5 554.0 Costa Rica 1,523.2 2,123.1 - - - - - - Other Central America 13,174.4 13,749.5 659.0 742.3 289.8 686.2 948.7 1,428.4 Caricom 5,698.5 4,884.3 2,762.1 4,979.7 233.4 899.9 2,995.5 5,879.6 Canada 751.2 552.9 38.0 33.8 11.8 20.2 49.9 53.9 Curacao 19,825.7 21,904.6 - - - - - - China 13,959.3 14,424.3 62.3 35.4 776.4 2,952.3 838.7 2,987.8 Other 20,150.7 12,645.6 860.1 1,120.3 498.8 2,335.1 1,358.9 3,455.4 Total 141,247.0 133,672.3 49,449.3 61,719.7 5,180.3 13,129.1 54,629.6 74,848.8 Source: Statistical Institute of Belize Figures may not add up to total due to rounding
- 4. Statistical Institute of Belize .............................................................................. Belize External Trade Bulletin February 2014 4 Table 3: Value of Belize’s Caricom Imports and Exports by Section of The S.I.T.C for February of 2013 and 2014p (BZ $ ‘000) S.I.T.C Section Imports (C.I.F) Exports (F.O.B) Balance of Trade Domestic Re-Exports Total Feb-14 Feb-13 Feb-14 Feb-13 Feb-14 Feb-13 Feb-14 Feb-13 Feb-14 Feb-13 Food and Live Animals 440.1 202.1 2,664.9 4,891.9 30.8 - 2,695.7 4,891.9 2,255.6 4,689.8 Beverages and Tobacco 1,536.6 2,048.7 0.0 - 3.6 - 3.7 - -1,533.0 -2,048.7 Crude Materials 0.1 - 59.9 - - - 59.9 - 59.8 0.0 Chemical Products 415.3 464.1 - - - - - - -415.3 -464.1 Manufactured goods 2,387.4 1,572.6 37.3 87.8 192.9 878.9 230.2 966.8 -2,157.3 -605.8 Mach. & Transp. Eqt 705.0 298.2 - - - - - - -705.0 -298.2 Oth. Manufactures 213.5 189.8 - - - - - - -213.5 -189.8 Commercial Free Zone - 106.7 - - - 21.0 - 21.0 N.A N.A Export Processing Zones 0.3 - - - - - - - -0.3 0.0 Personal Goods - 2.1 - - 6.1 - 6.1 - 6.1 -2.1 Total 5,698.5 4,884.3 2,762.1 4,979.7 233.4 899.9 2,995.5 5,879.6 -2,703.0* 1,081.1* Source: Statistical Institute of Belize Figures may not add up to total due to rounding *Excluding CFZ figures. Table 4: Value of Belize’s Imports and Exports to Caricom Countries for February of 2013 and 2014p (BZ $ ‘000) S.I.T.C Section Imports (C.I.F) Exports (F.O.B) Domestic Re-Exports Total Feb-14 Feb-13 Feb-14 Feb-13 Feb-14 Feb-13 Feb-14 Feb-13 Antigua & Barbuda 4.0 - 34.6 - - - 34.6 - Barbados 661.3 158.5 138.7 418.8 0.7 - 139.5 418.8 Dominica 1.3 - - - - - - - Grenada 132.3 - - - 6.1 - 6.1 - Guyana 358.1 100.8 463.4 1,073.1 - - 463.4 1,073.1 Jamaica 2,207.1 2,127.6 1,431.8 2,245.3 226.6 878.9 1,658.4 3,124.3 St-Kitts & Nevis 67.8 - - - - - - - St-Lucia 265.3 385.7 2.7 - - - 2.7 - Surinam 0.4 - - - - - - - Trinidad & Tobago 2,000.9 2,111.7 690.9 1,242.5 - 21.0 690.9 1,263.5 TOTAL 5,698.5 4,884.3 2,762.1 4,979.7 233.4 899.9 2,995.5 5,879.6 Source: Statistical Institute of Belize Figures may not add up to total due to rounding
- 5. ..............................................................................Statistical Institute of Belize 5 Belize External Trade Bulletin February 2014 Table 5: Belize’s Major Domestic Exports by Value of the Total Gross Domestic Exports for February of 2013 and 2014 and January to February of 2013 and 2014p (BZ $ ‘000) Commodity February January - February 2014 2013 2014 2013 Marine Products Lbs '000 1,374.2 948.5 2,366.5 1,787.7 Value 6,537.0 3,367.7 13,435.2 7,296.6 Sugar L/Ton 8,365.7 15,921.8 8,365.7 16,819.2 Value 7,763.1 16,001.6 7,763.1 17,337.1 Molasses Gals '000 20.9 42.1 36.5 90.6 Value 15.6 32.7 27.3 67.8 Orange Concentrate Gals '000 431.1 455.4 743.7 825.2 Value 8,894.8 9,628.2 15,448.5 16,922.0 Grapefruit Concentrate Gals '000 15.5 82.3 31.6 178.9 Value 370.7 1,894.1 768.0 4,274.9 Bananas M/Ton 7,069.2 7,425.6 13,391.9 15,275.4 Value 6,311.9 6,630.1 11,957.3 13,639.0 Sawn Wood Bd Ft '000 27.6 14.3 46.2 41.9 Value 171.2 41.9 400.0 276.7 Papayas Lbs '000 2,322.8 4,108.3 4,607.8 8,439.4 Value 894.7 1,494.7 1,755.4 3,047.2 Crude Oil Gallons '000 2,876.1 2,837.4 5,724.6 5,649.2 Value 13,258.7 15,345.2 26,406.3 30,014.4 Other Export Value 5,231.5 7,283.4 9,923.8 11,987.9 Total Value 49,449.3 61,719.7 87,884.8 104,863.4 Source: Statistical Institute of Belize
- 6. Statistical Institute of Belize .............................................................................. Belize External Trade Bulletin February 2014 6 Table 6: Value of Belize’s Other Exports for February 2013 and 2014 and January to February 2013 and 2014p (BZ $ ‘000) Commodity February January - February 2014 2013 2014 2013 Pepper Sauce Lbs 62.1 114.8 145.8 146.7 Value 144.9 283.1 351.4 369.3 Orange Oil Lbs 219.4 580.2 378.9 808.0 Value 509.0 704.4 583.8 986.2 Grapefruit Oil Lbs - 71.7 0.6 808.0 Value - 320.3 5.9 601.4 R.K. Beans Lbs 157.5 593.6 282.5 593.6 Value 311.4 651.6 513.2 651.6 Black Eye Peas Lbs 353.3 337.4 826.2 576.3 Value 287.0 308.2 714.9 517.5 Pulp Cells Lbs 95.4 1,561.1 211.2 1,719.2 Value 85.8 924.4 714.9 1,042.3 Animal Feed Lbs 8,105.5 12,963.2 16,487.5 23,960.7 Value 1,445.5 2,879.7 3,676.8 5,475.9 Corn Meal Lbs 425.0 629.8 1,336.0 1,306.3 Value 207.6 340.4 648.6 690.3 Other Value Value 2,240.4 871.3 2,714.4 1,653.5 Total Value 5,231.5 7,283.4 9,923.8 11,987.9 Source: Statistical Institute of Belize
- 7. ..............................................................................Statistical Institute of Belize 7 Belize External Trade Bulletin February 2014 Table 7: Direction of Trade for Selected Countries for February of 2013 and 2014p (BZ $ ‘000) Country Imports (C.I.F) Exports (F.O.B) Domestic Re-Exports Total Feb-14 Feb-13 Feb-14 Feb-13 Feb-14 Feb-13 Feb-14 Feb-13 United Arab Emirates 385.9 153.9 - - - - - - Republic Of Austria 804.2 262.1 - - - - - - Brazil 905.9 538.5 - - - - - - Chile 105.0 382.0 - - 0.9 5.8 0.9 5.8 Germany,Fedl.Rep.of 348.7 719.4 259.5 396.1 1.1 1.2 260.6 397.3 Denmark 564.6 254.4 - - - - - - Guatemala 8,815.5 9,817.4 603.5 608.1 216.5 686.2 819.9 1,294.3 Honduras 2,434.0 2,347.5 20.6 - 11.1 - 31.7 - India 3,724.2 4,272.3 - - 123.1 1,163.1 123.1 1,163.1 Japan 4,001.9 1,264.8 85.4 - - 43.7 85.4 43.7 South Korea 1,889.6 657.5 - - - 25.4 - 25.4 Lithuania 38.3 25.6 - - 21.3 8.6 21.3 8.6 Malaysia 172.6 479.5 - - - - - - Netherlands (Holland) 2,144.4 1,411.2 5,052.2 4,882.8 13.6 - 5,065.8 4,882.8 Russian Federation 78.4 0.4 - - - - - - El Salvador 1,920.5 1,559.9 34.9 134.1 - 0.0 34.9 134.1 Thailand 3,411.7 663.0 - - - - - - New Taiwan 488.5 154.5 - 11.3 40.3 67.8 40.3 79.0 Venezuela - 1.6 - - - 19.4 - 19.4 Vietnam 341.2 1,686.6 - - - - - - Source: Statistical Institute of Belize
- 8. Statistical Institute of Belize .............................................................................. Belize External Trade Bulletin February 2014 8 Table 9: Value of Belize’s Imports and Exports by Major Trading Partners for January to February of 2013 and 2014p (BZ $ ‘000) Country Imports (C.I.F) Exports (F.O.B) Domestic Re-Exports Total Jan-Feb Jan-Feb Jan-Feb Jan-Feb Jan-Feb Jan-Feb Jan-Feb Jan-Feb 2014 2013 2014 2013 2014 2013 2014 2013 United States of America 80,703.6 82,559.3 41,674.8 47,907.2 8,919.5 16,576.4 50,594.3 64,483.6 Mexico 29,072.6 29,586.5 6,829.4 1,442.0 408.6 437.8 7,238.0 1,879.8 United Kingdom 5,220.3 3,842.9 16,068.0 27,521.5 191.0 464.6 16,259.0 27,986.0 Other European Union 8,311.1 9,218.6 12,610.9 12,486.4 195.3 23.6 12,806.2 12,510.0 Panama 5,212.1 5,891.4 - 5.6 5.5 554.4 5.5 560.0 Costa Rica 2,779.1 5,004.0 - 2.9 - 2.0 - 4.9 Other Central America 24,632.2 25,741.1 892.8 1,282.9 499.1 2,042.8 1,391.9 3,325.7 Caricom 10,231.5 7,759.5 7,796.2 10,584.0 669.7 905.6 8,465.9 11,489.7 Canada 2,477.7 1,952.7 38.6 90.6 253.5 118.2 292.2 208.9 Curacao 42,465.8 34,688.3 - - - - - - China 30,285.3 32,229.0 62.3 35.4 1,781.6 6,229.5 1,843.9 6,264.9 Other 37,873.0 30,063.1 1,911.8 3,504.9 1,829.3 7,000.0 3,741.1 10,504.9 TOTAL 279,264.3 268,536.4 87,884.8 104,863.4 14,753.2 34,354.9 102,638.0 139,218.4 Source: Statistical Institute of Belize Figures may not add up to total due to rounding Table 8: Value of Belize’s Imports and Exports by Section of the S.I.T.C for January to February of 2013 and 2014p (BZ $ ‘000) S.I.T.C Section Imports (C.I.F) Exports (F.O.B) Balance of Trade Domestic Re-Exports Total Jan-Feb Jan-Feb Jan-Feb Jan-Feb Jan-Feb Jan-Feb Jan-Feb Jan-Feb Jan-Feb Jan-Feb 2014 2013 2014 2013 2014 2013 2014 2013 2014 2013 Food and Live Animals 29,654.0 31,359.5 59,182.7 72,186.9 239.5 131.6 59,422.3 72,318.6 29,768.2 40,959.1 Beverages and Tobacco 9,931.3 7,227.8 17.0 75.6 1,168.1 952.3 1,185.0 1,028.0 -8,746.2 -6,199.9 Crude Materials 3,303.5 2,331.3 809.4 475.5 0.1 309.9 809.5 785.4 -2,494.1 -1,545.9 Mineral Fuels & Lub. 49,757.5 41,950.1 26,485.1 30,014.4 3,918.7 3,967.3 30,403.8 33,981.7 -19,353.7 -7,968.4 Oils and Fats 2,425.9 2,151.2 2.4 - 0.1 - 2.4 - -2,423.5 -2,151.2 Chemical Products 20,450.5 21,726.4 1,242.3 1,910.6 164.3 386.7 1,406.7 2,297.3 -19,043.8 -19,429.1 Manufactured Goods 30,137.7 32,325.7 134.7 188.1 973.7 1,605.1 1,108.4 1,793.2 -29,029.2 -30,532.4 Mach. & Transp. Eqt 59,028.8 43,666.1 - - 2,660.0 9,299.1 2,660.0 9,299.1 -56,368.8 -34,367.0 Other Manufactures 20,538.3 16,937.7 11.1 12.2 1,030.9 938.1 1,042.0 950.3 -19,496.3 -15,987.4 Commercial Free Zone 42,000.9 54,749.5 - - 4,348.7 16,629.0 4,348.7 16,629.0 N.A. N.A. Export Processing Zones 10,779.5 12,626.6 - - - - - - -10,779.5 -12,626.6 Personal Goods 1,256.4 1,484.5 - - 249.1 135.8 249.1 135.8 -1,007.3 -1,348.7 Total 279,264.3 268,536.4 87,884.8 104,863.4 14,753.2 34,354.9 102,638.0 139,218.4 -138,974.2* -91,197.5* Source: Statistical Institute of Belize Figures may not add up to total due to rounding *Excluding CFZ figures.
- 9. ..............................................................................Statistical Institute of Belize 9 Belize External Trade Bulletin February 2014 Table 11: Value of Belize’s Imports and Exports to Caricom Countries for January to February of 2013 and 2014p (BZ $ ‘000) S.I.T.C Section Imports (C.I.F) Exports (F.O.B) Domestic Re-Exports Total Jan-Feb Jan-Feb Jan-Feb Jan-Feb Jan-Feb Jan-Feb Jan-Feb Jan-Feb 2014 2013 2014 2013 2014 2013 2014 2013 Antigua & Barbuda 4.0 - 34.6 - - - 34.6 - Barbados 1,107.7 309.6 235.9 513.9 0.7 - 236.6 513.9 Dominica 251.1 169.7 - - 15.8 - 15.8 - Grenada 132.7 0.2 - - 6.1 - 6.1 - Guyana 502.5 153.1 1,649.3 2,129.2 - - 1,649.3 2,129.2 Jamaica 3,208.6 2,681.0 3,730.1 3,225.6 645.8 878.9 4,375.8 4,104.5 St. Kitts & Nevis 194.9 - - - 0.2 - 0.2 - St. Lucia 488.6 653.4 2.7 - - 5.7 2.7 5.7 Suriname 14.7 - 427.1 180.8 - - 427.1 180.8 Trinidad & Tobago 4,326.8 3,792.5 1,716.5 4,534.6 1.1 21.0 1,717.5 4,555.6 TOTAL 10,231.5 7,759.5 7,796.2 10,584.0 669.7 905.6 8,465.9 11,489.7 Source: Statistical Institute of Belize Figures may not add up to total due to rounding Table 10: Value of Belize’s Caricom Imports and Exports by Section of the S.I.T.C for January to February of 2013 and 2014p (BZ $ ‘000) S.I.T.C Section Imports (C.I.F) Exports (F.O.B) Balance of Trade Domestic Re-Exports Total Jan-Feb Jan-Feb Jan-Feb Jan-Feb Jan-Feb Jan-Feb Jan-Feb Jan-Feb Jan-Feb Jan-Feb 2014 2013 2014 2013 2014 2013 2014 2013 2014 2013 Food and Live Animals 615.9 309.8 7,677.0 10,476.4 30.8 - 7,707.8 10,476.4 7,091.9 10,166.6 Beverages and Tobacco 4,069.8 3,757.8 0.0 - 3.6 - 3.7 - -4,066.1 -3,757.8 Crude Materials 0.1 - 59.9 - - - 59.9 - 59.8 0.0 Mineral Fuels & Lub. - - - - 47.9 - 47.9 - 47.9 0.0 Oils and Fats - 1.0 - - - - - - 0.0 -1.0 Chemical Products 1,037.3 848.5 22.0 19.8 - - 22.0 19.8 -1,015.4 -828.7 Manufactured goods 3,204.8 1,880.2 37.3 87.8 580.0 884.6 617.3 972.5 -2,587.5 -907.7 Mach. & Transp. Eqt 765.6 524.3 - - - - - - -765.6 -524.3 Oth. Manufactures 439.5 278.2 - - 1.1 - 1.1 - -438.4 -278.2 Commodities n.e.s - - - - - - - - 0.0 0.0 Commercial Free Zone 97.9 106.7 - - - 21.0 - 21.0 N.A. N.A. Export Processing Zones 0.5 50.8 - - - - - - -0.5 -50.8 Personal Goods - 2.1 - - 6.3 - 6.3 - 6.3 -2.1 TOTAL 10,231.5 7,759.5 7,796.2 10,584.0 669.7 905.6 8,465.9 11,489.7 -1,667.7* 3,815.9* Source: Statistical Institute of Belize Figures may not add up to total due to rounding *Excluding CFZ figures.
- 10. Statistical Institute of Belize .............................................................................. Belize External Trade Bulletin February 2014 10 Table 12: Value of Belize’s Imports by Economic End-Usep (BZ $ ‘000) Imports Annual February January - February 2012 2013 2014 2013 2014 2013 Consumer Goods 11: Food and beverages 154,315.3 165,835.4 12,556.6 12,218.8 29,142.4 26,065.3 12: Transport equipment 14,258.0 14,521.1 2,439.7 521.4 3,500.1 2,098.9 13: Durable goods 41,841.3 59,262.7 2,289.3 2,055.2 5,239.2 5,970.1 14: Semi-durable goods 39,624.3 44,634.8 4,680.3 2,573.1 7,814.0 4,698.3 15: Non-durable goods 107,261.7 124,065.4 8,624.2 8,169.7 16,492.6 14,795.7 Intermediate Goods 21: Food and beverages 39,690.1 34,995.3 1,751.0 3,807.0 4,464.9 5,468.7 22: Fuels and lubricants 169,681.9 169,906.0 13,621.3 13,859.7 31,555.7 22,329.8 23: Parts and accessories 90,615.8 86,241.6 6,078.7 5,370.8 13,034.1 11,686.8 24: Industrial supplies nes 345,157.3 379,929.3 25,101.0 26,049.3 49,027.4 54,578.9 Capital Goods 31: Transport equipment 37,309.5 56,417.3 6,866.7 2,900.9 13,132.8 5,979.0 32: Other capital goods 123,540.0 156,638.7 12,753.8 10,985.0 24,215.9 21,498.1 Other Goods 41: Passenger motor cars 30,258.7 33,520.1 4,854.1 2,255.9 8,758.6 4,669.7 42: Motor spirit 104,036.3 106,805.2 9,647.8 11,463.0 17,876.5 19,710.0 43: Goods to EPZ 64,891.7 80,633.4 5,187.3 5,791.5 10,779.5 12,626.6 44: Goods to CFZ 351,329.6 332,776.3 23,912.4 25,318.9 42,000.9 54,749.5 45: Household goods 5,366.7 6,947.2 505.6 258.2 1,256.4 1,484.5 46: Goods nes 3,070.6 2,517.8 377.0 74.1 973.2 126.5 Total Imports 1,722,248.9 1,855,647.6 141,247.0 133,672.3 279,264.3 268,536.4 Total Exports 805,068.9 790,382.4 54,629.6 74,848.8 102,638.0 139,218.4 Visible Trade Gap -629,561.4* -824,787.3* -64,008.0* -40,417.2* -138,974.2* -91,197.5* Source: Statistical Institute of Belize Figures may not add up to total due to rounding *Excluding CFZ figures.
- 11. ..............................................................................Statistical Institute of Belize 11 Belize External Trade Bulletin February 2014 Table 13: Value of Belize’s Imports by Economic End Use for the Previous Five Quartersp (BZ $ ‘000) Imports Quarter 4 Quarter 1 Quarter 2 Quarter 3 Quarter 4 2012 2013 2013 2013 2013 Consumer Goods 11. Food and beverages 43,554.0 37,427.4 41,383.6 40,333.1 46,691.3 12. Transport equipment 4,032.2 3,009.5 3,895.3 3,622.4 3,993.9 13. Durable goods 14,243.2 9,219.9 11,757.4 9,731.8 28,553.5 14. Semi-durable goods 11,635.6 7,357.0 11,356.6 11,207.6 14,713.5 15. Non-durable goods 26,306.4 23,705.9 33,343.1 35,802.3 31,214.1 Intermediate Goods 21. Food and beverages 9,095.0 10,733.1 9,347.5 4,314.4 10,600.4 22. Fuels and lubricants 38,788.2 37,651.3 46,699.3 40,607.5 44,947.8 23. Parts and accessories 17,339.9 19,785.1 23,267.2 23,046.7 20,142.7 24. Industrial supplies nes 96,732.7 81,806.9 104,048.3 96,110.1 97,964.0 Capital Goods 31. Transport equipment 9,670.4 12,514.7 14,203.8 14,928.8 14,770.0 32. Other capital goods 34,647.3 37,012.4 43,427.8 37,225.3 38,973.2 Other Goods 41. Passenger motor cars 8,408.7 7,445.3 8,534.9 7,828.7 9,711.3 42. Motor spirit 20,916.8 32,498.5 17,711.2 29,251.1 27,344.5 43. Goods to EPZ 14,878.4 17,969.8 18,692.0 24,715.0 19,256.6 44. Goods to CFZ 99,789.5 77,811.2 84,811.0 87,084.8 83,069.3 45. Household goods 1,399.1 1,810.8 1,370.9 2,265.3 1,500.2 46. Goods nes 181.6 245.2 1,450.4 565.2 257.0 Total Imports 451,618.9 418,003.9 475,300.2 468,640.2 493,703.3 Total Exports 158,930.6 221,849.9 244,823.7 175,374.8 148,334.0 Visible Trade Gap -212,354.7* -146,197.1* -171,805.9* -222,942.9* -283,841.4* Source: Statistical Institute of Belize Figures may not add up to total due to rounding *Excluding CFZ figures.