Apidays New York 2024 - The value of a flexible API Management solution for O...
Spss13 regression
1. Office of Information Technology 1
ANALYZING DATA IN SPSS 13.0 USING REGRESSION ANALYSIS
Tips before you begin:
• Make sure your data set is open before attempting to run any analyses.
• During analyses, right click on terms or buttons in the dialog boxes to learn about their functions.
• The Help button in the dialog boxes maybe clicked at any time during analyses for more
information on that particular procedure.
• Click the Reset button to clear the dialog box and begin a fresh analysis.
• Click the Cancel button to exit that dialog box without saving changes.
Choose a Procedure:
• Linear Regression
• Curve Estimation
• Binary Logistic Regression
• Multinomial Logistic Regression
• Ordinal Regression
• Probit Analysis
LINEAR REGRESSION
Linear Regression estimates the coefficients of the linear equation, involving one or more independent
variables that best predict the value of the dependent variable.
Examples. A cost modeler wants to find the prospective cost for a new contract based on the data
collected from previous contracts. Or, if the university authorities want to predict a student's grade on
a freshman college calculus midterm based on his/her SAT score, then they may use linear
regression.
Procedure
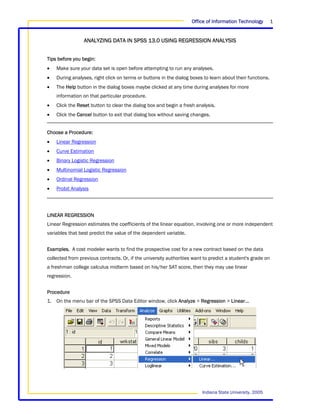
1. On the menu bar of the SPSS Data Editor window, click Analyze > Regression > Linear…
Indiana State University, 2005
2. Office of Information Technology 2
2. Select one or more variables that you want to test by clicking on the variable labels in the Linear
Regression dialog box. To select multiple variables, hold down the Ctrl key and choose the
variables you want. Click on the respective arrow buttons to add selected variables to the
Dependent and Independent(s) windows. You may also specify the selection variable, case labels
and WLS weight in this dialog box.
Empty
Dependent
Window
List of Empty
Variables Independent(s)
Window
Empty
Selection
Variable
Window
Right arrow
buttons to Empty Case
add selected Labels
variable(s) Window
Empty WLS
Weight
Window
3. The Method drop-down box allows you to select the method of regression you want to run. The
methods listed are Enter, Stepwise, Forward and Backward. By default, Enter method is selected.
4. Click on the Statistics…
button to select the
regression coefficients,
residuals and other options
listed. Click on the Continue
button.
Indiana State University, 2005
3. Office of Information Technology 3
5. Click on the Plots…. button
to select the plots
variables. Click on the
Continue button.
6. Click on the Save…..button
to select Predicted Values,
Residuals, Distances,
Prediction Intervals and
Influence Statistics. Select
Save to New file if required.
Click on the Continue
button.
Indiana State University, 2005
4. Office of Information Technology 4
7. Click on the Options…. button to select the
stepping method criteria and to control the
treatment of missing values. Click on the
Continue button.
8. Click the OK button in the Linear Regression dialog box to run the analysis. The output will be
displayed in a separate SPSS Viewer window.
Back to Top
CURVE ESTIMATION
The Curve Estimation procedure produces curve estimation regression statistics and related plots for
11 different curve estimation regression models. A separate model is produced for each dependent
variable. You can also save predicted values, residuals, and prediction intervals as new variables.
Example. A fire insurance company conducts a study to relate the amount of damage in serious
residential fires to the distance between the closest fire station and the residence. A scatterplot
reveals that the relationship between fire damage and distance to the fire station is linear.
Procedure
1. On the menu bar of the SPSS Data Editor window, click Analyze > Regression > Curve Estimation…
Indiana State University, 2005
5. Office of Information Technology 5
2. Select one or more variables that you want to test by clicking on the variable labels in the Curve
Estimation dialog box. To select multiple variables, hold down the Ctrl key and choose the
variables you want. Click on the respective arrow buttons to add selected variables to the
Dependent(s) and Independent Variable windows. You may also specify the case labels in this
dialog box and select the model type.
Empty
Dependent(s)
List of Window
Variables
Empty
Independent
Variable
Window
Empty
Case
Labels
Right arrow
Window
buttons to
add
selected
variable(s)
3. Click on the Save…. button, to
save the predicted values,
residuals and prediction
intervals. Click on the
Continue button.
4. Click the OK button in the Curve Estimation dialog box to run the analysis. The output will be
displayed in a separate SPSS Viewer window.
Back to Top
Indiana State University, 2005
6. Office of Information Technology 6
BINARY LOGISTIC REGRESSION
Logistic regression is useful for situations in which you want to be able to predict the presence or
absence of a characteristic or outcome based on values of a set of predictor variables. It is similar to a
linear regression model but is suited to models where the dependent variable is dichotomous. Logistic
regression coefficients can be used to estimate odds ratios for each of the independent variables in
the model. Logistic regression is applicable to a broader range of research situations than
discriminant analysis.
Example. What characteristics or lifestyles lead to overweight in women? For this purpose, the body
perceptions and weigh management practices could be compared. The data could also compare the
respondents’ race and age to establish a relationship.
Procedure
1. On the menu bar of the SPSS Data Editor window, click Analyze > Regression > Binary Logistic…
2. Select one or more variables that you want to test by clicking on the variable labels in the Logistic
Regression dialog box. To select multiple variables, hold down the Ctrl key and choose the
variables you want. Click on the respective arrow buttons to add selected variables to the
Dependent and Covariates windows. You may also specify the selection variable in this dialog box.
Indiana State University, 2005
7. Office of Information Technology 7
Empty
Dependent
Window
List of
Variables
Empty
Covariates
Window
Right arrow
buttons to
add selected
variable(s)
Empty
Selection
Variable
Window
3. Click on the
Categorical … button
to select covariate as
categorical
covariates. Click on
the Continue button.
4. Click on the Save… button to select and
save the appropriate predicted values,
residuals and Influence as new
variables. Click on the Continue button.
Indiana State University, 2005
8. Office of Information Technology 8
5. Click on the
Options….button to
select the
statistics and
plots, display type
and probability for
stepwise. Click on
the Continue
button.
6. Click the OK button in the main Logistic Regression window. The output will be displayed in a new
SPSS viewer window.
Back to Top
MULTINOMIAL LOGISTIC REGRESSION
Multinomial Logistic Regression is useful for situations in which you want to be able to classify
subjects based on values of a set of predictor variables. This type of regression is similar to logistic
regression, but it is more general because the dependent variable is not restricted to two categories.
Example. In order to market films more effectively, movie studios want to predict what type of film a
moviegoer is likely to see. Using a Multinomial Logistic Regression, the studio can determine the
strength of influence a person's age, gender, and dating status has upon the type of film they prefer.
Procedure
1. On the menu bar of the SPSS Data Editor window, click Analyze > Regression > Multinomial
Logistic…
Indiana State University, 2005
9. Office of Information Technology 9
2. Select one or more variables that you want to test by clicking on the variable labels in the
Multinomial Logistic Regression dialog box. To select multiple variables, hold down the Ctrl key
and choose the variables you want. Click on the respective arrow buttons to add selected
variables to the Dependent, Factor(s) and Covariate(s) windows.
Empty
Dependent
List of
Window
Variables
Empty
Factor(s)
Window
Right arrow Empty
buttons to Covariate(s)
add selected Window
variable(s)
3. Click on the
Model….button to
specify model type
and select
appropriate factors
and covariates as
forced entry terms
and stepwise
terms. Click on the
Continue button.
Indiana State University, 2005
10. Office of Information Technology 10
4. Click on the
Statistics button to
select the
appropriate options
given under Model,
Parameters and
Define
Subpopulations. The
Case Processing
Summary is checked
by default. Click on
the Continue button.
5. Click on the
Criteria button
to select the
iterations. Click
on the Continue
button.
Indiana State University, 2005
11. Office of Information Technology 11
6. Click on the
Options
button to
select the
Dispersion
Scale and
Stepwise
Options.
Click on the
Continue
button.
7. Click on the
Save button to
save variables to
the working file
and export
model
information to
an external file.
Click on the
Continue button.
8. Click the OK button in the Multinomial Logistic Regression dialog box to run the analysis. The
output will be displayed in a separate SPSS Viewer window.
Back to Top
ORDINAL REGRESSION
Ordinal Regression allows you to model the dependence of a polytomous ordinal response on a set of
predictors, which can be factors or covariates.
Indiana State University, 2005
12. Office of Information Technology 12
Example. Ordinal Regression could be used to study the effects on taste of various cheese additives.
The possible effects on taste could be classified from strong dislike to an excellent taste.
Procedure
1. On the menu bar of the SPSS Data Editor window, click Analyze > Regression > Ordinal…
2. Select one or more variables that you want to analyze by clicking on the variable labels in the
Ordinal Regression dialog box. Optionally, select one or more variables for the Factor(s) window
and the Covariates window. To select multiple variables, hold down the Ctrl key and choose the
variables you want. Click on the respective arrow buttons to add selected variables to the
Dependent, Factor(s), and Covariate(s) windows.
Empty
List of Dependent
Variables Window
Empty
Factor(s)
Window
Empty
Right arrow Covariate(s)
buttons to Window
add selected
variable(s)
Indiana State University, 2005
13. Office of Information Technology 13
3. Click on the
Options…button to select
the appropriate iterations.
Click on the Continue
button.
4. Click on the
Output… button
to select the
appropriate
options under
Display, Saved
Variables and
Print log-
likelihood. Click
on the Continue
button.
Indiana State University, 2005
14. Office of Information Technology 14
5. Click on the Location … button. Specify the model and select the factors/covariates onto a new
Location model. Click on the Continue button.
6. Click on the Scale … button to select the factors/covariates on a Scale model. Click on the
Continue button.
7. Click on the OK button in the Ordinal Regression dialog box to run the analysis. The output will be
displayed in a new SPSS Viewer window.
Back to Top
Indiana State University, 2005
15. Office of Information Technology 15
PROBIT ANALYSIS
This procedure measures the relationship between the strength of a stimulus and the proportion of
cases exhibiting a certain response to the stimulus. It is useful for situations where you have a
dichotomous output that is thought to be influenced or caused by levels of some independent
variable(s) and is particularly well suited to experimental data. This procedure will allow you to
estimate the strength of a stimulus required to induce a certain proportion of responses, such as the
median effective dose.
Example. How effective is a new pesticide at killing ants, and what is an appropriate concentration to
use? You might perform an experiment in which you expose samples of ants to different
concentrations of the pesticide and then record the number of ants killed and the number of ants
exposed. Applying probit analysis to these data, you can determine the strength of the relationship
between concentration and killing, and you can determine what the appropriate concentration of
pesticide would be if you wanted to be sure to kill, say, 95% of exposed ants.
Procedure
1. On the menu bar of the SPSS Data Editor window, click Analyze > Regression > Probit…
2. Select one or more variables that you want to analyze by clicking on the variable labels in the
Probit Analysis dialog box. Select a single variable in the Response Frequency, Total Observed and
Factor window. Select one or more variables for the Covariates window. To select multiple
variables, hold down the Ctrl key and choose the variables you want. The model is checked Probit
by default. Click on the respective arrow buttons to add selected variables to the respective
windows.
Indiana State University, 2005
16. Office of Information Technology 16
Empty
Response
List of Frequency
Window
Variables
Empty Total
Observed
Window
Empty Factor
Window
Right arrow
buttons to Empty
add selected Covariate(s)
variable(s) Window
3. Click on the Options…button to select
the Statistics, Natural Response Rate
and the criteria for iterations. Click on
the Continue button.
4. Click the OK button in the Probit Analysis dialog box to run the analysis. The output will be
displayed in a new SPSS Viewer window.
Back to Top
Indiana State University, 2005