Visual Sensemaking e os tipos de visualização
•
0 gefällt mir•299 views

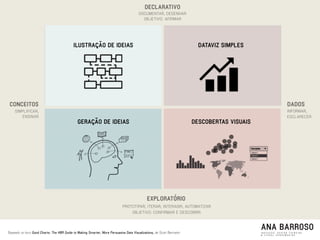
O documento discute diferentes tipos de visualização de dados e seus objetivos, como declarativo, exploratório e ilustração de ideias. Cada tipo é usado em contextos diferentes para propósitos como apresentar resultados, facilitar a compreensão de ideias complexas e apoiar a inovação e descoberta.

Empfohlen
Empfohlen
Weitere ähnliche Inhalte
Andere mochten auch
Andere mochten auch (19)
Ähnlich wie Visual Sensemaking e os tipos de visualização
Ähnlich wie Visual Sensemaking e os tipos de visualização (11)
Mehr von Ana Barroso
Mehr von Ana Barroso (8)
Visual Sensemaking e os tipos de visualização
- 1. ANA BARROSOI N O V A Ç Ã O , D E S I G N T H I N K I N G & V I S U A L S E N S E M A K I N G Baseado no livro Good Charts: The HBR Guide to Making Smarter, More Persuasive Data Visualizations, de Scott Berinatto CONCEITOS DADOS DECLARATIVO EXPLORATÓRIO INFORMAR, ESCLARECER SIMPLIFICAR, ENSINAR DOCUMENTAR, DESENHAR OBJETIVO: AFIRMAR PROTOTIPAR, ITERAR, INTERAGIR, AUTOMATIZAR OBJETIVO: CONFIRMAR E DESCOBRIR ILUSTRAÇÃO DE IDEIAS DATAVIZ SIMPLES GERAÇÃO DE IDEIAS DESCOBERTAS VISUAIS
- 2. ANA BARROSOI N O V A Ç Ã O , D E S I G N T H I N K I N G & V I S U A L S E N S E M A K I N G Baseado no livro Good Charts: The HBR Guide to Making Smarter, More Persuasive Data Visualizations, de Scott Berinatto CONCEITOS DADOS DECLARATIVO EXPLORATÓRIO INFORMAR, ESCLARECER SIMPLIFICAR, ENSINAR DOCUMENTAR, DESENHAR OBJETIVO: AFIRMAR PROTOTIPAR, ITERAR, INTERAGIR, AUTOMATIZAR OBJETIVO: CONFIRMAR E DESCOBRIR ILUSTRAÇÃO DE IDEIAS GERAÇÃO DE IDEIAS DESCOBERTAS VISUAIS Muito usado por gestores para apresentar criar contextos e mostrar resultados com dados mais simples. Contexto: Apresentações, reuniões Objetivo: criar contexto, montar um cenário e mostrar resultados Competências: Storytelling, criação de gráficos simples, habilidades básicas de design.
- 3. ANA BARROSOI N O V A Ç Ã O , D E S I G N T H I N K I N G & V I S U A L S E N S E M A K I N G Baseado no livro Good Charts: The HBR Guide to Making Smarter, More Persuasive Data Visualizations, de Scott Berinatto CONCEITOS DADOS DECLARATIVO EXPLORATÓRIO INFORMAR, ESCLARECER SIMPLIFICAR, ENSINAR DOCUMENTAR, DESENHAR OBJETIVO: AFIRMAR PROTOTIPAR, ITERAR, INTERAGIR, AUTOMATIZAR OBJETIVO: CONFIRMAR E DESCOBRIR ILUSTRAÇÃO DE IDEIAS GERAÇÃO DE IDEIAS DESCOBERTAS VISUAIS
- 4. ANA BARROSOI N O V A Ç Ã O , D E S I G N T H I N K I N G & V I S U A L S E N S E M A K I N G Baseado no livro Good Charts: The HBR Guide to Making Smarter, More Persuasive Data Visualizations, de Scott Berinatto CONCEITOS DADOS DECLARATIVO EXPLORATÓRIO INFORMAR, ESCLARECER SIMPLIFICAR, ENSINAR DOCUMENTAR, DESENHAR OBJETIVO: AFIRMAR PROTOTIPAR, ITERAR, INTERAGIR, AUTOMATIZAR OBJETIVO: CONFIRMAR E DESCOBRIR DATAVIZ SIMPLES GERAÇÃO DE IDEIAS DESCOBERTAS VISUAIS Muito usado por consultorias para explicar de forma didática processos e frameworks. Contexto: Apresentações, aulas (formais) Objetivo: tornar ideias complexas mais simples e claras. Competências: Pensamento lógico, analítico, capacidade de edição/redução até a essência da ideia, habilidades básicas de design.
- 5. ANA BARROSOI N O V A Ç Ã O , D E S I G N T H I N K I N G & V I S U A L S E N S E M A K I N G Baseado no livro Good Charts: The HBR Guide to Making Smarter, More Persuasive Data Visualizations, de Scott Berinatto CONCEITOS DADOS DECLARATIVO EXPLORATÓRIO INFORMAR, ESCLARECER SIMPLIFICAR, ENSINAR DOCUMENTAR, DESENHAR OBJETIVO: AFIRMAR PROTOTIPAR, ITERAR, INTERAGIR, AUTOMATIZAR OBJETIVO: CONFIRMAR E DESCOBRIR DATAVIZ SIMPLES GERAÇÃO DE IDEIAS DESCOBERTAS VISUAIS
- 6. ANA BARROSOI N O V A Ç Ã O , D E S I G N T H I N K I N G & V I S U A L S E N S E M A K I N G Baseado no livro Good Charts: The HBR Guide to Making Smarter, More Persuasive Data Visualizations, de Scott Berinatto CONCEITOS DADOS DECLARATIVO EXPLORATÓRIO INFORMAR, ESCLARECER SIMPLIFICAR, ENSINAR DOCUMENTAR, DESENHAR OBJETIVO: AFIRMAR PROTOTIPAR, ITERAR, INTERAGIR, AUTOMATIZAR OBJETIVO: CONFIRMAR E DESCOBRIR ILUSTRAÇÃO DE IDEIAS DATAVIZ SIMPLES DESCOBERTAS VISUAIS Muito usado por gestores e consultorias para criar novos sistemas, novas formas de conduzir os negócios e responder a desafios complexos. Contexto: Brainstormings, reuniões, sessões de trabalho (informais e colaborativos) Objetivo: Inovação colaborativa e facilitação Competências: liderança, estimulo ao pensamento criativo, problem-solving, articulação de equipes.
- 7. ANA BARROSOI N O V A Ç Ã O , D E S I G N T H I N K I N G & V I S U A L S E N S E M A K I N G Baseado no livro Good Charts: The HBR Guide to Making Smarter, More Persuasive Data Visualizations, de Scott Berinatto CONCEITOS DADOS DECLARATIVO EXPLORATÓRIO INFORMAR, ESCLARECER SIMPLIFICAR, ENSINAR DOCUMENTAR, DESENHAR OBJETIVO: AFIRMAR PROTOTIPAR, ITERAR, INTERAGIR, AUTOMATIZAR OBJETIVO: CONFIRMAR E DESCOBRIR ILUSTRAÇÃO DE IDEIAS DATAVIZ SIMPLES DESCOBERTAS VISUAIS
- 8. ANA BARROSOI N O V A Ç Ã O , D E S I G N T H I N K I N G & V I S U A L S E N S E M A K I N G Baseado no livro Good Charts: The HBR Guide to Making Smarter, More Persuasive Data Visualizations, de Scott Berinatto CONCEITOS DADOS DECLARATIVO EXPLORATÓRIO INFORMAR, ESCLARECER SIMPLIFICAR, ENSINAR DOCUMENTAR, DESENHAR OBJETIVO: AFIRMAR PROTOTIPAR, ITERAR, INTERAGIR, AUTOMATIZAR OBJETIVO: CONFIRMAR E DESCOBRIR ILUSTRAÇÃO DE IDEIAS DATAVIZ SIMPLES GERAÇÃO DE IDEIAS Muito usado por gestores e arquitetos de dados para testar hipóteses (focado), gerar insights e justificar resultados a partir de big data. Contexto: sessões de trabalho, análises e testes Objetivo: testar hipóteses, entender comportamentos, identificar padrões, anomalias e tendências. Competências: Business Intelligence, arquitetura de dados, programação.
- 9. ANA BARROSOI N O V A Ç Ã O , D E S I G N T H I N K I N G & V I S U A L S E N S E M A K I N G Baseado no livro Good Charts: The HBR Guide to Making Smarter, More Persuasive Data Visualizations, de Scott Berinatto CONCEITOS DADOS DECLARATIVO EXPLORATÓRIO INFORMAR, ESCLARECER SIMPLIFICAR, ENSINAR DOCUMENTAR, DESENHAR OBJETIVO: AFIRMAR PROTOTIPAR, ITERAR, INTERAGIR, AUTOMATIZAR OBJETIVO: CONFIRMAR E DESCOBRIR ILUSTRAÇÃO DE IDEIAS DATAVIZ SIMPLES GERAÇÃO DE IDEIAS
- 10. OBRIGADA. ANA BARROSOI N O V A Ç Ã O , D E S I G N T H I N K I N G & V I S U A L S E N S E M A K I N G linkedin.com/in/anabarroso CONTATO PARA CONSULTORIA, PROJETOS, PALESTRAS E FORMAÇÃO: @ contact@anabarroso.com