2. "One important idea is that science is a means whereby learning is achieved,
not by mere theretical speculation on the one hand, nor by the undirected
accumulation of practical facts on the other, but rather by a motivated
iteration between theory and practice." (George E. P. Box)
4. Motivation Example1: Pilot Trial Design
Phase II trial to compare PFS between exp and control
Randomization ratio: 1: 1
Traditional design
– Type I error rate: 0.2
– Power=0.7 to detect a HR=0.75
– Event size: 90
5. Motivation Example1: Pilot Trial Design
Pilot trial (e.g. phase II) results are usually not the …nal goal.
Pilot trial usually provides evidence to support a Go/No Go decision for a bigger
future (e.g. phase III) trial.
Proposal: design a pilot trial based on predictive probability of success (PPOS) in
future con…rmatory trial.
6. Motivation Example 2: futility interim of a con…rmatory trial
A phase 3 trial to compare PFS between exp and control arms
Number of events at …nal analysis: 500
Type I error rate (one sided) = 0.025
Question: how to place an non-binding futility IA
Traditional design: beta spending
Proposal: design based on PPOS in the …nal analysis
7. PPOS is a Variable!!!
Conditional power: probability of observing future statistical signi…cance assuming
the parameter equals a speci…c value
Predictive power: probability of observing future statistical signi…cance assuming
the parameter has a speci…c distribution
Predictive probability of success (PPOS): probability of future success assuming the
parameter has a speci…c distribution
8. Types of PPOS
Type of data: binary, normal, time to event
Relationship between the trial providing data and the trial to be predicted
– cross trial: using data from one trial to predict another independent trial
– within trial: using IA to predict …nal anlaysis (include IA data)
Relationship between the end point providing information and the end point to be
predicted (Tang, 2015)
– 1:1 Use 1 end point to predict same end point
e.g. use PFS at IA to predict PFS at …nal analysis
– 1:1 Use 1 end point to predict di¤erent end point
e.g. use short term end point in a pilot trial to predict a long term end point in
a con…rmatory trial
9. Seleted Literature Review
Spiegelhalter et al (1986) compared conditional power and predictive power.
Speigelhalter et al (1986) evaluated sample size using predictive probabilities.
– Predictive probability of success
– Predictive probability of failure
– Predictive probability of non-commitment
10. Selected Literature Review
Stallard, Whitehead, and Cleall (2005) used Bayesian predictive probability of suc-
cess for a Go/No Go decision to phase III based on data from phase II.
The method predicts the success of OS in the phase 3 trial using response and PFS
data from phase 2 trail.
11. Selected Literature Review
Lee and Liu (2008) proposed a two-stage Bayesian phase II design based on predic-
tive probability of success for binary end point single arm trial.
The method …nds the cuto¤ for PPOS by minimizing the maximum sample size
(Nmax) while meeting type I error rate and power requirement.
12. Selected Literature Review
Tang and Dey (2011) in a cross trial setting for time to event end point
– Design criteria: PPOS and false positive rate
– Di¤erence between pilot and con…rmatory trial design are accounted by cross
trial variability
Wang et al (2013) in a cross-trial setting for time to event data
– Prediction of combination treatment e¢ cacy based on single agent data
– Prediction of future trial with di¤erent end point from pilot trial
– PPOS calculated using simulation
13. Selected Literature Review
Berry (2006) covered many real life application of PPOS
– Monitoring trial: In one Herceptin trial without IA, DSMB requested PPOS and
overode the protocol to terminate the trial.
– Adaptive assignment of patients in dose …nding trials
Brannath et al (2009) used PPOS as a facility for population selection in adaptive
design
– Predictive probability and posterior probability are used for decision making.
– Cuto¤ determined by simulated operation characteristic
14. Common Issues In Current Practice
Interpretation of PPOS based on point estimate alone
PPOS cuto¤ determined by OC
Mixed use of predictive probability of success and posterior probability of success
16. Cross Trial PPOS
End point: time to event, same in pilot trial and con…rmatory trial
Parameter of interest: ln (HR)
PPOS: predictive probability of observing a successful HR (e.g. clinical meaningful)
in the future trial given the observed HR in the pilot trial.
^ is the estimated ln (HR)
^j ~N ; 2 = 1= (r (1 r) d)
where r is the randomization ratio, d is the number of events
17. Cross Trial PPOS
Assume a Gaussian prior ln (HR) = ~N 0; 2
0 = 1= (r (1 r) d0)
^1 is the estimated ln (HR) in a pilot trial
^1j ~N ; 2
1 = 1= (r (1 r) d1)
18. Cross Trial PPOS
The posterior distribution is
j^1~N ^1 + (1 ) 0; 2
0 (1 ) or
where = 1 +
2
1
2
0
1
=
2
0
2
0+ 2
1
19. Cross Trial PPOS
^2 is the estimated ln (HR) in future con…rmatory trial
^2j ~N ; 2
2 = 1= (r (1 r) d2)
The predictive distribution of ^2j^1 is
^2j^1~N ^1 + (1 ) 0; 2
0 (1 ) + 2
2
PPOS = (
[ ^1+(1 ) 0]q
2
0(1 )+ 2
2
)
20. Motivation Exampe 1
Input for PPOS calculation
Prior information
– Non-informative prior: prior variance = in…nity (equivalent to 0 event)
Envisioned phase III (matching pilot design): 500 events
Success criteria: HR 0:75 (clinical meaningful)
PPOS in 2 di¤erent designs
Event size = 90;PPOS = 0:30 if observed HR = 0:846 in phase II
Event size = 40;PPOS = 0:30 if observed HR = 0:889 in phase II
21. PPOS Credible Interval
The information supporting PPOS calculation is summarized in the posterior dis-
tribution.
(1 =2)100% percentile of PPOS = (
[ =2 100% percentile of j^1]q
2
0(1 )+ 2
2
)
23. PPOS Optimal Design
Finding the optimal design is to …nd the solution to the following equations with respect
to d1 and cuto¤ HR1
f
PPOS(d1; cut:HR1) = PPOS1
(1 =2) 100th PPOS percentile (d1; cut:HR1) = PPOS2
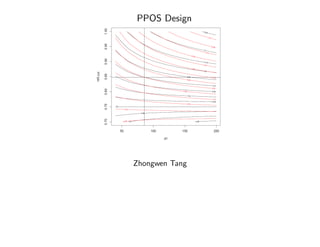
24. Motivation Example1: PPOS design
f
PPOS(d1; HR1) 30%
80th PPOS percentile (d1; HR1) 60%
for No Go decision
Optimal design: d1 = 86;cuto¤ HR = 0:848
25. Motivation Example1: PPOS optimal design
Contour lines: black (PPOS), red (80th percentile); Intersection: optimal design
27. Within Trial PPOS
Consider a randomized phase 3 trial wiht time to event end point.
Parameter of interest is log(HR)
PPOS: probability of observing a successful HR at the end of the trial given the
data at interim analysis.
PPOS =
0
@
!1z(t)
!2
=
p
r(1 r)(dmax d)
h
'^(t)+(1 ') 0
i
q
2
0(1 ')+ 2
2
1
A (Tang, 2014)
28. PPOS Decision Rule
We may mandate that if the following 2 conditions are satis…ed, then futility will be
declared.
f
PPOS PPOS1
(1 =2) 100th PPOS percentile PPOS2
29. PPOS Optimal Design
Finding the optimal futility interim design is to …nd the solution of the following equations
with respect to timing of the analysis t and cuto¤ HR at IA.
f
PPOS(t; HR:IA) = PPOS1
(1 =2) 100th PPOS percentile (t; HR:IA) = PPOS2
30. Motivation Example 2
Prior variance = in…nity (equivalent to 0 prior events)
Success criteria: observing clinically meaningful results (HR < 0:75) at …nal analy-
sis
Final analysis at 500 events
Randomization ratio 1:1
31. Optimal futility interim design
When the following 2 conditions are satis…ed, futility will be declared.
f
PPOS(t; HR:IA) 20%
80th PPOS percentile (t; HR:IA) 40%
Optimal futility IA design:t = 0:511; d1 = 256 and cuto¤ HR at IA to be 0:807
32. Take home message
The success criteria in PPOS is not restricted to statistical signi…cance.
Interpretation of PPOS should be based on both point estimate and CI.
PPOS designs have intuitive interpretation.
PPOS calculation involves subjective choices.
Some analytical methods have been developed to calculate PPOS and CI.
33. Reference
Berry D. Bayesian clinical trials. Nature reviews, 2006, 5: 27-36.
Brannath W. Zuber E. Branson M. Bretz F. Gallo P. Posch M and Racine-Poon A.
Con…rmatory adaptive designs with Bayesian decision tools for a targeted therapy in
oncology. Statistics in Medicine, 2009, 28, 1445-1463.
Johns D and Anderson J, Use of predictive probabilities in phase II and phase III clinical
trials. Journal of Biopharmaceutical Statistics. 1999; 9(1): 67-79.
Lee J and Liu D, A predictive probability design for phase II cancer clinical trials. Clinical
Trials. 2008; 5:93-106.
Spiegelhalter, D. J. and Freeman L. S. A predictive approach to selecting the size of a
clinical trial, based on subjective clinical opinion. Statistics Medicin, 5: 1-13, 1986.
Spiegelhalter, D. J., Freedman, L. S., Blackburn, P. R. (1986). Monitoring clinical trials:
conditional or predictive power. Controlled Clinical Trials 7:8–17.
34. Reference
Stallard N, Whitehead J and Cleall S, Decision-making in a phase II clinical trial: a
new approach combining Bayesian and frequentist concepts. Pharmaceutical Statistics,
2005, 4: 119-128.
Tang, Z. Dey, J. (2011). Bayesian PPOS design for clinical trials. PaSIPHIC anual
meeting.
Tang, Z. (2014). Optimal futility interim design: a predictive probability approach with
time to event ene point. Journal of Biopharmaceutical Statistics. DOI: 10.1080/10543406.201
Tang, Z. (2015). Pilot trial design: a predictive probability of success approach with
time to event end points. Statistical Methods in Medical Research (under review).
Wang, Y. Fu, H. Kulkarni, P. and Kaiser, C. (2013). Evaluating and utilizing probability
of study success in clinical development. Clinical Trials, 10, 407-413.