Kochi call girls Mallu escort girls available 7877702510
41467_2022_Article_32816.pdf
1. nature communications
Article https://doi.org/10.1038/s41467-022-32816-w
Noninvasive imaging of the tumor immune
microenvironment correlates with response
to immunotherapy in gastric cancer
Weicai Huang 1,2,10
, Yuming Jiang 1,2,10
, Wenjun Xiong3,10
, Zepang Sun1,2
,
Chuanli Chen4
, Qingyu Yuan4
, Kangneng Zhou5
, Zhen Han1,2
, Hao Feng1,2
,
Hao Chen1,2
, Xiaokun Liang6
, Shitong Yu 1,2
, Yanfeng Hu 1,2
, Jiang Yu1,2
,
Yan Chen7
, Liying Zhao1,2
, Hao Liu1,2
, Zhiwei Zhou8,9
, Wei Wang 3
,
Wei Wang 8,9
, Yikai Xu 4
& Guoxin Li 1,2
The tumor immune microenvironment (TIME) is associated with tumor
prognosis and immunotherapy response. Here we develop and validate a CT-
based radiomics score (RS) using 2272 gastric cancer (GC) patients to inves-
tigate the relationship between the radiomics imaging biomarker and the
neutrophil-to-lymphocyte ratio (NLR) in the TIME, including its correlation
with prognosis and immunotherapy response in advanced GC. The RS achieves
an AUC of 0.795–0.861 in predicting the NLR in the TIME. Notably, the
radiomics imaging biomarker is indistinguishable from the IHC-derived NLR
status in predicting DFS and OS in each cohort (HR range: 1.694–3.394,
P < 0.001). We find the objective responses of a cohort of anti-PD-1 immu-
notherapy patients is significantly higher in the low-RS group (60.9% and
42.9%) than in the high-RS group (8.1% and 14.3%). The radiomics imaging
biomarker is a noninvasive method to evaluate TIME, and may correlate with
prognosis and anti PD-1 immunotherapy response in GC patients.
Gastric cancer (GC) is one of the most commonly diagnosed cancers
and the third leading cause of cancer-related deaths worldwide1
.
Although surgery and chemotherapy have improved the survival rate
of advanced GC patients, the overall survival (OS) rate of GC patients is
<40%, and more than half of GC patients experience recurrence2,3
.
Recently, the treatment landscape of GC has been dramatically
changed by immunotherapy, which has brought astounding success in
clinical cancer treatment strategies4–6
. Moreover, the Checkmate-649
trial reported a positive result for anti-PD-1 therapy in GC, increasing
the confidence of patients and physicians in treatment decisions7,8
.
Unfortunately, although immunotherapy has benefited many patients
with various tumors, patients with GC seem to have a variable benefit
Received: 6 February 2022
Accepted: 17 August 2022
Check for updates
1
Department of General Surgery, Nanfang Hospital, The First School of Clinical Medicine, Southern Medical University, Guangzhou, Guangdong 510515,
China. 2
Guangdong Provincial Key Laboratory of Precision Medicine for Gastrointestinal Tumor, Nanfang Hospital, The First School of Clinical Medicine,
Southern Medical University, Guangzhou, Guangdong 510515, China. 3
Department of Gastrointestinal Surgery, Guangdong Provincial Hospital of Chinese
Medicine, the Second Affiliated Hospital of Guangzhou University of Chinese Medicine, Dade Road No. 111, Guangzhou 510120, China. 4
Department of Medical
Imaging Center, Nanfang Hospital, Southern Medical University, No. 1838, Guangzhou Avenue North, Guangzhou 510515, China. 5
School of Computer and
Communication Engineering, University of Science and Technology Beijing, Beijing 100083, China. 6
Shenzhen Institutes of Advanced Technology, Chinese
Academy of Sciences, Shenzhen, Guangdong 518055, China. 7
The Second Clinical Medical College, Guangzhou University of Chinese Medicine,
Guangzhou, China. 8
Department of Gastric Surgery, Sun Yat-sen University Cancer Center, 651 Dongfeng Road East, Guangzhou 510060, P. R. China. 9
State
Key Laboratory of Oncology in South China, Collaborative Innovation Center for Cancer Medicine, Guangzhou 510060, P. R. China. 10
These authors
contributed equally: Weicai Huang, Yuming Jiang, Wenjun Xiong. e-mail: wangwei16400@163.com; wangwei@sysucc.org.cn; Yikaivip@163.com;
gzliguoxin@163.com
Nature Communications| (2022)13:5095 1
1234567890():,;
1234567890():,;
2. from immunotherapy9
. Therefore, the need to identify innovative
biomarkers for the prognosis and response to immunotherapy to
improve GC treatment has long been overdue.
An increasing number of studies have highlighted that the tumor
immune microenvironment (TIME) plays an important role in cancer
progression and therapeutic response10–12
. Therefore, effective eva-
luation of the TIME can help in the clinical prediction of prognosis and
treatment efficacy. In recent years, studies have shown that tumor-
infiltrating neutrophils can change lymphocyte behavior, resulting in
tumor initiation, poor prognosis, and immunotherapy resistance13
.
Furthermore, the neutrophil-to-lymphocyte ratio (NLR) has been
identified as a prognostic indicator for cancer risk stratification and
therapy decision-making in various cancers14,15
. Recently, Alessi et al.
reported that the peripheral blood-derived NLR could be used for the
prediction of outcomes following first-line treatment with pem-
brolizumab in non-small cell lung cancer16
. However, NLR detection in
the TIME is invasive, and as a result, most studies have focused on the
NLR in peripheral blood, with only a few evaluating the NLR of the
TIME, where the effective immune response is active. However, it may
be difficult to translate a given NLR into a personalized prognosis or
treatment decision due to the large variability in peripheral blood
levels of neutrophils and lymphocytes between different individuals.
Therefore, moving NLR detection from peripheral blood to intratu-
moral and peritumoral environments can aid accurate assessment of
the prognosis and response to treatment of patients.
Radiomics is a promising method for translating computational
medical images into mineable data. It has been proposed as a method
complementary to biopsy for noninvasive evaluation of the tumor and
the tumor immune microenvironment17,18
. Previous studies have
shown that medical images contain macroscopic, cellular, and mole-
cular information about the tumor, which may help in understanding
tumor behavior19
. Importantly, with the increase in studies of pre-
dictive models, especially immune cell infiltration models, signatures
from the peritumoral region are becoming increasingly appreciated,
because peritumoralregionfeatures contain additional information on
stromal inflammation and immune infiltration20–22
. Immune cell infil-
tration in both the intratumoral and peritumoral regions is essential
for activation of the immunotherapy response. Many studies have
shown that the incorporation of intratumoral and peritumoral features
can enhance the understanding of cancer biology and the character-
ization of spatial heterogeneity, thus leading to better clinical
decisions21,23,24
. Since the performance of the radiomics approach in
clinical diagnosis, prognosis prediction, and treatment options in
many types of cancers is better than that of many other routine
methods, such as the current TNM staging system and prognostic
biomarkers in plasma (CEA, CA19-9, and EBV DNA), the radiomics
approach has gained increasing attention25–27
. Moreover, the associa-
tion between imaging features and the TIME has recently been widely
explored, indicating the power of radiomics imaging biomarker in
evaluating tumor-infiltrating cells22,28,29
. However, the relationship
between radiomics and the NLR in TIME is unclear.
In this study, we aimed to develop a noninvasive radiomics ima-
ging biomarker of the NLR in the tumor immune microenvironment
using the intratumoral and peritumoral features on computed tomo-
graphy (CT) images and to further investigate its potential predictive
power for prognosis and anti-PD-1 immunotherapy response.
Results
Clinicopathological characteristics
This study included 2272 GC patients from 3 independent centres
(Table 1 and Supplementary Table 1). Patients with NLR information or
complete follow-up data (n = 2151) were used to predict the NLR status
and survival, while those receiving immunotherapy (n = 121) were used
to evaluate the predictive power of the radiomics imaging biomarker
in predicting the response to immunotherapy and clinical outcomes of
immunotherapy. The overall study design is shown in Fig. 1. The clin-
icopathological characteristics of the training cohort (n = 240), inter-
nal validation cohorts 1 (n = 158) and 2 (n = 522), and external validation
cohorts 1 (n = 92) and 2 (n = 1139) are listed in Table 1. Among these
patients, a total of 1470 patients (68.34%) were male, while 681 patients
(31.66%) were female (median age, 57.0 (49.0–64.0) years). Most
patients (n = 1499, 69.69%) were in stage II or III.
There were two anti-PD-1 immunotherapy cohorts (Supplemen-
tary Table 1): Nanfang Hospital of Southern Medical University (SMU)
cohort (of 51 patients, 58% were male) and Guangdong Provincial
Hospital of Chinese Medicine (GPHCM) cohort (of 12 patients, 36.4%
were male) (median ages, 54 (46–65) years and 60 (49–66) years,
respectively). All patients were in stage III or IV, except for five patients
(5.7%) in the SMU cohort in stage II. Of 121 patients, 34 patients
received immunotherapy as first-line treatment, 49 patients received
immunotherapy as second-line treatment, and 38 patients received
immunotherapy as third-line treatment. The objective response (OR:
complete response and partial response) rates in the SMU cohort and
GPHCM cohort were 34.1% and 21.5%, respectively.
Association between the NLR status of the TIME and prognosis
This study first evaluated the association between the NLR status in the
TIME and prognosis. The survival curves of disease-free survival (DFS)
and OS are shown in Fig. 2. The associations between the NLR status
and clinicopathological variables in the training cohort, internal vali-
dation cohort 1, and external validation cohort 1 are reported in Sup-
plementary Tables 2–4. Patients in the NLR-Low group had the best
prognostic outcomes (DFS and OS) in the training cohort, internal
validation cohort 1, and external validation cohort 1 (all P < 0.001),
while those in the NLR-High group had the worst DFS and OS in each
cohort (P < 0.001) (Fig. 2). Moreover, the survival rates were higher in
the NLR-Mix group than in the NLR-High group in each cohort
(P < 0.001). In contrast, the survival rates were lower in the NLR-Mix
group than in the NLR-Low group in each cohort (P < 0.001) (Fig. 2).
Moreover, the prognostic value of the NLR status within each sub-
group of patients as defined by overall stage and other clin-
icopathological variables was assessed (Supplementary Figs. 1–3), and
the analyses showed that NLR status was an important prognostic
factor in GC. The prognosis of the subgroups (NLR-Mix 1: NLR ≥ 1 in
intratumoral tissue and NLR < 1 in peritumoral tissue; NLR-Mix 2:
NLR < 1 in intratumoral tissue and NLR ≥ 1 in peritumoral tissue) of the
NLR-Mix group were also compared, and no significant differences
were found (Supplementary Fig. 4).
Development and validation of a radiomics imaging biomarker
The maximum relevance minimum redundancy (mRMR) algorithm
was used to remove the redundant features, and then, six peritumoral
features and four intratumoral features were selected using least
absolute shrinkage and selection operator (LASSO) regression ana-
lyses to construct a predictive radiomics imaging biomarker of the NLR
in the TIME (Supplementary Fig. 5). The detailed calculation formula
for the radiomics score (RS) is shown in the Supplementary Results.
The associations between the radiomics imaging biomarker and clin-
icopathological variables are reported in Supplementary Tables 5–9.
The areas under the curves (AUCs) for distinguishing the NLR-High and
NLR-Low groups were 0.861 (95% CI: 0.807–0.915), 0.799 (95% CI:
0.721–0.878), and 0.805 (95% CI: 0.702–0.908) in the training cohort,
internal validation cohort 1 and external validation cohort 1, respec-
tively (Fig. 3). Moreover, the AUCs for distinguishing the NLR-High
group and the combination of the NLR-Mix and NLR-Low groups in the
training cohort, internal validation cohort 1 and external validation
cohort 1 were 0.833 (95% CI: 0.783–0.883), 0.746 (95% CI:
0.668–0.824), and 0.753 (95% CI: 0.653–0.854), respectively (Fig. 3).
We also performed ROC analysis to compare the performance of the
RS and the single selected feature in predicting NLR status and found
Article https://doi.org/10.1038/s41467-022-32816-w
Nature Communications| (2022)13:5095 2
3. that the RS was more powerful than any individual parameter in pre-
dicting NLR status, indicating the added predictive value of the RS
(Supplementary Fig. 6 and Supplementary Table 10). Importantly, the
RS was significantly different among the NLR-High, NLR-Mix, and NLR-
Low groups in each cohort (P < 0.001) (Fig. 3). The RS was significantly
higher in the NLR-High groups than in the NLR-Mix and NLR-Low
groups in the training cohort, internal validation cohort 1, and external
validation cohort 1 (P < 0.001) (Fig. 3).
Prognostic value of the radiomics imaging biomarker
The radiomics imaging biomarker was significantly associated with
clinical outcomes in the training cohort, internal validation cohorts
1 and 2, and the external validation cohorts 1 and 2 (Fig. 4, Tables 2
and 3). The 5-year DFS rates were higher in the RS-Low groups
(79.16%, 73.47%, 56.23%, and 75.70% in the training cohort, internal
validation cohorts 1 and 2, and the external validation cohort,
respectively) than in the RS-High groups (31.80%, 23.24%, 28.31%,
Table 1 | Characteristics of patients with GC in each cohort
Variables Training
cohort
(n = 240)
Internal vali-
dation cohort
1 (n = 158)
Internal vali-
dation cohort
2 (n = 522)
External vali-
dation
cohort
1 (n = 92)
External valida-
tion cohort
2 (n = 1139)
n % n % n % n % n %
Gender
Male 151 62.9 112 70.9 361 69.2 31 33.7 354 31.1
Female 89 37.1 46 29.1 161 30.8 61 66.3 785 68.9
Age (years), median (interquartile range) 57 (49–64) 56 (46–62) 56 (48–63) 59 (45–65) 57 (50–65)
Differentiation
Well 27 11.3 10 6.3 89 17 1 1.1 19 1.7
Moderate 60 25 44 27.8 117 22.4 19 20.7 176 15.5
Poor or undifferentiation 153 63.7 104 65.9 316 60.6 72 78.2 955 82.9
Location
Cardia 50 20.8 38 24.1 67 12.8 29 31.5 390 34.2
Body 47 19.6 28 17.7 95 18.2 23 25 226 19.8
Antrum 129 53.8 83 52.5 317 60.7 35 38 468 41.2
Whole 14 5.8 9 5.7 43 8.3 5 5.5 55 4.8
Lauren type
Intestinal type 110 45.8 75 47.5 236 45.2 29 31.5 392 34.4
Diffuse or mixed type 130 54.2 83 52.5 286 54.8 63 68.5 747 65.6
CEA
Elevated 26 10.8 20 12.7 55 10.5 16 17.4 228 20
Normal 214 89.2 138 87.3 467 89.5 76 82.6 911 80
CA19-9
Elevated 31 12.9 15 9.5 88 16.9 11 12 231 20.3
Normal 209 87.1 143 90.5 434 83.1 81 88 908 79.7
Depth of invasion
T1 55 22.9 27 17.1 144 27.6 14 15.2 142 12.5
T2 21 8.8 14 8.9 81 15.5 10 10.9 127 11.2
T3 29 12.1 19 12 15 2.9 21 22.8 250 21.9
T4a 110 45.8 68 43 165 31.6 38 41.3 530 46.5
T4b 25 10.4 30 19 117 22.4 9 9.8 90 7.9
Lymph node metastasis
N0 110 45.8 58 36.7 245 46.9 34 37 372 32.7
N1 44 18.3 26 16.5 118 22.6 14 15.2 185 16.2
N2 22 9.2 27 17.1 62 11.9 11 12 202 17.7
N3a 35 14.6 29 18.4 70 13.4 19 20.7 246 21.6
N3b 29 12.1 18 11.4 27 5.2 14 15.2 134 11.8
Distant metastasis
M(−) 233 97.1 152 96.2 475 91 84 91.3 1006 88.3
M(+) 7 2.9 6 3.8 47 9 8 8.7 133 11.7
TNM stage
I 65 27.1 34 21.5 129 24.7 19 20.7 197 17.3
II 58 24.2 30 19 124 23.8 21 22.8 289 25.4
III 110 45.8 88 55.7 222 42.5 44 47.8 520 45.7
IV 7 2.9 6 3.8 47 9 8 8.7 133 11.7
M(−) negative metastasis, M(+) positive metastasis.
Article https://doi.org/10.1038/s41467-022-32816-w
Nature Communications| (2022)13:5095 3
4. and 48.69% in the training cohort, internal validation cohorts 1 and 2
and the external validation cohort, respectively) (Fig. 4). In addi-
tion, the 5-year OS rates showed the same trend described above
(Fig. 4). The 5-year OS rates in the RS-Low groups were 89.08%,
77.73%, 66.73%, and 76.13% in the training cohort, internal validation
cohorts 1 and 2, and the external validation cohort, respectively. In
contrast, patients in the RS-High group had the poorest 5-year OS
rates (43.35% in the training cohort, 31.92% in internal validation
cohort 1, 40.91% in internal validation 2, and 48.58% in the external
validation cohort) (Fig. 4).
Univariate Cox regression analysis revealed that the radiomics
imaging biomarker was a prognostic factor for DFS and OS in each
cohort (Supplementary Tables 11–14). Moreover, multivariate Cox
regression analysis adjusted for clinicopathological variables, includ-
ing TNM stage and histologic subtype, revealed that the radiomics
imaging biomarker remained an independent prognostic factor for
SMU cohort 1
(n = 240)
Discovery
CT images IHC slides
Develop a radiomics model for
Predicting the NLR at IHC
Radiomics signature of NLR
SMU cohort 1
(n = 240)
SMU cohort 2
(n = 158)
SYSUCC
cohort 1
(n = 92)
CT images, clinical data
Predict NLR of patients with GC
CT images, clinical data
SMU cohort 4
(n = 88)
GPHCM cohort
(n = 33)
CT images, clinical data
Predict response to anti-PD-1 immunotherapy,
PFS and OS in patients with GC
Predict Disease-free Survival, and Overall Survival
Validations
SYSUCC
cohort
(n = 1231)
SMU cohort 1
(n = 240)
SMU cohort 2
(n = 158)
SMU cohort 3
(n = 522)
Intratumor
Peritumor
Intra- and peritumor
NLR
Status
NLR-High
NLR-Mix
NLR-Low
Features
Intensity
Shape
Second or
Higher
textural
Fig. 1 | Study design for the discovery and validation of the radiomics imaging
biomarker of NLR in gastric cancer. SMU cohort 1 was the training cohort for
developing the radiomics imaging biomarker. SMU cohort 2 and SMU cohort 3
were the internal validation cohorts. SYSUCC cohort 1 and SYSUCC cohort were
the external validation cohorts. SMU cohort 4 and the GPHCM cohort were used
to evaluate the of response to anti-PD-1 immunotherapy and the clinical out-
comes of immunotherapy.
Article https://doi.org/10.1038/s41467-022-32816-w
Nature Communications| (2022)13:5095 4
5. DFS and OS in each cohort (Tables 2 and 3). We assessed the prog-
nostic value of the radiomics imaging biomarker in each subgroup of
patients as defined by clinicopathological variables. Our analyses
showed significant differences in DFS and OS between patients in the
three RS groups in all subgroups defined by overall stage, T stage, N
stage, size, and histological subtype (Supplementary Figs. 7–9). Taken
together, these data suggest that the radiomics imaging biomarker is
an effective independent prognostic factor in gastric cancer.
We also investigated the relationship between clinicopathologic
factors and clinical outcomes. Depth of invasion (T) and lymph node
metastasis (N) were found to be significantly associated with DFS and
OS (P < 0.001) in the training cohort. Moreover, distant metastasis was
significantly associated with DFS (P = 0.004) in the training cohort. The
variables were then integrated with the RS to develop nomograms for
DFS and OS based on their contribution to different clinical outcomes
(Supplementary Figs. 10 and 11). To evaluate the enhanced power of
the nomograms, we then calculated the C-indices for comparing the
performance. Importantly, in the training cohort, the C-indices of the
nomogram for predicting DFS (0.784 (95% CI: 0.745–0.823) and OS
(0.791 (95% CI: 0.749–0.834)) were higher than those of RS and TNM
stage, indicating that the nomogram integrating RS and TNM stage can
enhance the predictive power in predicting prognosis compared with
RS or TNM stage alone (Supplementary Table 15). Similar results were
found in the validation cohorts (Supplementary Table 15).
Predictive value of the radiomics imaging biomarker for
anti-PD-1 immunotherapy response
This study assessed the associations between the radiomics imaging
biomarker and the response to anti-PD-1 immunotherapy and the
clinical outcomes of immunotherapy in the two cohorts. Interestingly,
the RS was significantly lower (mean: −0.383, 95% CI (−0.565, −0.201))
in the OR group than in the progressive disease (PD) group (0.234, 95%
CI (0.067, 0.402)) and the stable disease (SD) group (0.205, 95% CI
(−0.048, 0.458)) in the SMU cohort (P < 0.001) (Fig. 5). Similar results
were found in the GPHCM cohort. The mean RSs in the OR, PD and SD
groups were −0.388 (95% CI: −0.958, 0.182), 0.275 (95% CI: −0.079,
0.629) and −0.003 (95% CI: −0.330, 0.324), respectively. When classi-
fying the patients into different RS groups, we found that the OR rates
(60.9% and 42.9% in the SMU and GPHCM cohorts, respectively) were
significantly higher in the RS-Low group than in the RS-High group
(8.1% and 14.3% in the SMU and GPHCM cohorts, respectively) (Fig. 5).
Moreover, 69.6% and 71.5% of patients in the RS-Low group had disease
control (stable disease, partial response, or complete response) in the
SMU and GPHCM cohorts, respectively. In the RS-High group, only
29.7% and 35.7% of patients had disease control in the SMU and
GPHCM cohorts, respectively (Fig. 5). In contrast, the RS-High group
had the highest PD rates (70.3% and 64.3%) (Fig. 5).
Because of the limited number of patients in the GPHCM cohort,
patients from the SMU cohort and GPHCM cohort were combined to
evaluate progression-free survival (PFS) and OS. Notably, the median
PFS in the RS-Low group was 7.95 months (95% CI: 8.02–13.04), which
was longer than that in the RS-High group (median: 5.63 months, 95%
CI: 5.30–8.08). Similarly, the median OS in the RS-Low group was
longer than that in the RS-High group (median: 11.30 months (95% CI:
9.62–14.06) vs. 8.80 months (95% CI: 7.82–10.66)). Moreover,
Kaplan–Meier analysis showed that the radiomics imaging biomarker
was significantly associated with PFS (HR: 1.374 (95% CI: 1.143–1.652),
P < 0.001) and OS (HR: 1.327 (95% CI: 1.075–1.639), P = 0.021) (Fig. 5).
Patients in the RS-Low group had longer PFS and OS times than
patients in the RS-High group (Fig. 5), indicating that the radiomics
imaging biomarker is associated with the response to anti-PD-1
immunotherapy. Similar results were found after performing sub-
group analysis stratified by disease stage (Supplementary Fig. 12).
Because there were different treatment lines of immunotherapy in
the SMU cohort, subgroup analyses of treatment lines were performed
to assess the performance of the RS in evaluating the response to anti-
PD-1 immunotherapy (Supplementary Fig. 13). To our surprise,
patients with a low RS still had the highest OR rates (87.5% in the first-
0 20 40 60 80 100 120
0
50
100
month
Disease-free
survival
probability
NLR-L
NLR-M
NLR-H
No. at risk
NLR-L
NLR-M
NLR-H
80
80
80
79
65
26
73
56
16
62
43
8
13
6
0
0
0
0
3
2
0
Log rank P < 0.001
0 20 40 60 80 100 120
0
50
100
Internal validaton cohort 1
month
Disease-free
survival
probability
NLR-L
NLR-M
NLR-H
No. at risk
NLR-L
NLR-M
NLR-H
56
43
59
55
29
25
47
22
12
36
16
3
8
4
0
0
0
0
4
1
0
Log rank P < 0.001
0 20 40 60 80 100
0
50
100
External validation cohort 1
month
Disease-free
survival
probability
NLR-L
NLR-M
NLR-H
No. at risk
NLR-L
NLR-M
NLR-H
37
27
28
36
25
12
29
16
8
13
10
2
0
0
0
0
0
0
Log rank P < 0.001
0 20 40 60 80 100 120
0
50
100
Training cohort
month
Overall
Survival
Probability
NLR-L
NLR-M
NLR-H
No. at risk
NLR-L
NLR-M
NLR-H
80
80
80
80
73
47
75
63
25
65
45
12
13
6
3
0
0
0
3
2
0
Log rank P < 0.001
0 20 40 60 80 100 120
0
50
100
Internal validation cohort 1
month
Overall
Survival
Probability
NLR-L
NLR-M
NLR-H
No. at risk
NLR-L
NLR-M
NLR-H
56
43
59
56
33
34
53
27
20
40
18
6
7
4
0
0
0
0
5
1
0
Log rank P < 0.001
0 20 40 60 80 100
0
50
100
External validation cohort 1
month
Overall
Survival
Probability
NLR-L
NLR-M
NLR-H
No. at risk
NLR-L
NLR-M
NLR-H
37
27
28
36
25
14
29
18
8
14
10
2
0
0
0
0
0
0
Log rank P < 0.001
a. Disease-free survival of each cohort
Training cohort
b. Overall survival of each cohort
Fig. 2 | Kaplan–Meier analyses of disease-free survival (DFS) and overall
survival (OS) according to different NLR statuses of the TIME in patients with
gastric cancer. a Disease-free survival according to different NLR statuses of the
TIME in the training cohort, internal validation cohort 1, and external validation
cohort 1. b Overall survival according to different NLR statuses of the TIME in the
training cohort, internal validation cohort 1, and external validation cohort 1. NLR-L:
NLR-Low group, NLR-M: NLR-Mix group, NLR-H: NLR-High group, comparisons of
the above progression survival curves were performed with a two-sided log-rank
test. Dashed lines around the survival curves represent 95% confidence intervals.
Source data are provided as a Source data file.
Article https://doi.org/10.1038/s41467-022-32816-w
Nature Communications| (2022)13:5095 5
6. N
L
R
-
L
N
L
R
-
M
N
L
R
-
H
-2
-1
0
1
2
IHC NLR status
Rad-score
P < 0.001
P < 0.001
N
LR
-L
N
LR
-M
N
LR
-H
-2
-1
0
1
2
IHC NLR status
Rad-score
P < 0.001
P < 0.001
N
L
R
-
L
N
L
R
-
M
N
L
R
-
H
-2
-1
0
1
2
Rad-score
IHC NLR status
P < 0.001
P < 0.001
0.0
0.2
0.4
0.6
0.8
1.0
0
0.0
0.2
0.4
0.6
0.8
1.0
0.0
0.2
0.4
0.6
0.8
1.0
0.0
0.2
0.4
0.6
0.8
1.0
0.0
0.2
0.4
0.6
0.8
1.0
0.0
0.2
0.4
0.6
0.8
1.0
a.NLR-H vs. NLR-L
b. NLR-H vs. (NLR-M and NLR-L)
c. Rad score of NLR
Training cohort Internal validation cohort 1
Internal validation cohort 1
Internal validation cohort 1
External validation cohort 1
External validation cohort 1
Training cohort
Training cohort
e
t
a
r
e
v
i
t
i
s
o
p
-
e
u
r
T
e
t
a
r
e
v
i
t
i
s
o
p
-
e
u
r
T
False-positive rate
False-positive rate False-positive rate False-positive rate
False-positive rate False-positive rate
AUC: 0.861 (0.807-0.915)
AUC: 0.833 (0.783-0.883) AUC: 0.746 (0.668-0.824) AUC: 0.753 (0.653-0.854)
AUC: 0.799 (0.721-0.878) AUC: 0.805 (0.702-0.908)
External validation cohort 1
Fig. 3 | Performance of the radiomics imaging biomarker in the training and
validation cohorts. a AUCs of the receiver operating characteristic curves of the
radiomics imaging biomarker comparing the NLR-H group to the NLR-L group in
each cohort. b AUCs of the receiver operating characteristic curves of the radiomics
imaging biomarker comparing the NLR-H group to the combination of the NLR-L
and NLR-M groups in each cohort. c Radiomics score of different NLR statuses in
the training cohort (NLR-L: n = 80; NLR-M: n = 80; NLR-H: n = 80), internal valida-
tion cohort 1 (NLR-L: n = 56; NLR-M: n = 43, NLR-H: n = 59), and external validation
cohort 1 (NLR-L: n = 37; NLR-M: n = 27; NLR-H: n = 28). The data are presented as the
mean values with SEM. For statistical comparisons among different groups, a two-
tailed t test (unpaired) was used. NLR-H: NLR-High group, NLR-M: NLR-Mix group,
NLR-L: NLR-Low group. Source data are provided as a Source data file.
Article https://doi.org/10.1038/s41467-022-32816-w
Nature Communications| (2022)13:5095 6
7. 0 20 40 60 80 100 120
0
50
100
Training cohort
month
Disease-free
survival
probability
RS-L
RS-M
RS-H
No. at risk
RS-L
RS-M
RS-H
80
80
80
74
52
44
68
45
33
58
35
19
12
4
5
3
0
1
0
0
0
Log rank P < 0.001
0 20 40 60 80 100 120
0
50
100
Internal validation cohort 1
month
Disease-free
survival
probability
RS-L
RS-M
RS-H
No. at risk
RS-L
RS-M
RS-H
36
59
63
33
42
33
26
36
19
22
21
13
6
5
4
2
2
2
0
0
0
Log rank P < 0.001
0 20 40 60 80 100
0
50
100
Internal validation cohort 2
month
Disease-free
survival
probability
RS-L
RS-M
RS-H
No. at risk
RS-L
RS-M
RS-H
147
179
196
117
128
98
88
102
65
45
49
32
7
9
7
0
0
0
Log rank P < 0.001
0 20 40 60 80 100
0
50
100
External validation cohort
month
Disease-free
survival
probability
RS-L
RS-M
RS-H
No. at risk
RS-L
RS-M
RS-H
368
391
472
307
307
291
190
173
161
94
78
79
38
20
15
0
0
0
Log rank P < 0.001
0 20 40 60 80 100 120
0
50
100
Training cohort
month
Overall
Survival
Probability
RS-L
RS-M
RS-H
No. at risk
RS-L
RS-M
RS-H
80
80
80
78
65
57
72
54
37
62
36
25
12
4
6
3
0
3
0
0
0
Log rank P < 0.001
0 20 40 60 80 100 120
0
50
100
Internal validation cohort 1
month
Overall
Survival
Probability
RS-L
RS-M
RS-H
No. at risk
RS-L
RS-M
RS-H
36
59
63
35
47
41
31
40
29
22
24
17
6
4
4
2
3
2
0
0
0
Log rank P < 0.001
0 20 40 60 80 100
0
50
100
Internal validation cohort 2
month
Overall
Survival
Probability
RS-L
RS-M
RS-H
No. at risk
RS-L
RS-M
RS-H
147
179
196
126
137
116
105
109
73
51
53
35
7
9
7
0
0
0
Log rank P < 0.001
0 20 40 60 80 100
0
50
100
External validation cohort
month
Overall
Survival
Probability
RS-L
RS-M
RS-H
No. at risk
RS-L
RS-M
RS-H
368
391
472
312
316
308
196
180
169
97
81
85
38
20
15
0
0
0
Log rank P < 0.001
a. Disease-free survival of each cohort
b. Overall survival of each cohort
Fig. 4 | Kaplan–Meier analyses of disease-free survival (DFS) and overall sur-
vival (OS) according to different RS groups in patients with gastric cancer.
a Disease-free survival according to different RS groups in the training cohort,
internal validation cohort 1, internal validation cohort 2, and the external validation
cohort. b Overall survival according to different RS groups in the training cohort,
internal validation cohort 1, internal validation cohort 2, and the external validation
cohort. RS-L: RS-Low group, RS-M: RS-Middle group, RS-H: RS-High group. Com-
parisons of the above progression survival curves were performed with a two-sided
log-rank test. Dashed lines around the survival curves represent 95% confidence
intervals. Source data are provided as a Source data file.
Article https://doi.org/10.1038/s41467-022-32816-w
Nature Communications| (2022)13:5095 7
8. line treatment group; 46.7% in the second or third-line treatment
groups), regardless of the treatment line (Supplementary Fig. 13),
further indicating that the radiomics imaging biomarker of the NLR is
associated with the response to immunotherapy in GC.
Discussion
The tumor immune microenvironment is increasingly being recog-
nized as a major determinant of tumor biology and a regulator of
antitumor drug sensitivity30
. Tumor-infiltrated cells participate in each
step of carcinogenesis from tumor initiation, and tumor growth to
metastasis and treatment response. For a long time, lymphocytes were
regarded as the key tumor-associated cell type in tumor progression.
However, in recent years, other immune cells, such as neutrophils,
which can alter the behavior of lymphocytes and therefore regulate
tumor progression, have been increasingly appreciated13
. In addition,
the crucial role of the TIME in identifying patients who could benefit
from immunotherapy has been recognized due to the increased
exploration of immunotherapy for cancer treatment29,31–33
. However,
currently, the clinical detection of tumor-infiltrated immune cells
mainly relies on immunohistochemistry (IHC) staining or flow cyto-
metry through invasive biopsies, which have a risk of morbidities.
Therefore, an effective noninvasive method for examining the TIME
Table 2 | Multivariate Cox regression analyses for disease-free survival and overall survival in patients with gastric cancer in the
training and internal validation cohorts
Variables Disease-free survival Overall survival
HR (95% CI) p HR (95% CI) p
Training cohort
RS 2.118 (1.478–3.035) <0.0001 1.894 (1.287–2.788) 0.001
Depth of invasion
T1 0.068 (0.023–0.202) <0.0001 0.069 (0.020–0.232) <0.0001
T2 0.111 (0.035–0.358) <0.0001 0.159 (0.049–0.515) 0.002
T3 0.233 (0.105–0.516) <0.0001 0.206 (0.085–0.495) <0.0001
T4a 0.273 (0.159–0.469) <0.0001 0.258 (0.145–0.458) <0.0001
T4b Reference
Lymph node metastasis
N0 0.319 (0.165–0.616) 0.001 0.286 (0.137–0.597) 0.001
N1 0.415 (0.229–0.753) 0.004 0.296 (0.151–0.579) <0.0001
N2 0.289 (0.134–0.626) 0.002 0.338 (0.147–0.778) 0.011
N3a 0.551 (0.289–1.051) 0.07 0.554 (0.273–1.121) 0.1
N3b Reference Reference
Distant metastasis 3.621 (1.496–8.766) 0.004
Internal validation cohort 1
RS 1.659 (1.045–2.634) 0.032 1.744 (1.103–2.757) 0.017
Depth of invasion
T1 0.134 (0.040–0.444) 0.001 0.103 (0.027–0.388) 0.001
T2 0.307 (0.095–0.989) 0.048 0.277 (0.088–0.868) 0.028
T3 0.257 (0.111–0.591) 0.001 0.257 (0.111–0.594) 0.001
T4a 0.403 (0.235–0.691) 0.001 0.403 (0.228–0.713) 0.002
T4b Reference Reference
Lymph node metastasis
N0 0.156 (0.065–0.379) <0.0001 0.255 (0.103–0.634) 0.003
N1 0.198 (0.087–0.451) <0.0001 0.253 (0.102–0.628) 0.003
N2 0.321 (0.150–0.689) 0.004 0.396 (0.174–0.902) 0.027
N3a 0.407 (0.191–0.869) 0.02 0.586 (0.265–1.296) 0.187
N3b Reference Reference
Internal validation cohort 2
RS 1.478 (1.209–1.806) 0.0001 1.544 (1.243–1.919) <0.0001
CEA (elevated versus normal) 1.429 (1.004–2.036) 0.048 1.720 (1.161–2.546) 0.007
CA19-9 (elevated versus normal) 1.782 (1.300–2.442) <0.0001 1.598 (1.118–2.285) 0.01
Depth of invasion
T1 0.148 (0.098–0.224) <0.0001 0.140 (0.085–0.230) <0.0001
T2 0.278 (0.167–0.465) <0.0001 0.373 (0.216–0.644) <0.0001
T3 0.427 (0.200–0.908) 0.027 0.598 (0.265–1.349) 0.215
T4a 0.405 (0.295–0.555) <0.0001 0.477 (0.339–0.672) <0.0001
T4b Reference Reference
Distant metastasis 2.471 (1.725–3.542) <0.0001 2.080 (1.415–3.058) <0.0001
P values reported are two-tailed from Cox proportional hazard regression analyses.
RS radiomics score, HR hazard ratio.
Article https://doi.org/10.1038/s41467-022-32816-w
Nature Communications| (2022)13:5095 8
9. can help in assessing prognosis and making treatment decisions.
Herein, based on a large number of pathology slides of cancer tissue, a
radiomics imaging biomarker was developed using intratumoral and
peritumoral features from CT images to noninvasively predict the NLR
in the TIME of GC patients. Notably, the analysis conducted before
biomarker development showed that the IHC-derived NLR status was
strongly associated with DFS and OS, indicating the crucial role of the
NLR in the TIME in prognosis. Furthermore, the results showed thatthe
radiomics imaging biomarker could predict the NLR status in the TIME
with good performance. Further analysis showed that the predictive
biomarker was indistinguishable from the IHC-derived NLR status in
predicting DFS and OS, indicating that the radiomics imaging bio-
marker could potentially be a surrogate for IHC-determined NLR
detection. The results also showed that the radiomics imaging bio-
marker was related to the response to anti-PD-1 immunotherapy and
could predict the PFS and OS of patients who received immunother-
apy, indicating its potential benefit in predicting prognosis and facil-
itating treatment decision making.
Recently, studies on radiomics have enhanced the understanding
of the role of radiomics in distinguishing tumor homogeneity and
heterogeneity. A recent study reported that the combination of
intratumoral and peritumoral features can effectively predict com-
plete pathological response to neoadjuvant chemotherapy in breast
cancer regardless of the receptor status21
, indicating the clinical value
of the peritumoral features. Moreover, the above study reported that a
combination of peritumoral and intratumoral features is related to
tumor-infiltrated lymphocytes, consistent with the findings of this
study21
. Our previous study found that radiomics features from the
tumor and its periphery can be used to evaluate the immune cells in
the tumor microenvironment22
. In fact, the peritumoral area comprises
the tumor-stroma interface and can be used to evaluate the immune
response. Herein, this study used a cohort of IHC samples to identify
the immune cells infiltrated in both the tumoral and peritumoral
regions to evaluate patient prognosis and the effective immune
response. Importantly, this study not only assessed the NLR in the
tumor, but also assessed the NLR in the peritumoral tissues. Corre-
spondingly, features were extracted from both tumor and its periph-
ery. The developed radiomics imaging biomarker showed good
performance in predicting the NLR in the TIME, indicating the poten-
tial predictive value of peritumoral features. Interestingly, in this study,
the textures that reflect the dissimilarity and coarseness of tumors,
such as NGTDM, GLCM, and GLRLM features, were strongly associated
with the NLR status of the TIME. Therefore, these features may be used
to differentiate the density of the neutrophils and lymphocytes in
the TIME.
Many studies have reported that neutrophils and other cells,
including macrophages, can stimulate the tumor microenvironment
by secreting many cytokines34–38
. Moreover, the NLR has been recog-
nized as an important predictor of clinical outcomes and immu-
notherapy treatment response16,39–41
. However, these studies mainly
focused on the NLR in peripheral blood, with only a few evaluating the
NLR in the TIME. Notably, an effective tumor immune response mainly
occurs in the TIME. It was interesting that in this study, although an
elevated NLR status in the TIME was caused by both an increase in
neutrophils and a decrease in lymphocytes, the decrease in lympho-
cytes had the greatest impact on NLR-High status. Therefore, an ele-
vated NLR status in the TIME may represent a “colder” TIME that
suppresses antitumor function42
. In this study, we used a radiomics-
based biomarker to noninvasively predict and validate the NLR in the
TIME in multiple institutions. The radiomics-based biomarker was then
Table 3 | Multivariate Cox regression analyses for disease-free survival and overall survival in patients with gastric cancer in
the external validation cohort
Variables Disease-free survival Overall survival
HR (95% CI) p HR (95% CI) p
External validation cohort
RS 1.180 (1.013–1.373) 0.033 1.167 (1.003–1.358) 0.046
Age (≥60 vs. <60 years) 1.269 (1.028–1.565) 0.026 1.263 (1.023–1.558) 0.03
Location
Cardia 0.841 (0.567–1.246) 0.388 0.731 (0.496–1.976) 0.112
Body 0.467 (0.308–0.708) <0.0001 0.443 (0.294–0.668) <0.0001
Antrum 0.572 (0.386–0.845) 0.005 0.503 (0.342–0.740) <0.001
Whole Reference Reference
CA19-9 (elevated versus normal) 1.553 (1.242–1.943) <0.0001 1.563 (1.248–1.957) <0.0001
Lauren type (diffuse or mixed vs. Intestinal) 1.697 (1.238–2.326) 0.001 1.554 (1.242–1.943) 0.0001
Depth of invasion
T1 0.306 (0.149–0.629) 0.001 0.265 (0.121–0.581) 0.001
T2 0.318 (0.178–0.566) <0.0001 0.341 (0.191–0.608) <0.0001
T3 0.442 (0.306–0.638) <0.0001 0.445 (0.308–0.645) <0.0001
T4a 0.779 (0.581–1.045) 0.096 0.791 (0.589–1.062) 0.119
T4b Reference Reference
Lymph node metastasis
N0 0.216 (0.146–0.321) <0.0001 0.218 (0.147–0.323) <0.0001
N1 0.428 (0.300–0.612) <0.0001 0.413 (0.287–0.595) <0.0001
N2 0.561 (0.408–0.770) <0.0001 0.580 (0.421–0.799) 0.001
N3a 0.670 (0.505–0.888) 0.005 0.699 (0.526–0.928) 0.013
N3b Reference Reference
Distant metastasis 2.473 (1.920–3.186) <0.0001 2.503 (1.941–3.228) <0.0001
P values reported are two-tailed from Cox proportional hazard regression analyses.
RS radiomics score, HR hazard ratio.
Article https://doi.org/10.1038/s41467-022-32816-w
Nature Communications| (2022)13:5095 9
10. verified to be similar to the IHC-derived NLR status in predicting DFS
and OS, suggesting that this imaging biomarker might hold potential
use as a useful surrogate for biopsy in evaluating the TIME.
Moreover, the radiomics imaging biomarker was associated
with the response to anti-PD-1 immunotherapy and the clinical
outcomes of immunotherapy in both immunotherapy cohorts.
Patients with a low RS had the highest OR rate regardless of the
treatment line, indicating that the NLR status of the TIME is asso-
ciated with the response to immunotherapy. In this study, the PFS
and OS times were longer in the RS-Low group than in the RS-High
group after treatment with immunotherapy, indicating that the
radiomics imaging biomarker could be used as an additional
-
2
-
1
0
1
2
PD
SD
OR
Rad-score
Responses
to
anti-PD-1
immunotherapy ***
****
-2 -1 0 1 2
PD
SD
OR
Rad-score
Responses
to
anti-PD-1
immunotherapy
*
*
PD SD OR
-2.0
-1.5
-1.0
-0.5
0.0
RS-L
Responses to anti-PD-1 immunotherapy
Rad-score
30.4% 8.7% 60.9%
PD SD OR
-0.4
-0.2
0.0
0.2
RS-M
Responses to anti-PD-1 immunotherapy
Rad-score
32.1% 21.4% 46.5%
PD SD OR
0.0
0.5
1.0
1.5
RS-H
Responses to anti-PD-1 immunotherapy
Rad-score
70.3% 21.6% 8.1%
PD SD OR
-1.7
-1.2
-0.7
-0.2
RS-L
Responses to anti-PD-1 immunotherapy
Rad-score
28.6% 28.6% 42.9%
PD SD OR
-0.6
-0.4
-0.2
0.0
0.2
RS-M
Responses to anti-PD-1 immunotherapy
Rad-score
33.3% 41.7% 25.0%
PD SD OR
0.0
0.5
1.0
1.5
2.0
RS-H
Responses to anti-PD-1 immunotherapy
Rad-score
64.3% 21.4% 14.3%
Rad-score of different response to anti-PD 1 therapy
a. SMU Cohort
c. SMU Cohort
b. GPHCM Cohort
d. GPHCM Cohort
e. Computed tomography scan
f. g.
Baseline
Objective Response Progressive Dise
After treatment After treatment
Baseline
Treatment response to anti-PD 1 therapy in different RS group
0 5 10 15 20 25 30
0
50
100
PFS
month
Progression-free
survival
probability
RS-L
RS-M
RS-H
Log rank P < 0.001
No. at risk
30
40
51
22
29
29
15
16
14
9
7
3
4
1
2
1
0
0
0
0
0
HR: 1.374 (95%CI: 1.143-1.652)
0 5 10 15 20 25 30
0
50
100
OS
month
Overall
Survival
Probability
RS-L
RS-M
RS-H
Log rank P = 0.021
No. at risk
30
40
51
27
35
38
19
18
22
9
7
7
4
1
2
1
0
0
0
0
0
HR: 1.327 (95%CI: 1.075-1.639)
Article https://doi.org/10.1038/s41467-022-32816-w
Nature Communications| (2022)13:5095 10
11. method for predicting the benefit of immunotherapy to guide
clinical practice.
In recent years, immunotherapy has benefited patients with many
cancer types. Moreover, immunotherapy has been approved as an
adjuvant treatment for non-small cell lung cancer, bringing a promis-
ing future for immunotherapy use to improve cancer treatment43
.
However, the current implementation of immunotherapy in GC is
limited. Although immunotherapy has been recognized as a first-line
treatment for advanced GC in the NCCN Clinical Practice Guidelines in
Oncology, anti-PD-1 drugs are still suggested as a combination regimen
with chemotherapy44
. Anti-PD-1 or anti-PD-L1 drugs are currently
recommended for cancer patients based on PD-L1 detection in tumor
or immune cells via IHC, microsatellite instability (MSI) detection via
polymerase chain reaction, or mismatch repairdeficiency detection via
IHC45
. For GC, immunotherapy is also recommended if the patient is
positive for Epstein–Barr virus (EBV)46
. However, the detection of these
markers requires invasive procedures. Moreover, some studies have
reported that PD-L1 expression alone is not sufficient to predict the
treatment response to immunotherapy47,48
. Although response rates
are more than 50% in MSI-high tumors, these tumors constitute only
~4% of gastroesophageal cancers; therefore, relying on the MSI
status to guide treatments may limit the implementation of
immunotherapy46
. In addition, the OR rate of EBV positive GC varies
from 0 to 100%, indicating that EBV is not a stable biomarker for the
evaluation of immunotherapy49,50
. Indeed, most of the patients
receiving immunotherapy in this study met at least one of the above
implementation criteria to use anti-PD-1 immunotherapy, but the
actual OR rate was still low, and most of the patients were ultimately
found to have progressive disease, indicating that the above PD-L1/
MSI/EBV biomarkers are still limited in predicting the efficacy of
immunotherapy. The limitation of the above markers in evaluating the
efficacy of immunotherapy suggests that the response to immu-
notherapy does not rely on the detection of a single tumor feature or a
single tumor-infiltrated immune cell type. Effective evaluation of the
TIME may help in improving current therapeutic decisions. Therefore,
we developed a biomarker that could not only noninvasively evaluate
the TIME, but also potentially predict the potential response to
immunotherapy, providing a tool which could be included in clinical
decision making.
The present study found that the radiomics imaging biomarker of
the NLR in the TIME of GC could be used to evaluate the response to
immunotherapy regardless of the treatment line. However, due to the
limited number of immunotherapy cohorts, in the future, studies on
the radiomics imaging biomarker of the NLR in the TIME should fur-
ther investigate the association between radiomics imaging bio-
markers and the response to immunotherapy.
This study has some limitations. First, this was a retrospective
study. As a result, this study included a large number of patients from
three independent centres to validate the findings and ensure repro-
ducibility. The second limitation is the difference in the quality of the
CT images obtained from different scanners and institutions. There-
fore, this study conducted data standardization to minimize the effect
of the above issue. Third, the number of patients in the immunother-
apy cohorts was limited. Anti-PD-1 drugs are widely used as second- or
third-line treatments for GC and have been applied as regular drugs for
just a few years, limiting the number of study patients. Therefore, since
anti-PD-1 drugs are recognized as a first-line treatment for advanced
GC in the NCCN Clinical Practice Guidelines in Oncology, prospective
and randomized clinical trials are needed to further validate the find-
ings of the current study.
In conclusion, this study suggests that the radiomics imaging
biomarker can effectively and noninvasively predict the NLR in the
TIME of GC. Furthermore, the radiomics imaging biomarker of the NLR
in the TIME identified in this study is correlated with the clinical out-
comes and the response to immunotherapy.
Methods
This study was approved by the Institutional Review Board of
Nanfang Hospital of Southern Medical University, Sun Yat-sen Uni-
versity Cancer Center, and Guangdong Provincial Hospital of Chi-
nese Medicine. Informed consent was waived since this was a
retrospective study.
Patients
The overall study design is shown in Fig. 1. To predict NLR and
survival, this study retrospectively enrolled a training cohort
(n = 240), internal validation cohort 1 (n = 158), and internal valida-
tion cohort 2 (n = 522) from Nanfang Hospital of Southern Medical
University (SMU, Guangzhou, China) (2005–2015). The external
validation cohort (n = 1231, including external validation cohort 1
(n = 92) used for predicting NLR status) was retrospectively enrolled
from Sun Yat-sen University Cancer Center (SYUCC, 2008–2012). To
evaluate the response to anti-PD-1 immunotherapy and the clinical
outcomes of immunotherapy, this study retrospectively selected
patients with pathologically confirmed GC who received anti-PD-1
immunotherapy in Nanfang Hospital of Southern Medical Uni-
versity (n = 88) and Guangdong Provincial Hospital of Chinese
Medicine (GPHCM, Guangzhou, China) (n = 33) from January 2019 to
June 2021. The major inclusion and exclusion criteria are listed in
the Supplementary Methods.
PFS was defined as the time from anti-PD-1/PD-L1 chemotherapy
initiation to tumor progression or death from any cause. DFS was
defined as the time from surgery to either disease progression or death
from any cause. OS was defined as the time to death from any cause.
Immunohistochemistry staining and definition of NLR status
Formalin-fixed paraffin-embedded samples were processed for IHC
staining, as described in previous studies51,52
. The tumor and adja-
cent samples were incubated with antibodies against human CD8
and CD66b to mark lymphocytes and neutrophils13
. The NLR was
defined as the neutrophil count/the lymphocyte count. The NLR
status of the TIME was divided into three groups: NLR High (NLR-H:
NLR ≥ 1 both in intratumoral and peritumoral tissues); NLR Mix
(NLR-M: NLR ≥ 1 in intratumoral tissue and NLR < 1 in peritumoral
tissue, or NLR < 1 in intratumoral tissue and NLR ≥ 1 in peritumoral
tissue); NLR Low (NLR-L: NLR < 1 in both intratumoral and peritu-
moral tissues). Detailed information is shown in the Supplementary
Methods.
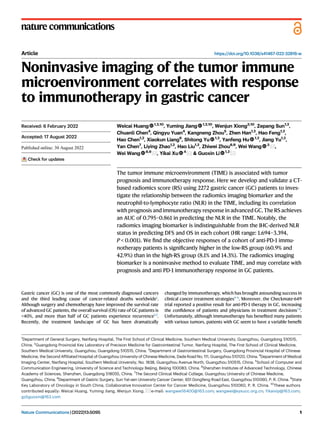
Fig. 5 | Performance of the radiomics imaging biomarker in evaluating the
response to anti-PD-1 immunotherapy and clinical outcomes of immunother-
apy. a Rad-score of different responses to anti-PD-1 immunotherapy in the SMU
cohort (OR: n = 30; SD: n = 16; PD: n = 42).b Rad-score of different responses to anti-
PD-1 immunotherapy in the GPHCM cohort (OR: n = 8; SD: n = 10; PD: n = 15); The
data are presented as the mean values with SEM. For statistical comparisons among
different groups, a two-tailed t test (unpaired) was used. c Rad-scores of patients
and proportions of anti-PD-1 immunotherapy responses in different RS groups of
the SMU cohort. d Rad-scores of patients and proportions of anti-PD-1 immu-
notherapy response in different RS groups of the GPHCM cohort. e CT images and
changes in tumor volume of different responses to anti-PD-1 immunotherapy.
f Progression-free survival of different RS groups in GC patients treated with anti-
PD-1 immunotherapy. g Overall survival of different RS groups in GC patients
treated with anti-PD-1 immunotherapy. Comparisons of the above progression
survival curves were performed with a two-sided log-rank test. Dashed lines around
the survival curves represent 95% confidence intervals. OR: objective response, SD:
stable disease, PD: progressive disease, RS-L: RS-Low group, RS-M: RS-Middle
group, RS-H: RS-High group, HR: hazard ratio, *P < 0.05, ***P < 0.001, ****P < 0.0001.
Source data are provided as a Source data file.
Article https://doi.org/10.1038/s41467-022-32816-w
Nature Communications| (2022)13:5095 11
12. Image acquisition, processing, and feature extraction
Portal venous phase CT images were obtained from the picture
archiving and communication system (PACS, Carestream Canada). The
acquisition parameters are shown in the Supplementary Methods.
Two radiologists, CC and QY with 12 and 11 years of clinical
experience in abdominal CT interpretation, respectively, manually
segmented the CT images using ITK-SNAP software (version 3.8, www.
itksnap.org). In addition to the tumor region, this study also developed
a peripheral ring surrounding the primary tumor region, which auto-
matically dilated the tumor boundaries by 2 mm on the outside and
shrunk the tumor boundaries by 1 mm on the inside (a ring with a
thickness of 3 mm), to extract the information of the invasive margin.
Air cavities, adjacent organs, and large vessels were excluded. All CT
images were processed following the Image Biomarker Standardiza-
tion Initiative (IBSI) guidelines53
.
This study extracted 584 quantitative features (292 in the peritu-
moral area and 292 in the intratumoral area) of each region of interest
(ROI). The feature pool had 14 first-order intensity features, eight
shape features, and 270 second- and higher-order textural features.
The extracted features are shown in the Supplementary Methods.
Radiomics imaging biomarker development and validation
For feature selection, the mRMR method was first used to eliminate the
redundant and irrelevant features, and then, the LASSO logistic
regression method was used to select the most predictive features of
the NLR in the training cohort. The dataset was resampled, and the
parameters were determined using the expected generalization error
estimated from 5-fold cross-validation. The RS was then developed via
a linear combination of the selected features weighted by their
respective coefficients in the training cohort. The cut-off values of the
NLR were created using the tertiles of the RS in the training cohort. The
patients were divided into three groups (RS-High, RS-Middle, and RS-
Low) based on the tertiles. The group classification details are listed in
the Supplementary Methods.
Receiver operating characteristic (ROC) curve analysis was used
to evaluate the predictive power of the RS in distinguishing NLR status.
The AUCs were used to compare the performance of the radiomics
imaging biomarker in each cohort.
Evaluation of prognosis and anti-PD-1 immunotherapy response
For patients without immunotherapy, Kaplan–Meier curves were used
to assess the DFS and OS of the defined RS groups to evaluate the
prognostic value of the radiomics imaging biomarker. The log-rank
test was used to statistically compare DFS and OS. Univariate and
multivariate Cox regression analyses of RS and other clin-
icopathological variables were performed to select candidate pre-
dictors of survival. Moreover, the statistically significant variables
(P < 0.05) in multivariate Cox regression analyses were incorporated
into the nomogram for predicting DFS and OS to improve the pre-
dictive power of the radiomics imaging biomarker. Harrell’s con-
cordance index (C-index) was used to assess the discrimination
performance of the prognostic nomogram and the radiomics imaging
biomarker.
For patients who received immunotherapy, the proportions of
different clinical responses were compared based on different RS
groups to evaluate the association between the radiomics imaging
biomarker and the response to anti-PD-1 immunotherapy. The clinical
responses were defined as complete response (CR), partial response
(PR), stable disease (SD), or progressive disease (PD) (evaluated at
3 months and 6 months) using RECIST version 1.150
. Moreover, PFS and
OS were compared for further evaluation.
Statistical analysis
SPSS version 22.0 (IBM), GraphPad Prism 8, and R version 4.0.2
(http://www.r-project.org) were used for all statistical analyses. A two-
tailed t-test (unpaired) was used to analyze continuous variable values.
The χ2
test and Fisher’s exact test were used to analyze categorical
variables. Univariate and multivariate Cox regression analyses were
used to assess the ability of the variables to predict survival. The
detailed algorithms used for statistical analysis are described in
the Supplementary Methods. A two-sided P < 0.05 was considered
statistically significant.
Reporting summary
Further information on research design is available in the Nature
Research Reporting Summary linked to this article.
Data availability
The source data underlying Figs. 2–5, Supplementary Figs. 1–13, and
Supplementary Table 10 is provided as a Source data file. The CT
imaging data and clinical information, analyzed during the current
study are not publicly available for patient privacy purposes. Source
data are provided with this paper.
Code availability
Associated codes to process and analyze data are available on GitHub
[https://github.com/Weicai-Huang/Weicai-Huang/tree/main]. Source
code has also been placed on the Zenodo platform [https://doi.org/10.
5281/zenodo.6979909]54
.
References
1. Bray, F. et al. Global cancer statistics 2018: GLOBOCAN estimates of
incidence and mortality worldwide for 36 cancers in 185 countries.
CA Cancer J. Clin. 68, 394–424 (2018).
2. Liu, D. et al. The patterns and timing of recurrence after curative
resection for gastric cancer in China. World J. Surg. Oncol. 14,
305 (2016).
3. Jiang, Y. et al. Association of adjuvant chemotherapy with survival in
patients with stage II or III gastric cancer. JAMA Surg. 152,
e171087 (2017).
4. Robert, C. et al. Pembrolizumab versus ipilimumab in advanced
melanoma. N. Engl. J. Med. 372, 2521–2532 (2015).
5. Umeda, Y. et al. Real-world efficacy of anti-PD-1 antibody or com-
bined anti-PD-1 plus anti-CTLA-4 antibodies, with or without radio-
therapy, in advanced mucosal melanoma patients: a retrospective,
multicenter study. Eur. J. Cancer 157, 361–372 (2021).
6. Zhou, Y. et al. Nivolumab plus ipilimumab versus pembrolizumab as
chemotherapy-free, first-line treatment for PD-L1-positive non-small
cell lung cancer. Clin. Transl. Med. 10, 107–115 (2020).
7. Pietrantonio, F. et al. Predictive role of microsatellite instability for
PD-1 blockade in patients with advanced gastric cancer: a meta-
analysis of randomized clinical trials. ESMO Open 6, 100036 (2021).
8. Moehler, M. et al. LBA6_PR Nivolumab (nivo) plus chemotherapy
(chemo) versus chemo as first-line (1L) treatment for advanced
gastric cancer/gastroesophageal junction cancer (GC/GEJC)/eso-
phageal adenocarcinoma (EAC): first results of the CheckMate
649 study. Ann. Oncol. 31, S1191 (2020).
9. Chen, D. S. & Mellman, I. Elements of cancer immunity and the
cancer-immune set point. Nature 541, 321–330 (2017).
10. Fridman, W. H., Zitvogel, L., Sautès-Fridman, C. & Kroemer, G. The
immune contexture in cancer prognosis and treatment. Nat. Rev.
Clin. Oncol. 14, 717–734 (2017).
11. Ligon, J. et al. 506 The tumor immune microenvironment of meta-
static osteosarcoma is marked by lymphocyte exclusion and
impacts patient progression-free survival. J. Immunother. Cancer 8,
A310 (2020).
12. Abdul Sater, H. et al. Neoadjuvant PROSTVAC prior to radical
prostatectomy enhances T-cell infiltration into the tumor immune
microenvironment in men with prostate cancer. J. Immunother.
Cancer 8, e000655 (2020).
Article https://doi.org/10.1038/s41467-022-32816-w
Nature Communications| (2022)13:5095 12
13. 13. Coffelt, S. B., Wellenstein, M. D. & de Visser, K. E. Neutrophils in
cancer: neutral no more. Nat. Rev. Cancer 16, 431–446 (2016).
14. Guthrie, G. J. K. et al. The systemic inflammation-based neutrophil-
lymphocyte ratio: experience in patients with cancer. Crit. Rev.
Oncol. Hematol. 88, 218–230 (2013).
15. Templeton, A. J. et al. Prognostic role of neutrophil-to-lymphocyte
ratio in solid tumors: a systematic review and meta-analysis. J. Natl
Cancer Inst. 106, dju124 (2014).
16. Alessi, J. V. et al. Low peripheral blood derived neutrophil-to-
lymphocyte ratio (dNLR) is associated with increased tumor T-cell
infiltration and favorable outcomes to first-line pembrolizumab in
non-small cell lung cancer. J. Immunother. Cancer 9, e003536
(2021).
17. Gillies, R. J., Kinahan, P. E. & Hricak, H. Radiomics: images are more
than pictures, they are data. Radiology 278, 563–577 (2016).
18. Limkin, E. J. et al. Promises and challenges for the implementation
of computational medical imaging (radiomics) in oncology. Ann.
Oncol. 28, 1191–1206 (2017).
19. Lambin, P. et al. Radiomics: the bridge between medical imaging
and personalized medicine. Nat. Rev. Clin. Oncol. 14,
749–762 (2017).
20. Herbst, R. S. et al. Predictive correlates of response to the anti-PD-L1
antibody MPDL3280A in cancer patients. Nature 515,
563–567 (2014).
21. Braman, N. M. et al. Intratumoral and peritumoral radiomics for the
pretreatment prediction of pathological complete response to
neoadjuvant chemotherapy based on breast DCE-MRI. Breast Can-
cer Res. 19, 57 (2017).
22. Jiang, Y. et al. Noninvasive imaging evaluation of tumor immune
microenvironment to predict outcomes in gastric cancer. Ann.
Oncol. 31, 760–768 (2020).
23. Mu, W. et al. Non-invasive measurement of PD-L1 status and pre-
diction of immunotherapy response using deep learning of PET/CT
images. J. Immunother. Cancer 9, e002118 (2021).
24. Beig, N. et al. Perinodular and intranodular radiomic features on
lung CT images distinguish adenocarcinomas from granulomas.
Radiology 290, 783–792 (2019).
25. Peng, H. et al. Prognostic value of deep learning PET/CT-based
radiomics: potential role for future individual induction che-
motherapy in advanced nasopharyngeal carcinoma. Clin. Cancer
Res. 25, 4271–4279 (2019).
26. Jiang, Y. et al. Radiomics signature of computed tomography ima-
ging for prediction of survival and chemotherapeutic benefits in
gastric cancer. EBioMedicine 36, 171–182 (2018).
27. Jiang, Y. et al. ImmunoScore signature: a prognostic and predictive
tool in gastric cancer. Ann. Surg. 267, 504–513 (2018).
28. Khorrami, M. et al. Changes in CT radiomic features associated with
lymphocyte distribution predict overall survival and response to
immunotherapy in non-small cell lung cancer. Cancer Immunol.
Res. 8, 108–119 (2020).
29. Sun, R. et al. A radiomics approach to assess tumour-infiltrating
CD8 cells and response to anti-PD-1 or anti-PD-L1 immunotherapy:
an imaging biomarker, retrospective multicohort study. Lancet
Oncol. 19, 1180–1191 (2018).
30. Ostman, A. The tumor microenvironment controls drug sensitivity.
Nat. Med. 18, 1332–1334 (2012).
31. Sun, C., Mezzadra, R. & Schumacher, T. N. Regulation and function
of the PD-L1 checkpoint. Immunity 48, 434–452 (2018).
32. Soldevilla, B. et al. The correlation between immune subtypes and
consensus molecular subtypes in colorectal cancer identifies novel
tumour microenvironment profiles, with prognostic and ther-
apeutic implications. Eur. J. Cancer 123, 118–129 (2019).
33. Hegde, P. S., Karanikas, V. & Evers, S. The where, the when, and the
how of immune monitoring for cancer immunotherapies in the era
of checkpoint inhibition. Clin. Cancer Res. 22, 1865–1874 (2016).
34. McCourt, M., Wang, J. H., Sookhai, S. & Redmond, H. P. Proin-
flammatory mediators stimulate neutrophil-directed angiogenesis.
Arch. Surg. 134, 1325–1331 (1999).
35. Schaider, H. et al. Differential response of primary and metastatic
melanomas to neutrophils attracted by IL-8. Int. J. Cancer 103,
335–343 (2003).
36. Deryugina, E. I. et al. Tissue-infiltrating neutrophils constitute the
major in vivo source of angiogenesis-inducing MMP-9 in the tumor
microenvironment. Neoplasia 16, 771–788 (2014).
37. Houghton, A. M. et al. Neutrophil elastase-mediated degradation of
IRS-1 accelerates lung tumor growth. Nat. Med. 16, 219–223 (2010).
38. Schalper, K. A. et al. Elevated serum interleukin-8 is associated with
enhanced intratumor neutrophils and reduced clinical benefit of
immune-checkpoint inhibitors. Nat. Med. 26, 688–692 (2020).
39. Lorente, D. et al. Baseline neutrophil-lymphocyte ratio (NLR) is
associated with survival and response to treatment with second-
line chemotherapy for advanced prostate cancer independent of
baseline steroid use. Ann. Oncol. 26, 750–755 (2015).
40. Zurlo, I. V. et al. Predictive value of NLR, TILs (CD4+/CD8+) and PD-L1
expression for prognosis and response to preoperative che-
motherapy in gastric cancer. Cancer Immunol. Immunother. 71,
45–55 (2022).
41. Simonaggio, A. et al. Variation in neutrophil to lymphocyte ratio
(NLR) as predictor of outcomes in metastatic renal cell carcinoma
(mRCC) and non-small cell lung cancer (mNSCLC) patients treated
with nivolumab. Cancer Immunol. Immunother. 69,
2513–2522 (2020).
42. Greten, F. R. & Grivennikov, S. I. Inflammation and cancer: triggers,
mechanisms, and consequences. Immunity 51, 27–41 (2019).
43. FDA. FDA Approves Atezolizumab as Adjuvant Treatment for Non-
Small Cell Lung Cancer. https://www.fda.gov/drugs/resources-
information-approved-drugs/fda-approves-atezolizumab-adjuvant-
treatment-non-small-cell-lung-cancer (2021).
44. Baxter, M. A., Middleton, F., Cagney, H. P. & Petty, R. D. Resistance to
immune checkpoint inhibitors in advanced gastro-oesophageal
cancers. Br. J. Cancer 125, 1068–1079 (2021).
45. Havel, J. J., Chowell, D. & Chan, T. A. The evolving landscape of
biomarkers for checkpoint inhibitor immunotherapy. Nat. Rev.
Cancer 19, 133–150 (2019).
46. Fuchs, C. S. et al. Safety and efficacy of pembrolizumab mono-
therapy in patients with previously treated advanced gastric and
gastroesophageal junction cancer: phase 2 clinical KEYNOTE-059
trial. JAMA Oncol. 4, e180013 (2018).
47. Li, Q. et al. PD-L1 is prognostic and a negative predictor of response
to immunotherapy in gastric cancer. Mol. Ther. 30, 621–631
(2022).
48. Gandhi, L. et al. Pembrolizumab plus chemotherapy in metastatic
non-small-cell lung cancer. N. Engl. J. Med. 378, 2078–2092 (2018).
49. Sun, Y.-T. et al. PD-1 antibody camrelizumab for Epstein-Barr virus-
positive metastatic gastric cancer: a single-arm, open-label, phase
2 trial. Am. J. Cancer Res. 11, 5006–5015 (2021).
50. Kim, S. T. et al. Comprehensive molecular characterization of clin-
ical responses to PD-1 inhibition in metastatic gastric cancer. Nat.
Med. 24, 1449–1458 (2018).
51. Jiang, Y. et al. ImmunoScore signature: a prognostic and predictive
tool in gastric cancer. Ann. Surg. 267, 504–513 (2018).
52. Jiang, Y. et al. Immunomarker support vector machine classifier for
prediction of gastric cancer survival and adjuvant chemother-
apeutic benefit. Clin. Cancer Res. 24, 5574–5584 (2018).
53. Zwanenburg, A. et al. The image biomarker standardization initia-
tive: standardized quantitative radiomics for high-throughput
image-based phenotyping. Radiology 295, 328–338 (2020).
54. Weicai, H. et al. Noninvasive imaging of the tumor immune micro-
environment correlates with response to immunotherapy in gastric
cancer. https://doi.org/10.5281/zenodo.6979909 (2022).
Article https://doi.org/10.1038/s41467-022-32816-w
Nature Communications| (2022)13:5095 13