How To Analysis The Performance Issue Of Linux Kernel
•
5 likes•2,209 views

We use a case study to demonstrate how to use different profiling tools and study kernel code to analysis the root cause of linux kernel level performance issue.

Recommended
Recommended
More Related Content
Viewers also liked
Viewers also liked (20)
More from Xu Jiang
Recently uploaded
Recently uploaded (20)
How To Analysis The Performance Issue Of Linux Kernel
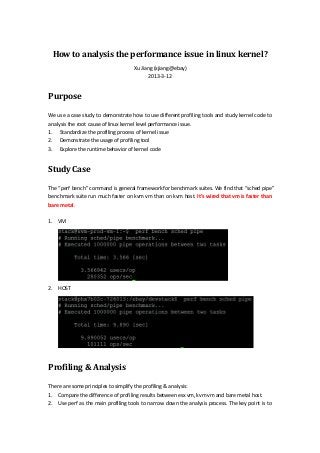
- 1. How to analysis the performance issue in linux kernel? Xu Jiang (xjiang@ebay) 2013-3-12 Purpose We use a case study to demonstrate how different profiling tools and kernel code analysis the root cause of linux kernel level performance issue. 1. Standardize the profiling process of kernel issue 2. Demonstrate the usage of profiling tool 3. Explore the runtime behavior of kernel code Study Case The “perf bench” command is general framework for benchmark suites. We find that “sched pipe” benchmark suite run much faster on kvm vm than on kvm host. It’s wired that vm is faster than bare metal. 1. VM 2. HOST Profiling & Analysis There are some principles to simplify the profiling & analysis: 1. Compare the difference of profiling results between esx vm, kvm vm and bare metal host. 2. Use perf as the main profiling tools to narrow down analysis process. The key point is to
- 2. find the good perf event. 3. Use micro benchmark tools to narrow down the issue and make it easily reproducible. System Level Profiling & Analysis Target: what kernel activity cause host os much slow? 1. Check “dmesg” to make sure that OS is in normal mode. 2. Use “vmstat” to check the overall OS status. We find that there is much more interrupts on host than on vm. a) VM b) HOST 3. Since the vm has only 8 vcpu and host 24 cpu, use “top -H” or “mpstat –P ALL” to verify how many thread & cpu is used on vm and host. “perf bench sched pipe” use 2 processes to send/receive on one pipe. a) HOST
- 3. b) VM 4. Since host has much more interrupts, we use “itop” to analysis the interrupts in /proc/interrupts. We find lots of IPI rescheduling interrupts. a) HOST
- 4. b) VM 5. Use “perf record -e cycles:pp -g perf bench sched pipe” to profiling the benchmark. And use “perf report -n” to analysis the results. We find many schedule related functions at the top of host profiling. a) HOST (NOTE: “-e cycles:pp” can enable intel PEBS that provide precise instruction address.)
- 5. b) VM (NOTE: kvm don’t support PEBS. And it’s better to disable NMI watchdog on a host. http://www.linux-kvm.org/wiki/index.php?title=Guest_PMU&printable=yes ) 6. Since the rescheduling interrupt will trigger cpu migration, we use “perf record -e migrations -g perf bench sched pipe” to profile the migration events. We find that most migrations is triggered by try_to_wake_up() kernel fucntion. a) HOST
- 6. b) VM 7. We use “perf stat -e 'kvm:*' -a sleep 10s” on host to profiling the kvm events. We find that the number of “kvm:kvm_apic_ipi” is low
- 7. Code Level Profiling & Analysis Target: why the host os has much more cpu migration? 1. Search http://lkml.org/ for more information a) Click any message in home page. b) You can find a “google search” box at the head of page. 2. Install debug symbol package of kernel (NOTE: set http_proxy & apt.conf proxy if necessary) a) Add ddeb source b) Add ddeb key c) Install dbgsym echo "deb http://ddebs.ubuntu.com $(lsb_release -cs) main restricted universe multiverse deb http://ddebs.ubuntu.com $(lsb_release -cs)-updates main restricted universe multiverse deb http://ddebs.ubuntu.com $(lsb_release -cs)-security main restricted universe multiverse deb http://ddebs.ubuntu.com $(lsb_release -cs)-proposed main restricted universe multiverse" | sudo tee -a /etc/apt/sources.list.d/ddebs.list sudo gpg --keyserver hkp://keyserver.ubuntu.com:80 --recv-keys ECDCAD72428D7C01
- 8. d) Verify buildid of image & debug symbol package 3. Study kernel code in lxr: http://lxr.free-electrons.com/ a) Choose same kernel version as the test host b) Use “Identifier search” to find the source code. For example: http://lxr.free-electrons.com/ident?v=3.2&i=select_task_rq & http://lxr.free-electrons.com/source/kernel/sched_fair.c?v=3.2#L2401 c) CPU migration code path: try_to_wake_up --> select_task_rq --> select_task_rq_fair --> select_idle_sibling & find_idlest_cpu 4. Add dynamic probe for kernel function a) We add dynamic probe to understand the code path of cpu migration sudo apt-get install linux-image-$(uname -r)-dbgsym eu-readelf -n /boot/vmlinuz-3.2.0-24-generic | grep Build eu-readelf -n /usr/lib/debug/boot/vmlinux-3.2.0-24-generic | grep Build
- 9. 5. Profile these dynamic probes a) To get accurate code execute path, we use “-c 1” to set the event sample period as 1. We can find that select_idle_sibling decide the new cpu. 6. Use systemtap to analysis the kernel function internal a) As perf can only give the statistics data, we use systemtap to internal info of kernel function. b) Use “stap -L” to get the arguments of select_idle_sibling(). c) Write a systemtap script for profiling select_idle_sibling(). d) Run systemtap script: stap ./schedule.stp -c 'perf bench sched pipe -l 100'. We can find perf probe -k /usr/lib/debug/boot/vmlinux-3.2.0-24-generic -a select_task_rq_fair perf probe -k /usr/lib/debug/boot/vmlinux-3.2.0-24-generic -a select_idle_sibling perf probe -k /usr/lib/debug/boot/vmlinux-3.2.0-24-generic -a find_idlest_cpu perf record -e probe:select_task_rq_fair -e probe:select_idle_sibling -e probe:find_idlest_cpu -c 1 perf bench sched pipe -l 1000 global diff_count probe kernel.function("select_idle_sibling").return { if ($target != $return) { #printf("from=%d, to=%dn", $target, $return); diff_count++; } } probe end { printf("nn+++different cpu: %d+++n", diff_count); }
- 10. vm always using the same cpu for new task and host may use different task. i. HOST ii. VM 7. The cpu migration is decided by schedule domain. It organizes the cpus on a multi-processor system into a hierarchy and balancing the load across CPUs. As host has 12 siblings and vm has no sibling, will always return the same cpu and host may return different cpu. So, vm won’t have cpu migration for this case. a) /proc/cpuinfo i. HOST ii. VM
- 11. b) /sys/devices/system/cpu/cpuX/topology i. HOST ii. VM